Until about 25 years ago, direct noninvasive investigation of conduction in central motor pathways was not possible. Transcranial magnetic stimulation (TMS) was first described by Barker and co-workers in 1985 as a noninvasive and painless way to stimulate the human brain. Since then, refinements in technique have allowed the technique to be introduced into clinical practice for both diagnostic and therapeutic purposes, and developed as a research tool.
Development and technical considerations
A conducting coil is placed tangential to the scalp and a brief, high-current pulse is passed through the coil. Depending on the machine, the current may have a monophasic or biphasic waveform ( Fig. 28-1 ). A rapidly changing magnetic field is produced around the coil, with lines of flux passing perpendicularly to its plane. The magnetic field can reach up to 3 Tesla and lasts approximately 100 μsec. The changing magnetic field generates an electrical field perpendicular to the magnetic field. In a homogeneous medium, the spatial change in the electric field causes current to flow in loops parallel to the plane of the coil, which is usually tangential to the surface of the scalp. The induced electric field causes ions to flow in the brain, depolarizing or hyperpolarizing neurons. Experimental evidence indicates that stimulation occurs at a lower threshold where axons terminate or bend sharply. Accordingly, stimulation should occur where the electric field is strongest and at points of change in the structure of an axon.

Magnetic coils may take various shapes. Although circular coils are powerful, coils with a figure-of-eight shape are more focal, producing maximal current at the intersection of the circular components. They generate magnetic fields that stimulate outer layers of the cortex. The Hesed coil (H-coil) is yet another configuration, its complex windings allowing for a slower fall-off of magnetic field intensity with depth. The H-coil effects reach deeper than circular or figure-of-eight coils.
The physiologic responses to TMS are best described for the motor cortex. TMS of the motor cortex of sufficient intensity activates the descending corticospinal fibers (see Fig. 28-1 ). A single TMS pulse results in multiple volleys in the corticospinal tract. They activate spinal motor neurons that send volleys in the peripheral nerve to cause a muscle twitch, and the stimulation is recorded as a motor evoked potential (MEP) (see Fig. 28-1 ). A stronger pulse results in wider and deeper areas of activation in the motor cortex.
TMS Parameters
Different TMS measures are used to evaluate cortical excitability and corticospinal transmission, and they are useful in understanding changes in brain physiology in health and disease. The more common measures are discussed here. The motor threshold refers to the lowest TMS intensity capable of eliciting small MEPs, which are usually defined as more than 50 μV in peak-to-peak amplitude for resting muscles or more than 200 μV in active muscles in at least 5 of 10 trials. Although it is largely independent (in adults) of age, gender, and hemisphere, the motor threshold provides information about the excitability of a central core of neurons in the motor cortex, being lower in the cortical representation of intrinsic hand muscles than of lower limb and trunk muscles. This likely reflects differences in the strength of corticospinal projection and neuronal membrane excitability because it increases with drugs that block voltage-gated sodium channels. The recruitment curve, also known as stimulus–response curve, refers to the increase in MEP amplitude ( Fig. 28-2 ) with increasing TMS intensity. Compared to motor threshold, this measure assesses neurons that are intrinsically less excitable or spatially further from the center of activation. The slope of the recruitment curve is increased by drugs that increase adrenergic transmission (e.g., dextroamphetamine) and is decreased by sodium and calcium channel blockers (e.g., lamotrigine) and by drugs that enhance the effects of gamma-aminobutyric acid (GABA; e.g., lorazepam). The size of the MEP varies considerably from one stimulus to the next and among individuals.

MEP latency is the time between the delivery of the TMS pulse and the resulting response, and it reflects the conduction time from the cortex to the target muscle (see Fig. 28-2 ). The conduction time from motor cortex to the motor neuron pool in the spinal cord or brainstem, known as the central motor conduction time (CMCT), can be obtained by subtracting the peripheral conduction time from the MEP latency. A common way to measure CMCT is the F-wave method using the formula
( F – wave latency + M – wave latency − 1 ) 2
The M wave is the direct muscle response to motor nerve stimulation and the F wave is the muscle response produced by activation of the alpha motor neuron by the antidromic volley. Electrical or magnetic stimulation of the spine may also be used to establish the peripheral conduction time, especially in proximal muscles where the F-wave method cannot be applied. CMCT usually is measured with the target muscle active, thereby giving the shortest latency from the cortex to the muscle.
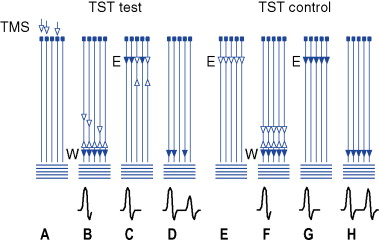
Another way to study corticospinal conduction is with the triple-stimulation technique. This is a collision method that synchronizes the response of the motor neurons driven to discharge by the transcranial stimulus, thereby avoiding phase cancellation that accompanies the desynchronization of the biphasic motor unit potentials ( Fig. 28-3 ). Three stimuli are given in sequence and with appropriate delays. The first stimulus is TMS, followed by two supramaximal stimuli given to the nerve supplying the target muscle, first distally then proximally. Thus, only the action potentials elicited initially by TMS descend on the axons of the peripheral nerve and do so in a synchronized manner. Comprehensive descriptions of the technique are available in several publications. It allows precise quantification of central conduction failures caused by reduced excitability or loss of cortical motor neurons and can allow assessment of conduction to muscles other than hand muscles. It is considered two to three times more sensitive than standard TMS procedures to detect corticospinal conduction deficits in patients with central nervous system disorders and is specially suited for the detection and quantification of small changes of central motor conduction.
Stimulating the corticospinal tract at the level of the foramen magnum activates the corticospinal tract at the pyramidal decussation. It produces a single descending volley rather than the multiple volleys from TMS of the motor cortex, and can be used with CMCT to localize a corticospinal tract lesion above or below the foramen magnum.
In addition to testing the corticospinal tract, TMS may be used to investigate the facilitatory and inhibitory mechanisms in the motor cortex. Short-interval intracortical inhibition and intracortical facilitation (ICF) are obtained with paired-pulse studies and reflect interneuron influences in the cortex. In these studies, a conditioning stimulus strong enough to activate cortical neurons but below the threshold for producing descending influence on the spinal cord is applied. A second, suprathreshold test stimulus follows. Intracortical effects produced by the conditioning stimulus modulate the MEP amplitude of the subsequent test stimulus. At interstimulus intervals (ISI) of less than 5 msec, inhibition is produced; facilitation is produced at ISIs of 8 to 30 msec. Short-interval intracortical inhibition likely is mediated largely by GABA A receptors and can be used to assess changes in cortical excitability. ICF may be mediated partly by glutamate.
Long-interval intracortical inhibition is another measure of intracortical inhibition elicited by suprathreshold conditioning and test stimuli at ISIs of 50 to 200 msec. It likely shares mechanisms with the suppression of voluntary muscle contraction induced by a single suprathreshold TMS pulse known as the silent period. The silent period is a pause in ongoing voluntary EMG activity produced by TMS as a result of spinal cord refractoriness and cortical inhibition (see Fig. 28-2 ). This type of inhibition appears to be mediated by GABA B receptors and is modulated by sleep deprivation, muscle fatigue, and repetitive TMS (rTMS).
Interhemispheric or transcallosal inhibition induced by motor cortex stimulation can be assessed by the ipsilateral silent period, which refers to interruption of ongoing EMG activities in ipsilateral muscles. Since the ipsilateral silent period is absent or delayed in patients with congenital, acquired, or surgical lesions of the corpus callosum, it is likely due to transcallosal inhibition. Interhemispheric callosal connections can also be studied by a paired-pulse paradigm, with conditioning stimuli over one hemisphere and test stimuli over the opposite hemisphere. Interhemispheric inhibition is produced at ISIs of 8 to 50 msec. Cerebellar TMS suppresses the contralateral motor cortex at ISIs of 5 to 8 msec. The effect was absent in patients with degeneration of the cerebellar cortex or lesions in the cerebellothalamocortical pathway.
Short- and long-latency afferent inhibition refers to effects on cortical excitability produced at latencies of about 20 msec and 200 msec, respectively, after somatosensory stimulation of the hand. Selective blockage by scopolamine suggests that muscarinic cholinergic transmission is involved in mediating short-latency afferent inhibition.
Stimulation Protocols
TMS may be applied as single-pulse TMS, paired-pulse TMS, or repetitively (rTMS). Physiologic effects of rTMS depend on a number of factors such as coil geometry, stimulation site, intensity, frequency, duration of stimulation, and the number of stimulation sessions. rTMS can produce powerful effects that outlast the period of stimulation, producing cortical inhibition with stimulation at low frequencies (1 Hz or lower), and cortical excitation with stimulation at high frequencies (5 Hz or higher). New rTMS approaches include high-frequency bursts of stimuli at theta frequencies (5 Hz), termed theta burst stimulation (TBS). The temporal pattern of the bursts determines whether the protocols are facilitatory (intermittent TBS; iTBS) or inhibitory (continuous TBS; cTBS). Another type of TMS, quadripulse stimulation, consists of four monophasic pulses of the same intensity separated by 1.5 msec, repeatedly given at 0.2 Hz. Quadripulse stimulation induces long-lasting, locally restricted facilitation of motor cortical excitability for up to 75 minutes without affecting the motor thresholds. It thus holds promise for inducing plastic changes in the brain. Since conventional rTMS methods are not able to activate deep brain regions effectively, combining rTMS with the H-coil may help to stimulate deeper brain structures.
Safety Considerations
Overall, single- or paired-pulse TMS is considered safe. The magnetic field generated by TMS may interact with selected metals in cranial implants. The contraindications for single- and paired-pulse TMS are similar to those of magnetic resonance imaging (MRI) and mainly involve the presence of intracranial ferromagnetic material such as aneurysm clips. Some titanium implants are not magnetic and may prove safe for TMS exposure. Removal of glasses, watches, jewelry, and other magnetically reactive accessories is advised. Cardiac pacemakers are considered safe, according to the most recent safety guideline. In patients with implanted electrodes for deep brain stimulation, single- and paired-pulse TMS has been applied safely when the TMS coil is not in close proximity to the implanted pulse generator. Epilepsy may be considered a relative contraindication; the risk of inducing a seizure with single- or paired-pulse TMS is low.
For rTMS, seizure is the most serious acute adverse event, although the overall risk is still low. Since seizures generally are associated with prolonged trains of high-frequency rTMS at high intensities, safety guidelines to limit rTMS stimulation parameters have been published to minimize this risk. Since their publication, the occurrences of seizures with rTMS are related mostly to rTMS parameters exceeding the guidelines, patients treated with drugs that potentially lower seizure threshold, or patients with neurologic disorders known to increase the risk for seizure. Electrode heating or burns when rTMS is administered in patients with scalp electroencephalographic (EEG) electrodes have been reported. The use of low-conductivity plastic and radial notching of electrodes can reduce heating.
Rapid mechanical deformation of the TMS stimulating coil when it is energized produces an intense, broad-band acoustic artifact that may exceed 140 dB of sound pressure level, carrying a potential for hearing damage. The majority of studies in which hearing protection was used report no change in hearing after TMS; hearing protection with ear plugs is recommended. The most common side-effect of TMS is pain. The intensity of pain experienced varies depending on individual susceptibility, scalp location, coil design, intensity, and frequency of stimulation. Patients and subjects should be warned that TMS, especially rTMS, may not be pleasant and may cause pain; the pain has not been reported to persist for more than a few days.
Related posts:
 Electrophysiologic Equipment and Electrical Safety
Electroencephalography: General Principles and Clinical Applications
Nerve Excitability: A Clinical Translation
The Blink Reflex and Other Cranial Nerve Reflexes
Neuromuscular Ultrasound as a Complement to the Electrodiagnostic Evaluation
Polysomnographic Evaluation of Sleep Disorders
Electrophysiologic Equipment and Electrical Safety
Electroencephalography: General Principles and Clinical Applications
Nerve Excitability: A Clinical Translation
The Blink Reflex and Other Cranial Nerve Reflexes
Neuromuscular Ultrasound as a Complement to the Electrodiagnostic Evaluation
Polysomnographic Evaluation of Sleep Disorders
Stay updated, free articles. Join our Telegram channel

Full access? Get Clinical Tree


