Figure 7.1 shows the basic components of the digital EEG signal path from the electrodes to the display. Several components (jackbox, differential amplifier, display) parallel those encountered in analog EEG machines (
Chapter 6). The features of these components that differ from analog EEG will be highlighted in the sections below. Components unique to digital EEG systems include (i) the analog-to-digital converter (ADC), which samples the analog EEG signal and converts it into discrete digital data; (ii) the computer or microprocessor, which stores and manipulates the digital data for optimal review; (iii) monitors for display of EEG data; and (iv) digital storage devices and networking equipment, which allow archiving of EEG data and transmission to remote sites. Some systems contain video processors and sound cards for simultaneous acquisition and synchronization of video and audio data. The hardware and software capabilities of current digital EEG systems vary significantly between vendors. This review cannot describe all possible digital system specifications but aims to provide a summary of the most important features.
Electrodes
Along the signal acquisition path, we turn to the first component—the electrodes. These are discussed in detail in
Chapter 6. One significant difference from analog EEG is the requirement for one additional electrode, the machine reference, which we shall discuss below in the section on (differential) amplification. As with analog EEG, a good recording depends on low-impedance electrical contact with the scalp. Most current commercial EEG acquisition machines have functionality for checking electrode impedances. In general, these are software automated. For each electrode, the impedance is estimated by forming a complete circuit, starting with that electrode, then creating a return path with all the other electrodes joined (so that section of the circuit has an impedance equivalent to all other electrodes in parallel, and thus small). A small (microvolt) voltage (typically oscillatory, on the order of 30 Hz) is applied, and the current is measured. The impedance of that single electrode contact is thereby estimated by the voltage (known) divided by the current (measured). For standard scalp electrodes applied with electrolytic paste, impedances should be less than 5 kΩ. This technique relies, of course, on the assumption that at least some of the electrodes are well connected. If all electrodes have poor contact, spurious results can be obtained.
Routine digital EEG has no requirements for specialized electrodes. Current protocols for experimental digital EEG acquisition at high sampling rate with intracranial implantation may derive benefit from specialized microelectrodes that have a smaller contact area and may be able to detect spatially localized multiunit or even single-unit firing trains.
Electrode Input Board or Jackbox
Jackboxes for digital EEG typically have a greater number of electrode inputs than analog machines. The standard number of inputs for routine EEG is 32, but jackboxes accepting 64, 128, or even 256 inputs are common for epilepsy monitoring and intracranial EEG recordings. Additional inputs can accommodate additional EEG electrodes, such as 10-10 modified International System placements, as well electro-oculogram, electromyogram, or other polygraphic inputs (
6). Jackbox inputs are labeled with the location of the electrode on the head according to the International 10-20 System (
6) or numbered.
In addition, there are inputs for ground and for a machine reference (sometimes called recording reference) electrode, which is usually placed in a location not susceptible to large artifacts, such as the midline central-parietal region.
In contrast to analog systems using electrode selectors, most digital amplifiers are “hard-wired,” with the signal from each jackbox position going to Input 1 of a specific amplifier. Input 2 for all amplifiers is the machine reference electrode. Some digital systems have electronically switched jackboxes to allow amplifier input channels to be switched among different electrodes. Because all EEG activity is acquired in relation to the machine reference electrode, the data in all channels may be distorted if this reference electrode is of high impedance. With a high impedance reference, external noise may overwhelm the EEG signal, producing a very low amplitude recording with little signal. (This is different from effects of high impedance in any other electrode, which can increase the apparent EEG amplitude through ground reference recording, in addition to showing the noise.) To prevent this problem, the EEG should be reviewed during the recording in a machine reference montage to check for excessive noise in the reference electrode.
Digital EEG jackboxes may be housed in the same enclosure as other digital components, such as preamplifiers (see the section “
Amplifiers”). The short distance between the scalp electrode and this first amplification step reduces electrical interference and artifact in the EEG signal. ADCs may also be present in the jackbox itself, as in systems for ambulatory recording (
7). The jackbox also contains or is connected to an
impedance meter to allow measurement of electrode impedance (see the section “
Electrodes”) without unplugging the electrode wires from the electrode input panel.
Amplifiers
The first active components in the signal path are the (pre)amplifiers. Prior to digitization, the signals—which are in the microvolt range—must be amplified. This may be done via one or more cascaded amplifiers. Modern amplifiers are small, low-power, single-chip multichannel devices with solid-state integrated circuits. Noise (generated by random movement of electrons within amplifier circuits such as resistors and semiconductors) should be less than 2 µV peak to peak. Amplifiers are electrically or optically isolated to prevent conduction of current from the EEG machine to the patient through the EEG electrodes.
Properly designed, the first amplifier (often called a preamplifier) has high input impedance (on the order of mega- to teraohms), which allows the source signals to be precisely captured, without drawing significant current which would create distortions in the voltage to be measured (
8). They also raise the signal into a range where stray device noise (powerline, television, radio) is negligible and so cannot disturb the signal. Finally, commercial ADCs have an expected input range, such as ± 5 V. To take full advantage of the amplitude resolution of the ADC, input signals must be brought up to this voltage range by amplification (though not over it, since this would “clip” the signal).
For EEG, one of the most important aspects of the amplification stage is the use of differential amplifiers. Both analog and digital EEG employ differential amplifiers. Differential amplifiers have three input connections: (i) inverting input; (ii) noninverting input; and (iii) ground, typically placed on the forehead, and a single output. The output is the difference between the two inputs multiplied by some constant—the amplification factor, or gain. Gain for clinical EEG machines is usually in the range of 2000 to 20,000, but can be up to 1,000,000. The gain equals output voltage divided by input voltage. Gain is typically expressed as a logarithmic ratio in decibels (dB), with gain (dB) = 20(log(Vout/Vin)). For instance, with inputs of 106 µV (noninverting) and 104 µV (inverting), and amplification factor (gain) of 20, the output will be 40 µV.
(In our figures, we show the electrical symbol for an op-amp, short for operational amplifier. Op-amps do amplify the difference between their inputs, but this is a simplification. Actual hardware differential amplifiers are more complex circuits, using a combination of op-amps with other circuit elements, specifically designed and tuned to amplify the difference in voltage even when both voltages may be quite large in absolute value. See more about common-mode rejection below.)
In analog EEG, the montage is fixed at acquisition time by the fact that the electrodes are mechanically connected to a set of differential amplifiers for that montage.
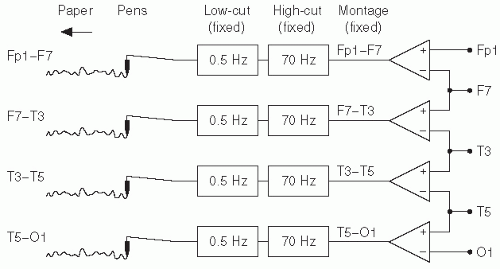
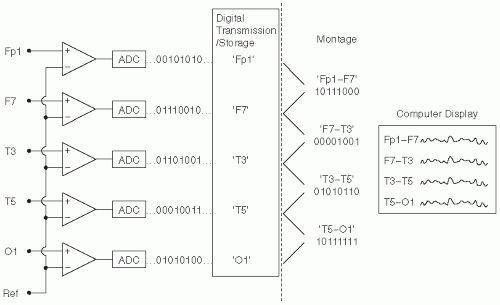
Figure 7.2 shows a simple diagram of the arrangement of differential amplifiers for analog EEG for a longitudinal bipolar montage. Digital EEG also employs differential amplifiers, but with a significant distinction. Instead of determining the difference between electrode inputs at acquisition time, each electrode is acquired relative to one fixed common electrode, the
machine reference. These individual electrode channels are then digitized and stored. Later review with tracings displayed in different montages can be performed by digitally reconstructing the montages.
Figure 7.3 shows a simple diagram highlighting this difference from analog EEG. Note that the vertical dashed line separates the fixed, unalterable acquired data on the left, from computations on the right showing the data in one of many possible different montages, which can be easily reconstructed. Also note that the input to the inverting contact for each differential amplifier is the machine reference for
all the electrode channels recorded.
There are several other aspects of amplifiers that could impact the data acquisition. The common-mode-rejection ratio (CMRR) is a measure of how well the differential amplifier reflects the difference between the inputs, especially when both inputs are large in magnitude. Real differential amplifiers can be best modeled as generating an output voltage V0 as
The coefficient Ad is the differential gain and As is called the common-mode gain. The common-mode rejection ratio is
So, a CMRR of 80 dB, as recommended by American Clinical Neurophysiology Society (ACNS) (
9), indicates that the amplifier will begin to lose accuracy when the absolute magnitude is 10,000 (10
4) times the difference in magnitudes (e.g., 10,001 µV – 10,000 µV). Most of the common mode signal is 60 Hz noise, and the magnitude of that noise is determined more by the electrode impedances than circuit specifications.
Analog Filters
Prior to digitization, analog electrical filtering is applied. The fundamentals of analog filter design are discussed in
Chapter 6. In contrast to analog machines, digital EEGs are acquired using broad bandpass filter settings, typically 0.1 to 70 or 100 Hz. However, for specialized applications, the bandpass may include very low frequencies (0.001 Hz) or even direct current (DC), as well as high frequencies up to 3000 to 10,000 Hz (
10).
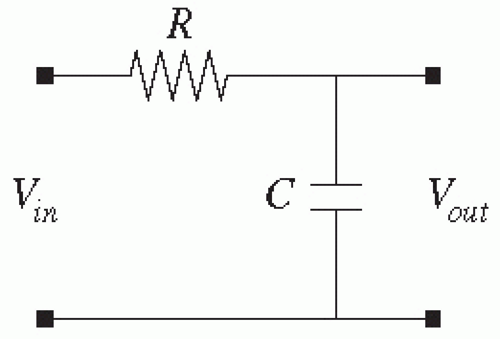
The most important filter in this stage is the anti-aliasing filter as described below. This requires a low-pass filter (passes low-frequency signals but attenuates high-frequency signals). The simplest low-pass analog filter is a resistor (R) and capacitor (C) in series, with the voltage across the capacitor transmitted to the next stage, as diagrammed in
Figure 7.4. This first-order low-pass filter will attenuate high frequencies and has a cutoff frequency (in Hz) of 1/(2π
RC). Commercial antialias filters may be this simple but are often engineered with more components to achieve a faster roll-off in the transition band, thus a “sharp” cutoff. Such analog filters may be designed according to Butterworth or Chebyshev topologies (
11).
Other filters can be inserted prior to digitization. DC is not commonly used in clinical EEG but may be used for research purposes. In most commercial systems, filters are inserted to remove the DC (constant) and very low-frequency components (< 0.5 Hz), which make the record harder to read and require a larger magnitude resolution for the ADC. These have the additional benefit of maximally exploiting the ADC resolution, since the average signal is then zero, and the greatest positive and negative excursions can be designed to fit within the digitizer input range to take full advantage of the magnitude resolution of the ADC. Another filter that may appear before digitization is a power line “notch” filter, which is specifically tuned to eliminate the frequencies matching that of the power line: 60 Hz in the United States, 50 Hz in Europe and other countries.
Analog-to-Digital Conversion
The stage of conversion of the analog signal to digital representation is the most crucial step in the acquisition process. Design of an acquisition system requires that the components be matched and appropriate as a whole, so that the final data are not hindered by poor design of any one element in the path. Because parameters of the digitization impact acquisition components both earlier and later in the signal path, thorough understanding of digitizer capabilities and limitations is crucial. The act of digitization collapses an EEG signal in two independent axes: time and magnitude.
Time
Typically, a time-varying signal is digitized at fixed (constant) discrete intervals. The time intervals are described by sampling rates. Typical sampling rates are on the order of several hundred samples per second (Hz). For 200 Hz, this implies that samples are taken every 5 msec. The time between subsequent samples
is called the
dwell time. The choice of sampling rate impacts how well the obtained data reflect the analog source, with faster sampling roughly giving more fine detail. A reasonable question is: How fast is fast enough? A well-known theorem from signal processing literature provides a quantitative answer to this question. The Nyquist theorem states that the highest frequency distinguishable is one half the sampling frequency. The downside of more rapid sampling is the creation of larger EEG files.
Armed with the Nyquist theorem, one knows the limitations of what signal components in the source are capturable, but the question is naturally raised as to the consequence of signals that are above this Nyquist limit. If these were simply eliminated, the issue would be moot, but sadly high-frequency components above the Nyquist can actually create nefarious artifacts in the digitized output.
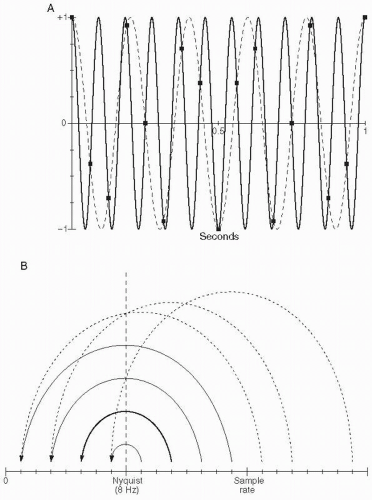
Figure 7.5A shows an example of a pure sinusoid at 11 Hz (the dashed curve) being sampled at 16 samples per second (Nyquist frequency of 8 Hz). The sampled data points can be seen to equivalently match a sinusoid at 5 Hz (solid curve). Indeed, in practice, when displayed on a screen (connected by straight lines), these points would more closely match the 5-Hz sinusoid than the original 11-Hz sinusoid. This phenomenon is known as “aliasing.”
Figure 7.5B shows the pattern by which frequencies above the Nyquist are “folded back” into the range between 0 and the Nyquist frequency, with the example of 11 Hz being folded back to 5 Hz at sampling rate of 16 samples per second emphasized with the bold arc.
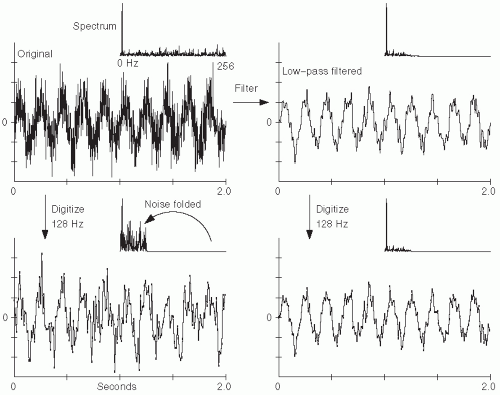
Figure 7.6 shows the deleterious effect of noise above the Nyquist frequency. Fortunately, methods to eliminate this artifact are quite simple. Electrical filters—specially designed circuits composed of elements such as resistors and capacitors—can be used to eliminate undesired frequencies in the analog signal prior to digitization. In particular, ADC systems incorporate an analog low-pass filter prior to digitization, with this filter designed to pass frequencies below the Nyquist frequency and eliminate those above it. Such a low-pass filter in this context is termed an “anti-aliasing” filter.
The anti-alias filter and ADC in
Figure 7.1 are deliberately joined. The analog hardware anti-alias filter must obviously precede the ADC. The anti-alias filter cutoff must be appropriate for the sampling rate of the joined ADC. The filter must adequately attenuate frequencies above the Nyquist, or else high-frequency noise will be aliased into the digitized signal. If the cutoff is too low, then signals with frequencies above this cutoff and below the Nyquist will be unnecessarily attenuated and lost, and expense will have been wasted in using an ADC with higher sampling rate than necessary.
Another point regarding the time axis regards the “frequency resolution,” a factor important for quantitative analysis of EEG. The sampling rate does not impact whether one can distinguish a signal as being one of two closely spaced frequencies, for example, 8.3 Hz versus 8.4 Hz. Frequency resolution is determined by the duration of the acquired signal. In general, the duration required is approximately the inverse of the difference in frequency. This reflects the fact that two sinusoids with some difference in frequency will become out of phase with each other over that time frame. For instance, to reliably distinguish a 0.1 Hz difference in frequency requires a total acquired signal on the order of 1/(0.1 Hz) = 10 seconds. This applies irrespective of the absolute frequency—that is, distinguishing 8.3 from 8.4 Hz or 124.7 from 124.8 Hz both require approximately 10 seconds of acquisition.
Magnitude or Amplitude
Digitization occurs along the magnitude axis as well. In this respect, the effect of digitization is typically discussed in terms of digitization “depth.” Digitizers presume that each successive point is at a known time interval, so this time interval does not need to be stored. Instead, only the value or magnitude at each successive point is stored. Digital equipment is optimized when storing each successive magnitude in a predefined length. To be concrete, the output is a stream of 0’s and 1’s. The number of
binary digits (bits) set aside for each measurement is the same. This storage length can differ between equipment manufacturers. Early digitizers used 8, 10, or 12 bits to store each measurement. Digitizers now routinely use 16 to 24 bits. The number of bits determines explicitly the number of distinguishable magnitudes of the measurements. For example, 8 bits per measurement can store up to 2
8 = 256 different values (0 to 255 unsigned, or -127 to +127 signed two’s complement system).
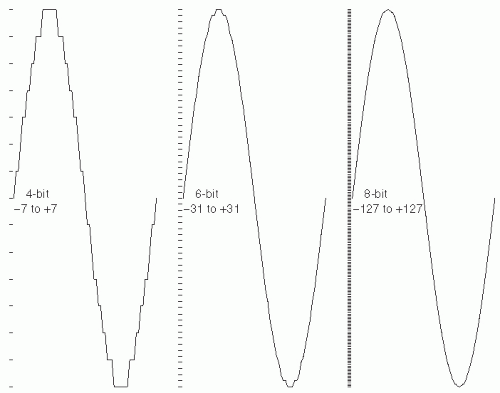
Figure 7.7 illustrates the practical effect of 4-, 6-, and 8-bit digitization depth.
The three parameters—maximum value (or dynamic range), minimum distinguishable difference, and digitization depth— are interconnected, and not independent. Choosing any two specifies the third. With a 12-bit linear digitizer (2
12 = 4096 different levels), in order to be able to represent magnitudes up to ± 1 mV, then the “resolution”—the smallest detectable difference in magnitude—will be (2000 µV/4096) ˜ 0.5 µV. The more bits available, the more accurate each sample. For very low-amplitude signals (e.g., electrocerebral inactivity recordings), ADC resolution less than 0.5 µV is necessary (
12).
ADC Effects on File Size
Both sampling rate and digitization depth have an impact on acquired file lengths. For example, for 32 channels with digitization of 16 bits (2 bytes) per sample and a sampling rate of 400 samples per second, 1 hour of EEG (3600 seconds) will generate (32 × 2 × 400 × 3600) = 92,160,000 bytes = 90,000 kB = 87.89 MB. A full day of EEG with these settings would generate ˜ 2 GB. Increasing the sampling rate to 1000 Hz would increase the file sizes by 2.5, generating ˜ 5 GB per day.
Guidelines
There are specific guidelines for minimum requirements of digital EEG acquisition, specifically touching on ADC. The ACNS guideline (
9) suggests that 11-bit depth (including sign bit) is the minimum, with 12 bits or more being preferred. The minimum amplitude resolution is recommended to be 0.5 µV. Regarding the sampling rate, the guideline has no absolute minimum sampling rate but states that “Higher rates are preferable.” The guideline does suggest that “minimum sampling rate (be) three times the high-frequency (anti-aliasing) filter,” which is equivalent to saying that for a given sampling rate, the anti-aliasing filter cutoff be at 2/3 the Nyquist frequency. Since the ADC rate and anti-aliasing filter are hardware determined, these are under the control of the manufacturer but should be investigated and documented clearly when purchasing decisions are considered.
ADC Hardware
Some of the basic principles of the hardware involved in AD conversion are worth mentioning. First, no AD converter operates instantaneously. The input voltage is typically measured over some finite time (obviously less than the time between samples). The time over which the signal is actually measured is called the
conversion time. Sampling skew, or loss of time axis integrity, can occur if the ADC samples each channel sequentially, since it takes some time to sample one channel and convert the amplitude to a numerical value before it moves on to the next channel’s sample. Sampling skew is most problematic with high-frequency activity and may cause misalignment of high-frequency events such as spikes between the first and the last channels sampled. Most ADCs use an input circuit called a sample-and-hold, employing a capacitor to “hold” the voltage during this conversion time. Then, comparator circuits are applied to bracket the “held” voltage to the desired precision. A second method is to have a series of ADCs, one for each channel, all triggered by a single computer command. Some digital instruments have combinations of these two methods, with ADCs for blocks of four to eight channels using the “sample
and hold” method. Since large ADCs with high throughput are expensive, multiple ADCs may be more cost-efficient.
There are various ADC hardware structures available. These structures include direct conversion or flash, successive approximation, ramp-compare, delta-encoded, pipeline, and sigma-delta. Some of these structures actually involve complex combinations of simpler ADC designs. For example, the sigma-delta converter first oversamples at a very high rate, digitally filters and may use a Flash ADC, then finally downsamples to the desired sampling rate.
The most obvious trade-off of AD converters is between sampling rate and number of channels. The product (rate × channels) is basically a fixed constant, with this constant being proportional to the expense of the digitizer. With current hardware digitizers, it is often possible to sample very fast (2 kHz) on a handful (˜16) of channels, or at slow rates (256 Hz) on several dozen channels (64 to 256). Most commercial EEG machines aim for a compromise with the ability to monitor 32 to 64 channels at sampling rates of 256 to 1024 Hz, and these rates can be user programmed according to the task at hand.
Calibration
Digital calibration differs significantly from analog calibration. The ADC must be calibrated so that it “knows” how large to represent each voltage point. A 50- or 100-µV signal (usually a 30-Hz sine wave) is passed through each amplifier. The ADC takes the amplifier outputs and assigns a 50 µV value to the peak of each channel. All other amplitude values are determined based on this initial calibration. Calibration information is saved with each EEG record. The digital EEG software should contain a voltage cursor that allows the user to determine the voltage of individual waveforms. This cursor is then applied to the known signal from the signal generator to determine whether the system is properly calibrated.
Square wave calibration pulses can sometimes be generated using a digital EEG machine to verify the amplifier and analog filter functioning. The calibration signal should be time-locked to the ADC clock (
13). The square wave calibration should be examined in the machine reference montage with all digital filters off. Biologic calibration may not be possible with digital EEG machines.
Ambulatory and Long-Term EEG Portable Recorders
Systems for acquisition of long-term EEG (hours to days) can have a variety of configurations. The number of hours of EEG that can be stored depends on the number of channels recorded, recorder battery life, and memory storage capacity. Fully portable ambulatory recorders, designed for home EEG recording, are small enclosures containing an amplifier, ADC, batteries, and data storage (usually flash memory card) (
7,
14). Modern systems can store up to 96 hours of continuous 16-32-channel EEG data. When recording is complete, data are downloaded to a computer via a universal serial bus (USB) or proprietary connection for review.
In systems for long-term monitoring (LTM) of epilepsy, amplifiers/ADCs can be connected directly to a computer via USB or other cable, or have TCP/IP connectivity that allows the amplifier to be plugged into a network jack near the patient and to stream data to an acquisition machine anywhere on the network. Advanced LTM recorders may have bluetooth connectivity and can wirelessly stream data to nearby storage (
15) and often have battery backup and local storage to allow patients increased mobility while ensuring uninterrupted data acquisition.
Video and Audio Acquisition
Simultaneous video and audio recording is most commonly done in LTM for epilepsy and in the intensive care unit, to allow correlation of EEG features with behavioral events (
16). Most digital EEG systems today utilize digital cameras and store EEG and video data to computer hard drives, although some older systems with analog video and audio recorded to videotape are still in operation (
17). Early proprietary video capture systems have largely been replaced by standard digital video recording equipment, markedly decreasing the cost and increasing the efficiency of video acquisition and review. Digital video recorded directly to hard drives can be accessed randomly, allowing the reviewer to quickly jump to any portion of the record, rather than having to fast-forward or rewind a series of videotapes. Video equipment can be customized to optimize recording for specific types of monitoring. Camera options include analog versus digital, color versus black-and-white, low light versus infrared, fixed versus pan-tilt, and wide-angle versus remote zoom. Many systems have controls for remote pan-tilt and zoom functions. While early systems required custom cabling for video, modern systems can transmit and control digital video over standard TCP/IP cables.
Video and audio are usually encoded into MPEG, MPEG2, or MPEG4 formats. These are standard formats for digital video, differing in resolution and compression algorithms. All data should include time markers so that EEG, video, and audio can be synchronized precisely (
18). Video should be synchronized to EEG in the millisecond range, or frame-by-frame. Video files contain large amounts of data; 24 hours of video recording can be 8 to 30 GB, depending on resolution (usually 320 × 240 pixels or 640 × 480 pixels), color depth, frame rate, and data compression algorithm. EEG machines for video-EEG recording should be able to store at least 24 hours of continuous video and EEG data. Currently available systems, with hard drive capacities of 200 GB or more, may allow continuous recording for more than a week. Because of the size of video files, the entire video is not usually archived; rather, video segments of interest (seizures and behavioral events) are clipped and archived.


