Chapter 12 EEG Patterns in Stupor and Coma
INDIVIDUAL PARAMETERS OF THE EEG IN COMA: Voltage, Frequency, Reactivity, and the Presence of Normal Sleep Elements
Slow-Wave Voltage
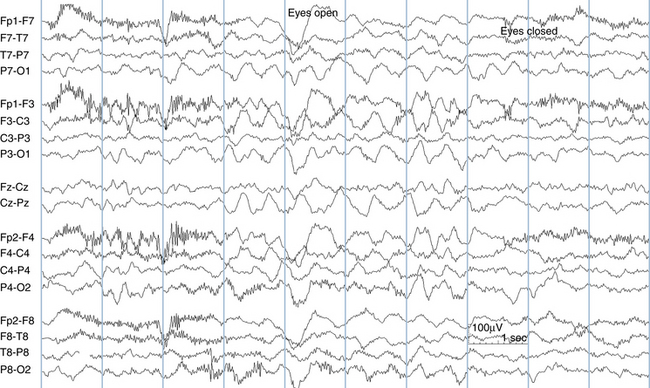
Low-voltage slow waves intermixed with the patient’s baseline background activity may be the first EEG sign of encephalopathic change (see Figure 12-1). An increase in the amount or amplitude of slow-wave activity suggests an increase in the severity of the encephalopathy. With deepening coma, slow-wave amplitude may continue to increase, and very high-voltage slow-wave patterns may be seen. Rather than intermixing with the background activity, the high-voltage slow-wave activity becomes the background. As cerebral function is increasingly affected, however, slow-wave amplitude can only increase to a certain point. With yet more severe cortical dysfunction, cortical rhythms begin to decrease in amplitude. With the most severe neurological processes cortical function becomes depressed and the brain becomes less able to maintain slow-wave voltages, resulting in diminished background activity and voltage. Thus, very low-voltage patterns in coma (voltage depression) are considered more ominous than high-voltage slow-wave patterns. The EEG patterns associated with the most severe degrees of cortical dysfunction show marked suppression of voltages or even electrocerebral inactivity.
Given this described sequence of initially increasing, then decreasing slow-wave amplitude with increasingly severe encephalopathy, a linear relationship between slow-wave amplitude and severity of encephalopathy cannot be assumed. When amplitudes are seen to decrease, this could represent either a trend toward normalization or signal a trend toward voltage depression and increasing dysfunction. In such cases, other EEG features (discussed later) such as frequency and reactivity of the background may help clarify the meaning of the change (see Figures 12-2 and 12-3).
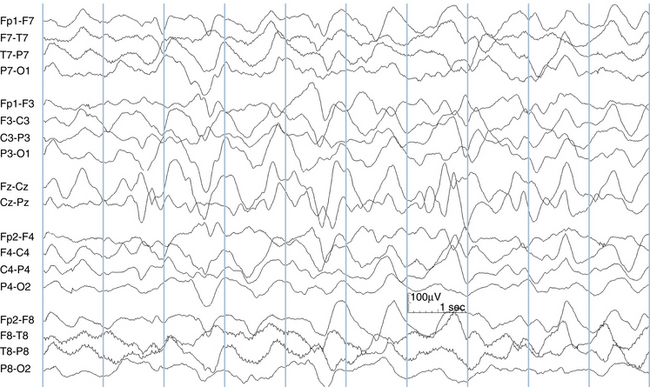
Figure 12-2 A typical slow-wave pattern in coma is shown with high-voltage semirhythmic delta waves. A small amount of intermixed theta activity is also seen, particularly near the vertex and in the occipital areas. Compare to Figure 12-3.
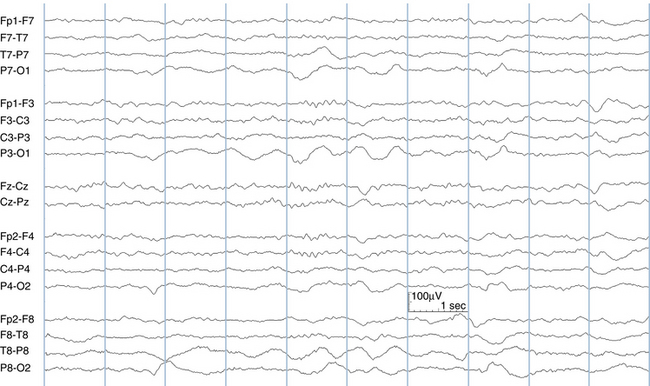
Figure 12-3 The EEG of the same patient seen in Figure 12-2 recorded 48 hours later. As discussed in the text, a decrease in slow-wave voltage in coma can signal either an improvement or a deterioration in the patient’s state. In this tracing, the appearance of faster rhythms accompanies the decrease in amplitudes, clarifying that the drop in voltages represents a trend toward improvement.
The evolution of slow-wave activity during the improvement phase of a neurologic process may be less tightly linked to the patient’s neurologic status. The clearing of slow-wave activity often lags behind the patient’s clinical improvement. In a patient who is recovering from a dramatic encephalopathy, EEG slow-wave activity may still be present even as the patient wakes up, sits up, and begins talking. The persistence of slow-wave activity in the face of an improving neurologic picture is not necessarily a poor neurologic sign as long as there is a trend toward EEG improvement. Likewise, the slow-wave activity that follows a seizure (postictal slowing) may persist well past the point that patients report feeling back to their preseizure baseline. Slow-wave activity may persist after a seizure for hours, commonly a few days, but occasionally for as long as 3 to 4 weeks depending on the type of seizure, the duration of the seizure, and the general neurologic health of the individual.
Presence of Normal Sleep Elements
The presence of identifiable sleep elements in the EEG in coma is felt to be associated with a relatively better neurologic prognosis. The presence of sleep features implies that there is enough cerebral structure intact to generate these elements. Sleep spindles are the most commonly identified sleep feature in this setting. In rare cases, the higher centers that generate sleep elements are intact, but there has been a severe injury at lower levels of the central nervous system, resulting in a poor outcome despite the persistence of sleep elements.
SPECIFIC EEG PATTERNS IN COMA AND NEUROLOGIC PROGNOSIS
Intermittent Rhythmic Delta Activity
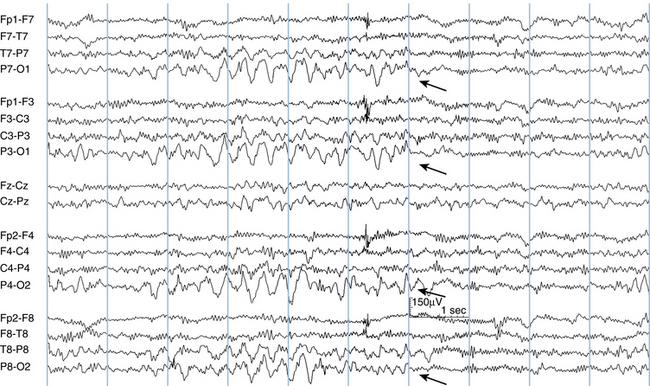
Among EEG findings in encephalopathy, intermittent rhythmic delta activity (IRDA) is considered to lie at the milder end of the spectrum of encephalopathic EEG patterns. IRDA may appear in patients who are awake or who are mildly lethargic or stuporous; IRDA patterns are not associated with deeply comatose states. IRDA tends to occur in the frontal regions in adults (frontal intermittent rhythmic delta activity, or FIRDA) and in the occipital regions in younger children (occipital intermittent rhythmic delta activity, or OIRDA; see Figure 12-4). When encephalopathic states become more severe, IRDA patterns may be replaced by continuous slow-wave patterns. Various types of IRDA are discussed in more detail in Chapter 9, “The Abnormal EEG.”

Stay updated, free articles. Join our Telegram channel

Full access? Get Clinical Tree


