Chapter 13 The Electroencephalogram of the Newborn
The Concept of Postconceptional Age
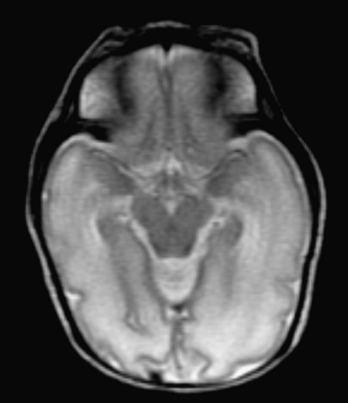
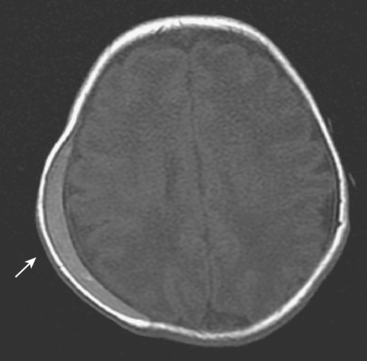
From extreme prematurity to term to the postterm period, the appearance of the neonatal EEG evolves dramatically. In fact, on the basis of the various EEG features described here, an experienced neonatal electroencephalographer should be able to estimate the CA of a newborn to within approximately 2 weeks from the appearance of the EEG record. It has been claimed that when the CA estimate suggested by an otherwise normal neonatal EEG differs from the estimate based on the baby’s physical examination, the EEG-based assessment is more likely to be correct. Figures 13-1 and 13-2 show the striking changes in the appearance of the cortical surface between 31 weeks CA and 40 weeks CA (term). It should come as no surprise that the appearance of the EEG evolves rapidly in premature babies.
Recording Technique
Opinion varies as to whether a full or reduced electrode set should be used for neonatal recordings. Some authors assert that the head is smaller, and therefore it is reasonable to apply fewer electrodes to the smaller head of the newborn. The opposing view holds that if the neonatal brain is conceptualized as a shrunken version of the adult brain, each lobe, gyrus, and cortical circuit is proportionally smaller, and the electric fields of discharges will be correspondingly smaller, requiring the usual (nonreduced) number of electrodes to achieve the same anatomic resolution of electric fields. Our laboratory uses a full complement of electrodes from the 10-20 system in newborns and even in most premature infants; reduced electrode sets are only used for premature infants with the smallest head sizes. Although reduced (double-distance) electrode applications have been shown to record the majority of normal and abnormal EEG activity and may also be better tolerated by the premature infant whose scalp skin is more sensitive, occasionally a highly focal seizure discharge or other highly focal finding may be missed. In addition, difficulties with artifact identification represent a hidden pitfall of the use of sparser electrode arrays. When a deflection is seen in a single channel, denser electrode arrays help determine whether an electric field surrounds the event, increasing or decreasing the chances that it is of cerebral origin as opposed to an electrical artifact.
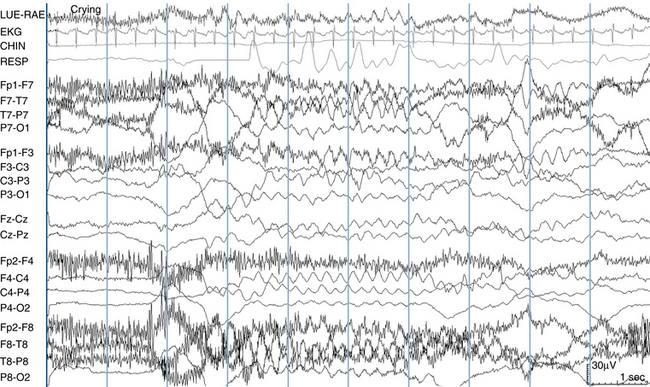
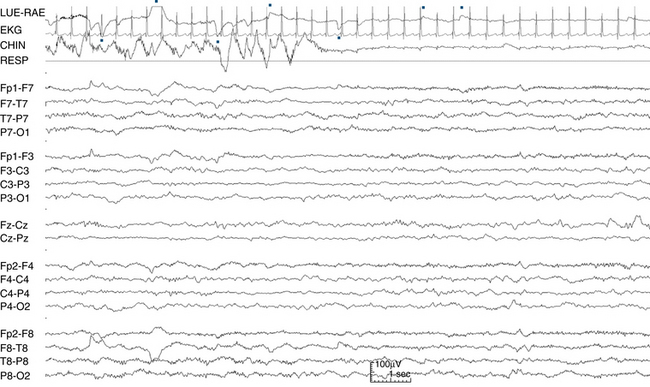
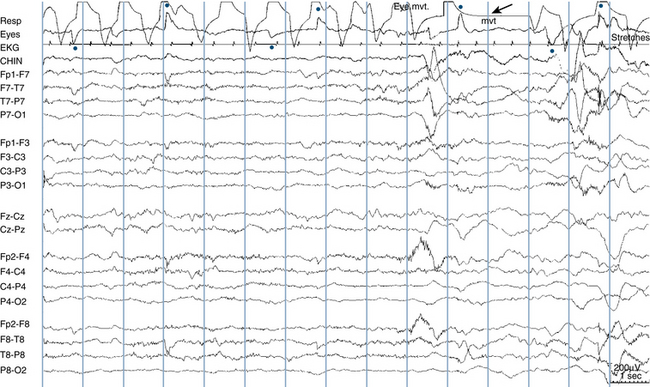
Additional leads are applied to help assess sleep state; to some extent, a neonatal EEG recording resembles a polysomnogram. The added leads may include a nasal thermistor to measure respirations, ocular leads (one placed just above the outer canthus of one eye and the other just below the outer canthus of the other eye), and a submental electrode to monitor chin muscle (EMG) activity. Additional leads may include a strain gauge placed on the abdomen to record respiratory muscle effort and limb leads to document movements. Notations made by the recording technologist on the EEG record should also carefully document the appearance of the baby. Notations such as “appears asleep,” “has hiccups,” “feeding,” “eyes closed,” or “moving” help the reader assess sleep state and evaluate artifacts (see Figure 13-3).
A “QUICK TOUR” OF THE MAJOR NEONATAL EEG SLEEP STAGES
Similar to the “quick tour” of the adult EEG shown in Chapter 2, “Visual Analysis of the EEG,” what follows is a brief overview or “tour” of the main sleep stages of the newborn EEG and also how the technique of neonatal EEG recording differs in a few ways from that of older patients. Because the appearance of the newborn EEG evolves considerably through prematurity and approaching term, no single tracing can demonstrate all of the key findings.
THE FIVE COMMON EEG BACKGROUND PATTERNS SEEN IN NEWBORNS
Normal neonatal EEG background patterns may be either continuous or discontinuous. The first step in classifying a background pattern is assessment of the degree of continuity. A discontinuous pattern is a pattern in which EEG activity seems to alternately “turn on” and “turn off ” for varying amounts of time. In a continuous pattern, there are no recognizable regional pauses in activity (see Figure 13-4). The first three background patterns described here are continuous patterns, and the final two patterns are discontinuous patterns.
The Low-Voltage Irregular Pattern
As the name implies, this pattern consists of continuous low-voltage irregular (LVI), mixed frequencies, with delta and theta activity most prominent. Voltages generally range from 15 to 35 μV. An example is shown in Figure 13-5. As described later, the LVI pattern is seen during both wakefulness and active sleep. The LVI pattern is not expected to be seen during quiet sleep.
The Mixed (M) Pattern
The M pattern is similar to the LVI pattern, but with somewhat higher voltages and a more prominent contribution of slow activity. Continuous mixed frequencies are seen with a mixture of voltages (see Figure 13-6). The M pattern can be seen during any sleep stage. During active sleep, the LVI pattern is most characteristic, but the somewhat higher voltages of the M pattern may also be seen. Similarly, during wakefulness either the LVI or M pattern may be seen. In quiet sleep, the tracé alternant and high-voltage slow (HVS) patterns (described next) are most characteristic, but the M pattern may also be seen. Because it is possible to see the M pattern in any stage of wakefulness or sleep, polysomnographic findings and observed behaviors are key to correct determination of sleep stage.
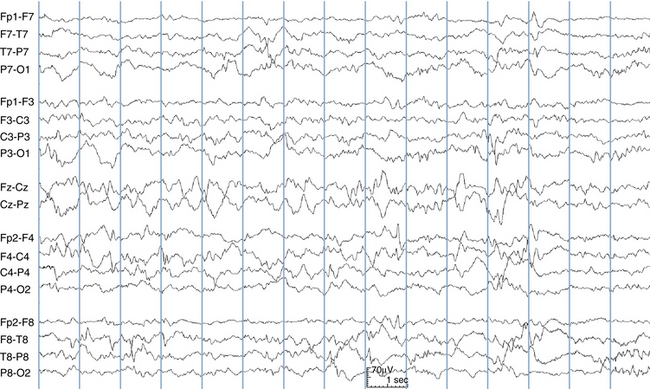
The High-Voltage Slow (HVS) Pattern
The HVS pattern is characteristic of quiet sleep; it only rarely makes an appearance in other sleep stages. Like the LVI and M patterns, the HVS pattern consists of continuous, irregular mixed frequencies, but with higher voltages (50–150 μV). Delta frequencies are more prominent (see Figure 13-7). As described below, discontinuous patterns (tracé discontinu and tracé alternant) are the primary patterns of quiet sleep from the earliest post-conceptional stage to 38 weeks CA. As the baby gets closer to term, the tracé alternant pattern is replaced by the HVS pattern.
The Tracé Discontinu Pattern
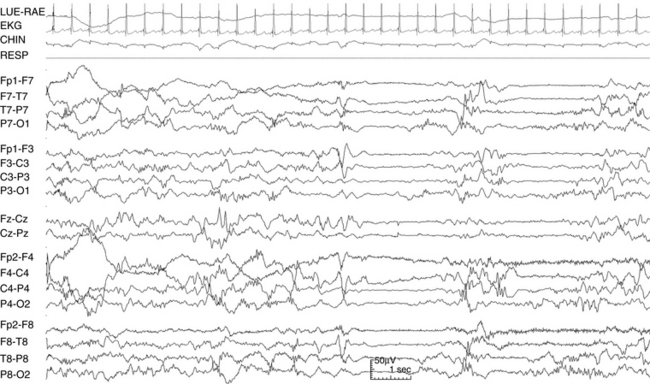
The tracé discontinu pattern (French for “discontinuous tracing”) is a pattern of early prematurity, seen primarily at 30 weeks CA and before. As the name implies, tracé discontinu is a highly discontinuous pattern consisting of very high voltage polymorphic bursts, often containing large numbers of sharp features that may even resemble high voltage polyspikes (see Figure 13-8). The dramatic bursts of tracé discontinu are separated by equally dramatic flat periods that may exceed 10 to 20 seconds in length in the most premature babies (see Figure 13-9). Because of its resemblance to burst-suppression, a well-known pathologic pattern in adult EEG, it took some time for neonatal electroencephalographers to confirm that this was a normal pattern of early prematurity.
The Tracé Alternant Pattern
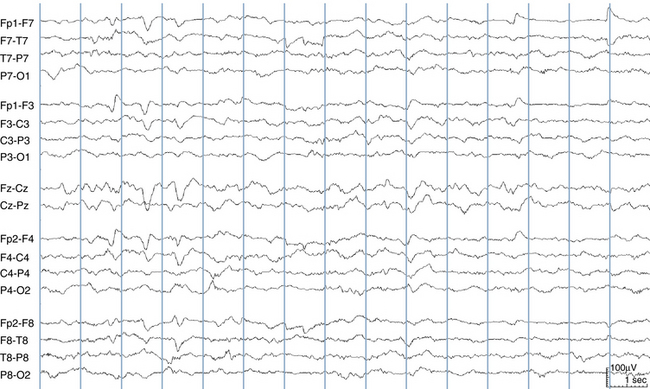
Tracé alternant (French for “alternating tracing”) is the hallmark pattern of quiet sleep in newborns. Tracé alternant is a discontinuous pattern consisting of bursts of mixed activity lasting 2 to 8 seconds with interspersed flatter periods referred to as “interbursts” lasting 4 to 8 seconds (see Figure 13-10). Generally, the bursts and interbursts are of similar duration. The bursts normally contain a variety of activity, including sharp transient activity and also delta brush activity in more premature babies (described later).
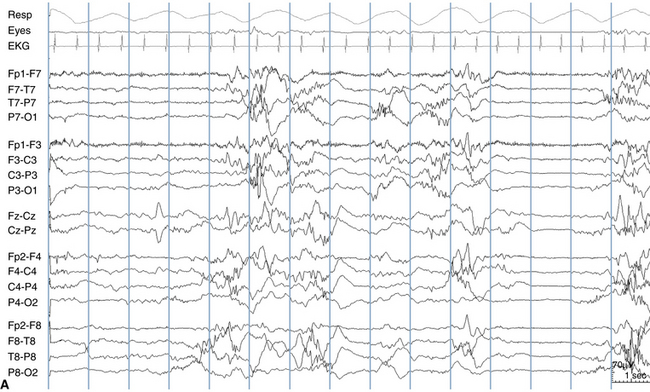
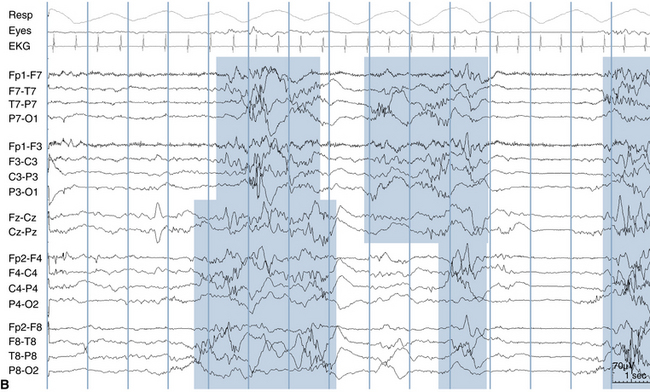
When tracé alternant makes its first appearance after the 30 weeks CA, the quiet interburst periods are longer and flatter than at later CAs. Also, early on, the bursts show the least amount of synchrony between the two hemispheres. As the baby approaches term, the tracé alternant pattern evolves in three ways. First, the bursts are not as widely separated (the interburst intervals are shorter). Second, the periods between the bursts evolve from being relatively flat showing only small amounts of activity to showing increasing amounts of activity, so much so that as term approaches, it may become difficult to tell where a burst ends and a quiet period begins. Finally, the degree of interhemispheric synchrony of the tracé alternant bursts increases toward term, although it may never reach complete synchrony. The pattern shown in Figure 13-11 has, indeed, achieved complete synchrony, although this does not always occur. Even after term the degree of interhemispheric synchrony of tracé alternant is never required to exceed 75%, meaning that in normal babies, a small amount of asynchrony may always be seen.
The differences between tracé alternant and tracé discontinu are both qualitative and quantitative. Quantitative differences include longer interburst intervals, more sharp activity within bursts, and near complete synchrony in tracé discontinu compared with tracé alternant. Qualitatively, in tracé discontinu the interburst intervals are expected to be essentially flat, whereas varying amounts of continuous activity are expected during the interburst intervals of tracé alternant. Between 30 and 34 weeks CA, the evolution of tracé discontinu to tracé alternant during quiet sleep occurs on a continuum.
SLEEP STAGES IN THE NEWBORN NEAR TERM
The three main sleep stages of the newborn near term are active sleep, quiet sleep, and wakefulness. Fundamentally, the concept of “asleep” is defined by the outward appearance of the baby, with clinical sleep considered a state of persistent eye closure and wakefulness of eyes open.
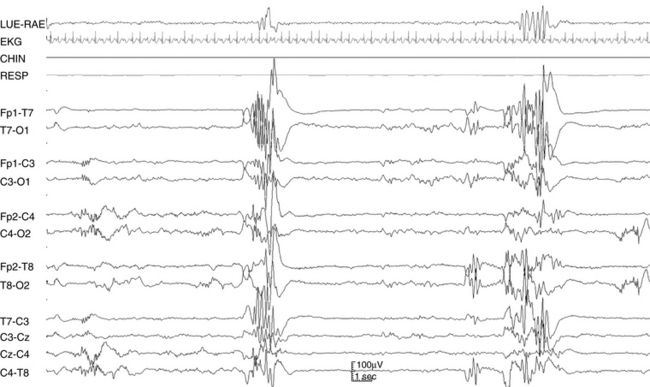
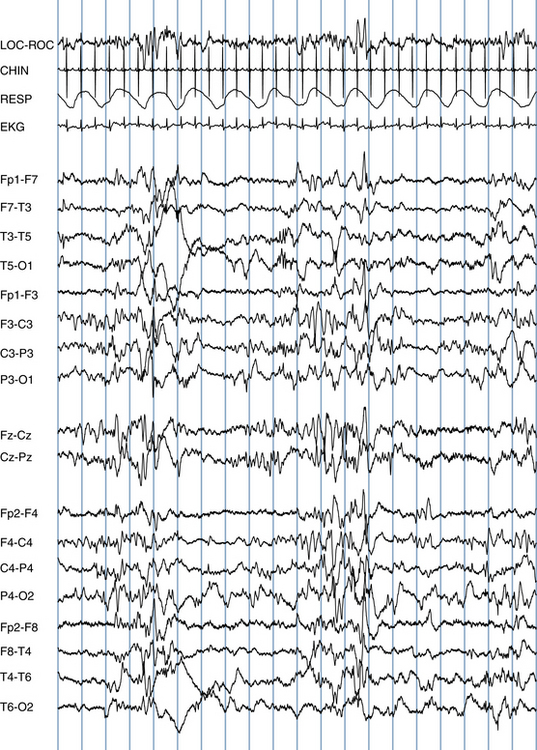
Active Sleep
During active sleep, the baby is seen to squirm, grimace, and have an agitated appearance, yet the eyes are closed. In fact, the movements may lead an observer to think that the baby is on the verge of waking up. Respirations are irregular, and occasional respiratory pauses may be seen. Rapid eye movements of sleep are seen, both on the eye channels of the EEG and by casual observation of the baby’s eyelids; movements of the corneal bulge can be seen through the baby’s eyelids. The chin EMG lead picks up phasic bursts of muscle activity that correspond to facial muscle movements, such as grimacing or other movements. However, in between facial movements, chin EMG activity is low. The EEG shows an LVI pattern that is similar to what is seen during wakefulness (see Figure 13-12). Although most active sleep stages are typically associated with an LVI pattern, the first period of active sleep occurring as a baby falls asleep may show a somewhat higher voltage EEG pattern compared with later active sleep stages, such as an M pattern.
Quiet Sleep
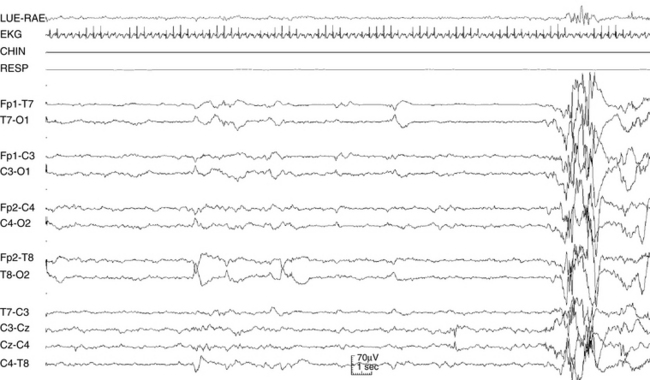
The term quiet sleep derives from the quiet appearance of the baby during this sleep stage. Respirations are deeper and regular, and there are few, if any, limb movements. Outwordly, the baby appears to be in a deep sleep state. REMS are not seen (see Figure 13-9). The chin EMG lead, perhaps surprisingly, shows a high level of tonic muscle activity, with comparatively more EMG activity than is seen between body movements in active sleep. After term, quiet sleep evolves into slow-wave sleep.
The EEG pattern seen during quiet sleep before term is the distinctive tracé alternant pattern, a discontinuous pattern over each hemisphere with periods of high-voltage mixed activity followed by periods of relative quiescence. As the baby approaches term, an HVS pattern gradually replaces the tracé alternant pattern during quiet sleep stages. During this transitional period, which occurs during the weeks just before and after term, some babies manifest an HVS pattern at the beginning of a quiet sleep epoch, which may then transition to a tracé alternant pattern with deepening quiet sleep within the same epoch.

Stay updated, free articles. Join our Telegram channel

Full access? Get Clinical Tree


