Chapter 1 Introduction
Electroencephalography is a relatively young science. One hundred years ago, it was not yet a settled fact that there was electrical activity in the human brain. In 1875, Richard Caton was the first to report an observation of electrical activity from the brains of monkeys and rabbits, though techniques available at the time did not allow him to record these waveforms for posterity. Caton made his observations using a device called Thomson’s mirror galvanometer (Caton, 1877). Oscillations in the mirror affixed to a galvanometer caused movements of a beam of light the mirror reflected on the wall of his laboratory. His report that “Feeble currents of varying direction pass through the multiplier when the electrodes are placed on two points of the external surface, or one electrode on the grey matter, and one on the surface of the skull” is considered the first description of an EEG wave (Caton, 1875). Thereafter, successful recordings were made by Caton and others from the brains of dogs, monkeys, rabbits, and cats, although some still claimed that the recorded waves were related to the pulsations of cerebral blood vessels rather than to brain electrical activity.
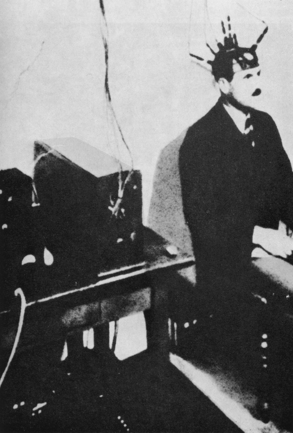
Hans Berger, considered the father of modern Electroencephalography, was the first to record EEG in humans (see Figure 1-1) while working as a professor of psychiatry at the University of Jena in Germany. His previous work included precise measurements of cerebral pulsations in both animals and humans and, later, the measurement of brain temperature variations in animals to determine whether temperature fluctuated in different behavioral states. His first attempts at recording brain waves in 1924 were carried out using a string galvanometer designed to record electrocardiograms (see Figure 1-2). The initial recordings were made in subjects with areas of missing cranial bone, either from palliative trepanations (creation of a window in the skull bone) for relief of increased intracranial pressure from brain tumors or from skull defects related to injuries sustained during the First World War. Because of these patients’ skull defects, the needle electrodes he used could be placed only a few millimeters away from the brain surface.
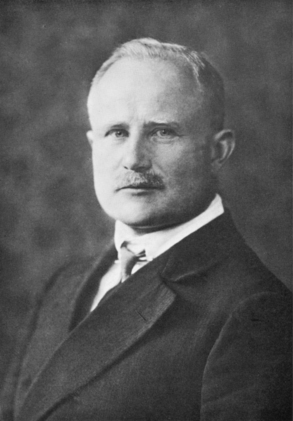
Figure 1-1 Hans Berger at age 52 (1925), one year after he began his work on the human electroencephalogram.
(Courtesy Mrs. Ursula Berger. With permission, from Berger H, Gloor P. On the electroencephalogram of man; the fourteen original reports on the human electroencephalogram [Gloor P, translator and editor], Amsterdam and New York, Elsevier, 1969.)
(With permission, from Berger H, Gloor P. On the electroencephalogram of man; the fourteen original reports on the human electroencephalogram [Gloor P, translator and editor], Amsterdam and New York, Elsevier, 1969.)
In his first report, titled “On the Electroencephalogram of Man” and published in 1929, Berger outlines the path toward his first successful observation of the EEG of man (which he did not, at the time, have the equipment to record). The observation was made in 1924 in a 17-year-old boy who had undergone palliative trepanation over the left cerebral hemisphere for a brain tumor. The first published recorded rhythm, shown in Figure 1-3, was obtained in a 40-year-old man who had had a large bone flap removed to relieve pressure from a brain tumor. The recording was made with needle electrodes placed subcutaneously which, in this patient, represented the epidural space. The patient died from his tumor a few weeks later.
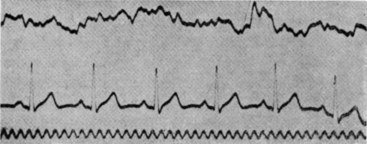
(With permission, from Berger H, Gloor P. On the electroencephalogram of man; the fourteen original reports on the human electroencephalogram [Gloor P, translator and editor], Amsterdam and New York, Elsevier, 1969.)
Related posts:

Stay updated, free articles. Join our Telegram channel

Full access? Get Clinical Tree


