Evidence-based approaches to psychiatry
What is evidence-based medicine?
Implementation of evidence-based medicine
Evaluation of evidence-based medicine
Other applications of evidence-based medicine
Evidence-based medicine in psychiatry
What is evidence-based medicine?
Evidence-based medicine (EBM) is a systematic way of obtaining clinically important information about aetiology, diagnosis, prognosis, and treatment. The evidence-based approach is a process in which the following steps are applied:
• formulation of an answerable clinical question
• identification of the best evidence
• critical appraisal of the evidence for validity and utility
• implementation of the findings
• evaluation of performance.
The principles of EBM can be applied to a variety of medical procedures. For psychiatry, the main use of EBM at present is to assess the value of therapeutic interventions. For this reason, in the following sections the application of EBM will be linked to studies of treatment. Applications to other areas such as diagnosis and prognosis are discussed later.
History of evidence-based approaches
Examples of what we now might call ‘evidence-based approaches’ to the investigation of treatments have a long if sporadic history in medicine. For example, in 1747 a naval surgeon, James Lind, studied six pairs of sailors ‘as similar as I could have them’ who were suffering from scurvy. The sailors who received oranges and lemons recovered within a few weeks, in contrast to those who simply received the same housing and general diet. Lind’s study was not carried out ‘blind’, but in 1784 Benjamin Franklin applied blindfolds to the participants in a mesmerism study, who were therefore unaware whether or not the treatment was being applied. The ‘blinding’ abolished the treatment effect of mesmerism, providing strong evidence that its effects were mediated by suggestion (Devereaux et al., 2002).
The application of modern randomized trial methodology to medicine is attributed to Sir Austin Bradford Hill (1897–1991), who designed the Medical Research Council (MRC) trial of streptomycin treatment of tuberculosis in 1948. Subsequently, Bradford Hill lent his influence to the application of randomized trials in the evaluation of psychiatric treatments, often in the face of vociferous opposition from the profession. The first psychiatric trial to use this methodology was carried out at the Maudsley Hospital in 1955 by David Davies and Michael Shepherd, who demonstrated that, relative to placebo, reserpine had beneficial effects in anxiety and depression. A few years later Ackner and Oldham (1962) used double-blind randomized methods to debunk insulin coma therapy (see p. 508). Subsequently, in 1965, an MRC group reported the first large-scale, multi-centre, randomized controlled trial in psychiatry, in which imipramine and electroconvulsive therapy (ECT) were shown to be therapeutically superior to placebo in the treatment of hospitalized depressed patients (see Tansella, 2002).
More recent developments in evidence-based approaches owe much to Archibald Cochrane (1909–1988), an epidemiologist and author of an influential book, Effectiveness and Efficiency: Random Reflections on Health Services, which was published in 1972. Cochrane emphasized the need, when planning treatment provision, to use evidence from randomized controlled trials because it is more reliable than any other kind. In a frequently cited quotation (Cochrane, 1979), he wrote: ‘It is surely a great criticism of our profession that we have not organized a critical summary, by specialty or subspecialty, adapted periodically, of all relevant randomized controlled trials.’
Cochrane’s views were widely accepted, and two further developments enabled his vision to be realized. First, the availability of electronic databases and computerized searching made it feasible to find all (or nearly all) of the relevant randomized trials when gathering evidence on particular therapeutic questions. Secondly, the statistical techniques of meta-analysis enabled randomized trials to be combined, providing greater power and allowing a reliable quantification of treatment effects. Results from studies using these methodologies are called ‘systematic reviews’ to distinguish them from the more traditional, less reliable ‘narrative reviews’ in which the judgement of the authors plays a major role in deciding what evidence to include and what weight to give it. The Cochrane Collaboration, which was formed in 1993, is now the largest organization in the world engaged in the production and maintenance of systematic reviews (www.cochrane.org). In the UK, the Centre for Reviews and Dissemination, based at the University of York, maintains an up-to-date database of systematic reviews of healthcare interventions (www.york.ac.uk/inst/crd/index.htm).
Why do we need evidence-based medicine?
There are two main related problems in clinical practice which can be helped by the application of EBM:
• the difficulty in keeping up to date with clinical and scientific advances
• the tendency of practitioners to work in idiosyncratic ways that are not justified by the available evidence.
With the burgeoning number of clinical and scientific journals, the most assiduous clinician is unable to keep up to date with all of the relevant articles even in their own field. In fact, it has been estimated that to accomplish this task would require scrutiny of 20 publications a day! Clinicians therefore have to rely on information gathered from other sources, which might include, for example, unsystematic expert reviews, opinions of colleagues, information from pharmaceutical companies, and their own clinical experiences and beliefs. This can lead to wide variations in practice—for example, those described for the use of ECT (see UK ECT Review Group, 2003).
Kinds of evidence
The fundamental assumption of EBM is that some kinds of evidence are better (i.e. more valid and of greater clinical applicability) than others. This view is most easily elaborated for questions about therapy. A commonly used ‘hierarchy’ is shown in Table 6.1.
In this hierarchy, evidence from randomized trials is regarded as more valid than evidence from non-randomized trials, while systematic reviews of randomized trials are seen as the gold standard for answering clinical questions. This assumption has itself yet to be tested systematically, and some argue that large trials with simple clinically relevant end points may be more valid than meta-analyses (see Furukawa, 2004). It is certainly important that clinicians are trained in critical evaluation of systematic reviews before they apply their results to clinical practice (see Geddes, 1999).
Table 6.1 Hierarchy of the quality of research about treatment
Individual treatment studies
Validity
The key criterion for validity in treatment studies is randomization. In addition, clinicians who are entering patients into a therapeutic trial should be unaware of the treatment group to which their patients are being allocated. This is usually referred to as concealment of the randomization list. Without concealed randomization, the validity of a study is questionable and its results may be misleading.
Other important points to consider when assessing the validity of a study include the following:
• Were all of the patients who entered the trial accounted for at its conclusion?
• Were patients analysed in the groups to which they were allocated (so-called ‘intention-to-treat’ analysis)?
• Were patients and clinicians blind to the treatment received (a different question to that of blind allocation)?
• Apart from the experimental treatment, were the groups treated equally?
• Did the randomization process result in the groups being similar at baseline?
Presentation of results
Odds ratios and relative risk
When the outcome of a clinical trial is an event (e.g. admission to hospital), a commonly used measure of effectiveness is the odds ratio. The odds ratio is the odds of an event occurring in the experimental group divided by the odds of it occurring in the control group. The odds ratio is given with 95% confidence intervals (which indicate the range of values within which we have a 95% certainty that the true value falls). The narrower the confidence intervals are, the greater is the precision of the study.
If the odds ratio of an event such as admission to hospital is 1.0, this means the rates of readmission do not differ between the control and experimental groups. Therefore if the confidence interval of the odds ratio of an individual study includes the value of 1.0, the study has failed to show that the experimental and control treatments differ from each other.
Relative risk also measures the relative likelihood of an event occurring in two distinct groups. It is regarded as a more intuitive measure of effectiveness than the odds ratio. For example, if action A carries a risk of 99.9% and action B carries a risk of 99.0%, the relative risk is just over 1, which seems intuitively correct for two such similar outcomes. However, the calculated odds ratio is almost 10! With relatively infrequent events, the odds ratio and relative risk become more similar. Measures of relative risk cannot be used in case–control designs, and are hard to adjust by covariance for confounding variables.
Effect sizes
In many studies the outcome measure of interest is a continuous variable, such as a mean score on the Hamilton Rating Scale for Depression. It is possible to use the original measure in the meta-analysis, although more often an estimate of effect size is made because it is more statistically robust.
Effect sizes are obtained by dividing the difference in effect between the experimental group and the control group by the standard deviation of their difference. The clinical interpretation of the effect size is discussed below.
Clinical utility of interventions
Risk reduction and number needed to treat
An important part of EBM involves using the results of randomized trials of groups of patients to derive the impact of an intervention at the level of the individual patient. A useful concept when assessing the value of a treatment is that of absolute risk reduction. This compares the proportion of patients receiving the experimental treatment who experienced a clinically significant adverse outcome (e.g. clinical relapse) with the rate in patients receiving the comparison treatment. These rates are known as the experimental event rate (EER) and control event rate (CER), respectively, and are calculated as percentages. The difference between these two outcome rates is the absolute risk reduction (ARR).
The ARR can be converted into a more clinically useful number, known as the number needed to treat (NNT). The NNT is the reciprocal of the ARR, and it tells us how many patients would need to be treated in order to experience one more positive outcome event compared with a comparator treatment (or no treatment) (see Box 6.1). Like odds ratios, NNTs are usually given with 95% confidence intervals.
Example
Paykel et al. (1999) randomized 158 patients with residual depressive symptoms following an episode of major depression to either clinical management or clinical management with 18 sessions of cognitive–behaviour therapy (CBT). Over the following 68 weeks the relapse rate in the CBT-treated group (29%) was significantly less than that in the clinical management group (47%; P = 0.02).
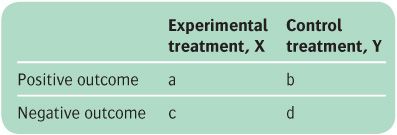
Control event rate (CER) = b/(b + d)
Experimental event rate (EER) = a/(a + c)
Absolute risk reduction (ARR)
The difference in the proportions with a positive outcome on treatments X and Y = (CER– EER)
Relative risk = EER/CER
Odds ratio (OR)
The ratio of the odds of a positive outcome on treatments X and Y = (a/c)/(b/d) = ad/bc
Number needed to treat (NNT)– the number of patients that need to be treated with treatment X in order to obtain one more positive outcome than would be expected on treatment Y (= 1/AAR)
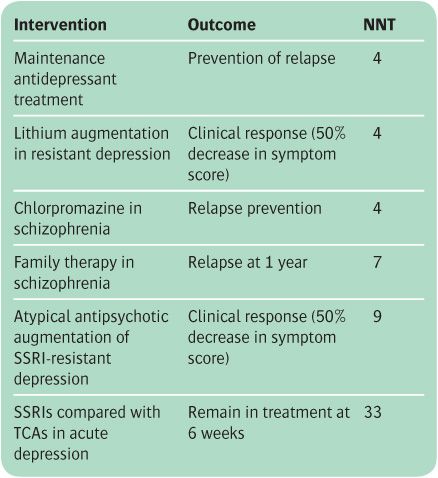
The ARR in relapse with CBT is 47 − 29 = 18%. The NNT is the reciprocal of this number, which is approximately 6 (usually the NNT is rounded up to the next highest integer). This means that six patients with residual depressive symptoms have to be treated with CBT in order to avoid one relapse. In general, an NNT of less than 10 denotes a useful treatment effect. However, interpretation of the NNT will also depend on the nature of the treatment, together with the extent of its therapeutic and adverse effects. The NNTs for some common psychiatric treatments are shown in Table 6.2.
If the outcome measure of an intervention is a beneficial event (e.g. recovery) rather than avoidance of an adverse event, the effect of the intervention is calculated as the absolute benefit increase (ABI) in the same way as the ARR (see above), with the NNT being similarly computed. A concept related to NNT is the number needed to harm (NNH), which describes the adverse risks of particular therapies (e.g. extrapyramidal symptoms with antipsychotic drugs).
Table 6.2 Examples of number needed to treat (NNT) for interventions in psychiatry
Computing the NNT from odds ratios
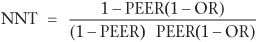
If a study or meta-analysis provides an odds ratio, it is possible to compute an NNT that may be more relevant to the clinical circumstances of the practitioner and their patient. For example, in the example given above (Paykel et al., 1999), relapses occurred in 35 of 78 subjects in the clinical management group, compared with 23 of 80 subjects in the CBT group. This gives an odds ratio in the risk of relapse between the two treatments of 0.49. To obtain an NNT from the odds ratio it is necessary to know, or to estimate, the expected relapse rate in the control group. This is known as the patient expected event rate (PEER). The PEER is combined with the odds ratio (OR) in the following formula:
If we take the relapse rate in the patients who were in the clinical management group in the above study (45%), we have:
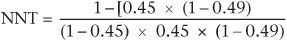
This gives an NNT of about 6, which we also derived from the other method of calculation involving the ARR. However, if from a local audit we know that in our own service the relapse rate of patients with residual depressive symptoms is about 20% (rather than the figure of 45% reported by Paykel et al.), using the above formula the NNT becomes about 11. This means in our own service we would need to treat 11 patients with CBT in order to obtain one less relapse. Thus odds ratios can be used to adjust NNTs to local clinical conditions, thereby aiding decisions about the applicability of interventions.
Clinical relevance of effect size
Like the odds ratio, the effect size is not easy to interpret clinically. A useful approach is to use the effect size to estimate the degree of overlap between the control and experimental populations. In this way we obtain the proportion of control group scores that are lower than those in the experimental group. (A negative effect size simply means that scores in the control group are higher than those in the experimental group.)
For example, in a review of the effects of benzodiazepines and zolpidem on total sleep time relative to placebo, Nowell et al. (1997) found an overall effect size of 0.71. From normal distribution tables this means that 76% of controls had less total sleep time than the average sleep time in the hypnotic-treated patients. Effect sizes have been classified in the following way:
• 0.2 = small
• 0.5 = moderate
• ≥0.8 = large.
Related posts:

Stay updated, free articles. Join our Telegram channel

Full access? Get Clinical Tree


