Experimental Techniques of Spinal Imaging
Eric D. Schwartz
Introduction
Epidemiology and Current Clinical Treatments
Every year, approximately 12,000 people in the United States become victims of spinal cord injury, and there are currently almost 250,000 who are paraplegic or quadriplegic (1, 2). Because this disease affects the young more than the old and because better postinjury care has resulted in increased survival, the impact on society is huge and annual medical costs in the United States are close to $9 billion (2). Treatment options for these spinally injured patients are limited. The usefulness of immediate application of methylprednisolone, the only treatment shown to be effective in ameliorating spinal cord injury
(3, 4), has been aggressively questioned over the past few years (5). According to the Canadian Neurosurgical Society and the National Association of Emergency Medical Services Physicians (NAEMSP), treatment with methylprednisolone is no longer the “standard of care” (6, 7).
(3, 4), has been aggressively questioned over the past few years (5). According to the Canadian Neurosurgical Society and the National Association of Emergency Medical Services Physicians (NAEMSP), treatment with methylprednisolone is no longer the “standard of care” (6, 7).
Despite this setback in the clinical arena, basic science research has identified many promising treatment options, including both transplantation and pharmacologic therapy (8, 9, 10, 11, 12, 13 and 14); however, as noted by Naomi Kleitman (15) of the National Institute of Neurological Disorders and Stroke, “the promise (of these basic science advances) has not been fulfilled by improving clinical treatment.” The question that arises is what is needed to translate these advances from the lab to the bedside?
One answer is that improved outcome measures are needed for translating basic science advances (16). The evaluation of treatment efficacy in clinical trials faces obstacles that slow the pace of research. The improvement of patient care has reduced the mortality and morbidity of spinally injured patients, and the life expectancy of nonventilator dependent spinal cord injured patients is close to normal (2, 17); thus histologic data may not be forthcoming. Unlike experimental models, behavioral improvement in humans following therapy may take years (18) and is difficult to assess (19), thus slowing the pace of evaluating treatment efficacy. A noninvasive imaging modality that could objectively identify histologic changes to axons would therefore be an important component to a battery of tests designed to evaluate treatment efficacy.
Limitations of Conventional Magnetic Resonance Imaging in the Evaluation of Spinal Cord Injury
Conventional magnetic resonance imaging (MRI) techniques for evaluation of acute spinal cord injury generally include the following pulse sequences: T1-weighted images, T2-weighted images, T2* susceptibility images, and short tau inversion recovery (STIR) images. For these pulse sequences, contrast is based on intrinsic properties of the tissue, referred to as T1 and T2 values. Although these intrinsic properties of tissue may be altered with injury, the effect on contrast differs among the pulse sequences. Increases in water content, such as that seen with spinal cord edema, usually result in longer T1 and longer T2 values. The overall effect is lower signal on T1-weighted images and higher signal on T2-weighted images. Although T1-weighted images provide good evaluation of vertebral alignment and help assess spinal cord size, this pulse sequence is not ideal for evaluation of spinal cord parenchymal injury. The T2-weighted image is usually more sensitive than the T1 weighted images for detecting alterations caused by trauma. The high intensity of cerebrospinal fluid on a T2-weighted image also helps to evaluate for effacement of surrounding cerebrospinal fluid and spinal cord compression. T2* images are more sensitive for identifying spinal cord hemorrhage, with areas of hemorrhage appearing dark. STIR images are usually T2-weighted with suppression of signal from fat, allowing visualization of edema/injury within the vertebral bodies, soft tissues, and ligaments that surround the spinal canal. Contrast on T1- and T2-weighted images varies with the strength of the main magnetic field, but successful imaging strategies have been implemented across the range of field strengths used for clinical and experimental studies.
These conventional MRI pulse sequences can indicate the presence of hemorrhage, length of contusion-induced edema, level of injury, spinal cord swelling, and cord compression. This information has proven valuable in early diagnosis and treatment planning. These techniques are limited, however, in that their contrast primarily reflects changes in water content or presence of hemorrhage. This limitation is demonstrated in experimental research that attempts to correlate edema and hemorrhage with neurologic and histologic severity. One study using a rat spinal cord contusion model showed that the degree of neurologic recovery following contusion injury did not correlate either with volumetric lesion size as evaluated by T2-weighted abnormal signal (edema) or T2 hypointensity (hemorrhage) (20). Another study with the rat contusion model demonstrated that the water content and average T2 may not change significantly in areas of acute injury (21); therefore, conventional MRI techniques may underestimate the degree of injury. Additionally, some areas of hemorrhage may be too small to be visible on T2* images.
Although MRI is the best imaging modality for the evaluation of spinal cord parenchyma at this time, conventional MRI techniques do not appear to differentiate edema from axonal injury are therefore limited to providing anatomic information about the spinal cord parenchyma, including the degree of spinal cord compression, amount of hemorrhage, and injury localization. The water content or hemorrhagic content does not necessarily reflect the status of the white matter tracts, and, consequently, the functional status of the spinal cord is not well assessed. This reliance on water content and blood products explains why the use of MRI for prognostication of future neurologic status following human spinal cord injury has been minimally or no more successful than neurologic examination alone. Although there has been limited success in correlating these conventional MRI findings with neurologic outcome (22, 23, 24, 25, 26 and 27), a review of the prognostic ability of MRI in the National Acute Spinal Cord Injury Study 3 (NASCIS) noted that “the present analyses find that MR imaging does not add much to the diagnosis of neurologic function at the time of injury when compared with assessment by more traditional measures of neurologic function” (28). Follow-up imaging of chronic spinal cord injury has also been limited to assessment of spinal cord morphology, and the development of
posttraumatic syringomyelia and myelomalacia (29, 30, 31, 32, 33, and 34). Another methodology is needed for identifying appropriate patient populations for treatment delivery; optimal therapy may need to be delivered in the first few hours or days, yet neurologic examination may require a week’s delay before providing an accurate prognosis.
posttraumatic syringomyelia and myelomalacia (29, 30, 31, 32, 33, and 34). Another methodology is needed for identifying appropriate patient populations for treatment delivery; optimal therapy may need to be delivered in the first few hours or days, yet neurologic examination may require a week’s delay before providing an accurate prognosis.
Conventional MRI, therefore, appears restricted to assessing macroscopic changes in the injured spinal cord and does not adequately address integrity of the white matter. This limitation may explain the limited success of MRI as a prognostic tool because it is the degree and location of injured and spared white matter that primarily determine subsequent function. More advanced MRI techniques, however, show great promise in providing structural information concerning the integrity of axons. In this chapter we will review the MRI techniques that have the most potential for impacting the diagnosis and treatment of spinal cord injury, with the greatest emphasis on diffusion-weighted and diffusion-tensor MRI (DWI and DTI). Other promising techniques will be introduced as well, including MR spectroscopy (MRS), magnetization transfer imaging (MTI), blood oxygen level dependent MRI (BOLD), and newer techniques for tracking cells following neurotransplantation.
Diffusion-based Magnetic Resonance Imaging Techniques
Diffusion-weighted Magnetic Resonance Imaging: Background and Principles
DWI is designed to measure the movement rate of water molecules that results from random (Brownian) motion. Most diffusion-based studies use a pulse sequence derived from the work of Stejskal and Tanner (35). A paired set of diffusion sensitizing gradients is used to encode signal intensity on the resulting images. In this scheme, stationary water molecules retain high-signal and water molecules that move between the first and second gradient pulses and lose signal as a function of the magnitude of displacement. The obtained images are referred to as diffusion weighted because the dominant contrast mechanism is differences in local water diffusion. The degree of diffusion weighting is described by the b-value, which is determined by
b = γ2G2δ2(δD-δ/3),
with γ= gyromagnetic ratio, G = magnitude of diffusion sensitizing gradients, δ = duration of individual diffusion sensitizing lobe, and δ = time period between leading edges of the diffusion sensitizing lobes. The gyromagnetic ratio is a constant for protons in a particular magnetic field strength; all of the other factors are under operator control, subject to technical limitations.
In addition to one image with b = 0, which is essentially a T2-weighted image, at least one images with b >0 is required to quantify water diffusion. Using the signal intensities in the DWI images, we can quantify water diffusion in each voxel with the monoexponential equation:
S/So = exp(-bD),
where S = signal without diffusion sensitizing gradients (b = 0), D = measured diffusion coefficient, usually referred to as the apparent diffusion coefficient (ADC), and b = b-value. Each measured voxel in an ADC map image is therefore an average measurement of water diffusion.
A strength of this technique is that diffusion-sensitizing gradients can be oriented to measure water diffusion in a specific direction. The measured diffusion coefficient D is referred to as an “apparent” diffusion coefficient. The rate of water diffusion is “apparent” because we are not measuring the actual speed of water molecules, but how far the molecules are permitted to move in a specified period of time, taking into account biologic diffusion barriers. DWI can probe the structure of biologic materials and identify these barriers to water diffusion. By measuring water diffusion rates in multiple directions, we can classify water diffusion in biologic tissues as isotropic (water diffuses at equal rates in all directions) or anisotropic (water diffuses preferentially in one particular direction) (Fig. 13-1). DWI has shown that intact white matter tracts of the central nervous system display anisotropy (36, 37 and 38). This anisotropic water diffusion has been hypothesized to be due to the axon membrane and myelin sheaths acting as diffusion barriers perpendicular, or transverse, to the axons, whereas few of these barriers are encountered parallel, or longitudinal, to the axons (39, 40, 41 and 42).
Diffusion-tensor Magnetic Resonance Imaging: Background and Principles
Water diffusion in an anisotropic sample is best described as a tensor, as opposed to a scalar quantity, due to barriers resulting in variations of water diffusion coefficients depending on which direction the diffusivity is measured. Diffusion-tensor MRI (DTI) is a technique that allows us to measure principal diffusivities in a sample without worrying about sample orientations. Diffusion tensors are typically measured by obtaining ADC values in multiple different directions (generally six or greater). From the DTI data, multiple measurements can be obtained:
Three diffusivity measures can be derived from the DTI data, the first of which describes the largest direction of diffusivity, and the second and third of which are orthogonal to the first measure, thus delineating a three-dimensional ellipsoid (43). The largest diffusion value is the first eigenvalue (λ1), and the
second and third diffusion values are the second (λ2) and third (λ3) eigenvalues, respectively (Fig. 13-2). This rotationally invariant measure of water diffusion and orientation can be determined on a voxel-by-voxel basis.
Quantitative measures of diffusional anisotropy can then be calculated based on formulas that incorporate the tensor elements (44). Two common measures include:
Fractional anisotropy (FA) is a dimensionless, but quantitative, measure that will acquire a value of 0 when tissue is purely isotropic and will tend toward 1 for highly anisotropic, cylindrically symmetric, diffusion (45).
The lattice index (LI) anisotropy also provides a robust, dimensionless measure of diffusion tensor anisotropy (with values tending toward 0 for isotropic diffusion); however, this measure also incorporates local averaging to reduce effects of noise (46).
Trace diffusion is an overall measure of diffusion within the voxel (average diffusivity of the tissue) and can be defined by the equation (λ1 + λ2 + λ3)/3.
The directionality of λ1 can also be determined, which has been shown in normal white matter to be parallel to the long axis of axons, thus indicating the direction of white matter fiber tracts. There are numerous methods of visualizing this directionality. A color map, similar to proposed schemes (47, 48 and 49), can be created in which the x, y, and z components of the principal direction of diffusion are assigned respectively to the red, green, and blue pixel channel values. This color map may be displayed as a color sphere in order to indicate direction of principal diffusivity, and the intensity of the voxel can be weighted by the degree of anisotropy.
 FIGURE 13-1. Schematic representation of anisotropic water diffusion in a cylinder, in which diffusion is preferential in a particular direction, which happens to be the Z-direction in this example (A). Axons in the spinal cord can be conceived as packed cylinders with preferential water diffusion longitudinal (parallel) to their long axis. When no preferential direction of water diffusion exists, this property is referred to as isotropic water diffusion. Schematic representation of isotropic water diffusion in a sphere, in which water diffusion is equal in all measured X-, Y- and Z-directions (B). (Adapted from Schwartz ED, Hackney DB. Diffusion weighted MRI and the evaluation of spinal cord axonal integrity following injury and treatment. Exp Neurol. 2003;184(2):570–589, with permission.) |
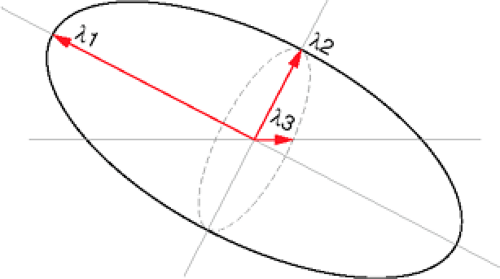 FIGURE 13-2. Schematic of the ellipsoid defined by diffusion tensor imaging. The eigenvalues are the diffusion values in the three orthogonal directions that define the ellipsoid, with the first eigenvalue (λ1) representing the largest diffusion value (major axis), and the second (λ2) and third (λ3) eigenvalues representing the minor axes. The third eigenvalue (λ3) represents the smallest diffusion value. In white matter, λ1 is equivalent to “longitudinal diffusion” with λ2 and λ3 equivalent to “transverse diffusion.” |
Using either DWI or DTI techniques, the preferred direction of water diffusion in spinal cord white matter tracts has been shown in numerous ex vivo (21, 50, 51, 52, 53, 54, 55, 56, and 57) and in vivo (58, 59, 60, 61, 62, 63, 64, 65 and 66) experimental studies, as well as in vivo human studies (67, 68, 69, 70, 71, 72 and 73), to be parallel, or longitudinal, to the long axis of the axons (Fig. 13-3).
 FIGURE 13-3. Normal cervical spinal cord section stained with Nissl-Myelin staining (A) (black bar = 1 mm) with corresponding T2 weighted axial image (B), and color-coded diffusion tensor image (C) of ex vivo normal rat cervical spinal cord. A color sphere is provided adjacent to the diffusion tensor image in order to indicate the preferential direction of water diffusion seen in the spinal cord. The diffusion tensor image shows white matter to be blue, indicating, as shown with the color sphere, preferential water diffusion to be perpendicular to the plane of the image, in the expected rostral-caudal direction. Another method of presenting anisotropic and directional information is to create a three-dimensional ellipsoid for each pixel in the DTI image. The central portion of the spinal cord with representative ellipsoids for each pixel (D) shows how the ellipsoids in the gray matter are more rounded and larger than those in the white matter, indicating less anisotropy and increased trace diffusion. An enlarged image of the ventral white matter (E) demonstrates the expected cigar-shape ellipsoids for white matter, indicating strong rostral-caudal anisotropy. (Adapted and reproduced from Schwartz ED, et al. Spinal cord diffusion tensor imaging and fiber tracking can identify white matter tract disruption and glial scar orientation following lateral funiculotomy. J Neurotrauma. December 2005;22(12):1388–1398, with permission.) |
Diffusion-weighted and Diffusion-tensor Magnetic Resonance Imaging of the Ex Vivo Spinal Cord
Regarding DWI and DTI, the spinal cord has been less studied than the brain. One reason is the small size of the spinal cord, which therefore requires higher field strength magnets and longer imaging times to achieve images comparable to brain research. In vivo imaging of the spinal cord is also hindered by technical factors, including motion artifacts arising from respiratory and cardiac activity, as well as cerebral spinal fluid (CSF) pulsations resulting in movement of the spinal cord itself. Experimental animal studies, however, have permitted the imaging of ex vivo spinal cord specimens, which avoids these problems.
As with white matter tracts in the brain, anisotropy in the spinal cord appears to be due to diffusion barriers encountered as water moves in the direction perpendicular to the fibers. These barriers are believed to be cellular membranes and myelin sheaths, which result in a low tADC (transverse ADC). As water diffuses longitudinally in the spinal cord, these diffusion barriers are not encountered, and lADC (longitudinal ADC) is therefore large in comparison to tADC.
Ex vivo studies of the spinal cord have confirmed its anisotropic properties. Pattany et al. (50) studied both fresh and fixed cat spinal cords and demonstrated anisotropic diffusion in the spinal cord white matter tracts with tADC values ranging from approximately 0.1 – 0.3 × 10⁻³ mm2/s and lADC values ranging from approximately 0.6 – 1.0 × 10⁻³ mm2/s. Measurements of white matter in formaldehyde fixed rat spinal cords from two different studies showed similar ADC values (21, 53). These studies of fixed rat and cat spinal cord demonstrated that the lADC was significantly greater than the tADC, as would be expected in white matter. In these three studies, the tADC was measured in only one direction, which may be either anterior-posterior or left-right.
Other ex vivo studies have utilized DTI, which again confirm the anisotropic properties of the spinal cord. Additionally, the longitudinal orientation of the axons has also been shown to result in cylindrical symmetry (74), so that the anterior-posterior tADC is equivalent to the left-right tADC if the spinal cord is properly aligned without curvature. Therefore, a full diffusion tensor may not be necessary in the spinal cord, as the principal diffusivities derived from the tensor can be derived from one lADC and one tADC measurement. Inglis et al. (59) compared diffusion tensor imaging with ADC mapping, however, and found that ADC measurements tended to underestimate high diffusivities and overestimate low diffusivities in white matter, thereby underestimating the degree of anisotropy. These findings would suggest that obtaining ADC values without tensors might not be sufficient to evaluate principal diffusivities in the spinal cord. Gulani et al. (74) demonstrated cylindrical symmetry by obtaining four of the six elements of the diffusion tensor with resulting principal diffusivities similar to those obtained with all six tensor elements. They also noted that differences in anterior-posterior and left-right diffusion values with measured diffusion coefficients were within experimental error. Interestingly, the measured ADC values in the left-right, anterior-posterior, and longitudinal directions were within experimental error of principal diffusivities obtained with tensor imaging. This finding is different from that reported by Inglis et al. (59), and suggests that if spinal cords are carefully oriented in the magnetic field frame of reference, ADC values will provide an accurate assessment of principal diffusivities of the spinal cord white matter. Recent reports, however, indicate that obtaining a full diffusion tensor may provide more information concerning white matter fiber architecture. The directionality of the second eigenvalue (second eigenvector) appears to correlate with collateral nerve fibers (75). High-resolution DTI has also shown that white matter fibers running transversely toward the exiting nerve roots can be identified (76) (Fig. 13-4).
All these studies have demonstrated anisotropic diffusion within the white matter. The situation in gray matter is not as clear. In general, the tADC values and lADC matters of gray matter are similar, with tADC values greater than white matter, and lADC values less than white matter. Two studies of fixed rat spinal cord have shown slight anisotropy, with a larger lADC than tADC (21, 77), while fixed cat spinal cords showed a slightly elevated tADC as compared to lADC (50). The direction of the tADC measurement (left-right or anterior-posterior) may be important, as high-resolution diffusion tensor imaging showed variability within the gray matter that appeared to correspond to anatomic fiber orientation (59, 76). More rapid longitudinal diffusion was seen in the substantia gelatinosa where small fibers from the tract of Lissauer are ascending and descending, whereas there was left-right anisotropy in the gray commissure where these axons cross (Fig. 13-4).
The confirmation of anisotropy within spinal cord white matter tracts helps substantiate the hypotheses that tADC measures water diffusion in the presence of barriers, such as the cell membrane and myelin sheath, and that lADC measures water diffusion without significant restrictive effects from cell membranes. These theories received further support by Gulani et al. (56) in which diffusion tensor measurements were obtained from fixed ex vivo specimens of myelin deficient rats. Anisotropic diffusion was demonstrated in these myelin deficient rats, but there was a greater degree of anisotropy in their normal controls. Analysis of principal diffusivities derived from the diffusion tensor showed that there was a greater proportional increase of transverse diffusivity compared to
longitudinal diffusivity in myelin deficient rats than in normal controls. Although myelination is not solely responsible for diffusion anisotropy, it nevertheless does play an important role in generating diffusion anisotropy in white matter. The fact that longitudinal diffusivity also increased suggests that myelin may restrict diffusion in any direction. Therefore, as expected, the overall trace diffusion (average of three principal diffusivities) was greater in myelin deficient rats, suggesting that the lack of myelination resulted in an overall decrease in diffusion barriers. Gray matter was also studied and there were only minimal changes between the myelin deficient and normal rats, likely due to the relatively small number of myelinated axon fibers present in normal gray matter.
longitudinal diffusivity in myelin deficient rats than in normal controls. Although myelination is not solely responsible for diffusion anisotropy, it nevertheless does play an important role in generating diffusion anisotropy in white matter. The fact that longitudinal diffusivity also increased suggests that myelin may restrict diffusion in any direction. Therefore, as expected, the overall trace diffusion (average of three principal diffusivities) was greater in myelin deficient rats, suggesting that the lack of myelination resulted in an overall decrease in diffusion barriers. Gray matter was also studied and there were only minimal changes between the myelin deficient and normal rats, likely due to the relatively small number of myelinated axon fibers present in normal gray matter.
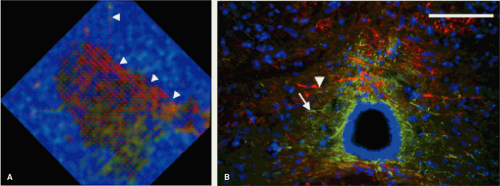 FIGURE 13-4. An enlarged view of the central and lateral gray matter of the normal spinal cord (A) from Figure 13-3, with lines for each pixel indicating the direction of primary (λ1) diffusivity. The central gray matter surrounding the central canal, which is black, appearing to be a combination of red and green; this finding indicates left-right diffusional anisotropy that is seen with the left-right orientation of the primary diffusivity and may be expected due to left-right orientation of crossing axons and glial processes. Histologic image (B) shows the glial processes (white arrowhead—stained green for GFAP, a glial marker), and axonal fibers (white arrow—stained red for RT-97, an axonal marker), confirm their left-right orientation in the midline. Also note that the lines of principal diffusivity also appear to track axons that exit ventrally through the white matter (A, arrowheads). (Adapted and reproduced from Schwartz ED, Duda J, Shumsky JS, et al. Spinal cord diffusion tensor imaging and fiber tracking can identify white matter tract disruption and glial scar orientation following lateral funiculotomy. J Neurotrauma. December 2005;22(12):1388–1398, with permission.) |
Observed differences in diffusion measurements between experimental settings may be due to a number of factors. Differences in fixation methods and fixative may affect diffusion values. In order to evaluate fixative effect, we obtained ADC values in normal spinal cords perfusion fixed with formaldehyde alone or with a combination of glutaraldehyde/formaldehyde. A glutaraldehyde/formaldehyde solution has been shown to preserve the myelin sheath and ultrastructural proteins such as intra-axonal cytoskeletal proteins better than buffered formaldehyde alone (78). We found there was a significant decrease in anisotropy (as measured with the ratio tADC/lADC) in the white matter of glutaraldehyde/formaldehyde fixed specimens compared to formaldehyde only fixed specimens, mostly due to lower lADC values in the glutaraldehyde/formaldehyde fixed specimens (53). This finding may be due to better preservation of the cytoskeletal proteins, as research has shown that breakdown of the cytoskeletal proteins will decrease intra-axonal water diffusion (79). Interestingly, there were no differences between the two fixatives with respect to tADC; a smaller tADC may have been expected with glutaraldehyde/formaldehyde as it better preserves the myelin sheath than formaldehyde alone, and it may be that actual loss of myelin is required to affect tADC values.
Another factor to consider when comparing and reviewing ADC values is the temperature of acquisition, as measured water diffusion increases with temperature. Differing MRI equipment and pulse sequences may also affect ADC measurements. It is clear that normal controls for each research model are necessary.
Mathematical Models and Computer Simulations of Water Diffusion
The correlation between observed diffusion behavior and underlying physiological mechanism is not fully
understood. Therefore, in order to facilitate interpretations of experimental observations and to delineate pathology of the spinal cord injury, numerical methods have been developed to simulate water diffusion behavior in spinal cord for both normal and injured models (80, 81, 82 and 84). By making certain assumptions, such as intracellular and extracellular diffusion rates and axonal shape, this approach allows for adjustments in both imaging parameters and possible histologic parameters in the simulations. Subsequent comparisons of simulations to actual data can help determine the effect of histologic factors (i.e., axonal size, axonal spacing, myelin sheath integrity/permeability, and myelin sheath thickness) on diffusion data, both with normal and injured spinal cords.
understood. Therefore, in order to facilitate interpretations of experimental observations and to delineate pathology of the spinal cord injury, numerical methods have been developed to simulate water diffusion behavior in spinal cord for both normal and injured models (80, 81, 82 and 84). By making certain assumptions, such as intracellular and extracellular diffusion rates and axonal shape, this approach allows for adjustments in both imaging parameters and possible histologic parameters in the simulations. Subsequent comparisons of simulations to actual data can help determine the effect of histologic factors (i.e., axonal size, axonal spacing, myelin sheath integrity/permeability, and myelin sheath thickness) on diffusion data, both with normal and injured spinal cords.
More realistic computer models have been recently developed (80, 85, 86 and 87) that are based on histologic images, as opposed to geometric approximations of axons, such as square prisms (84), cylinders (82, 83), and ellipsoids (81). Myelin comprises a significant proportion of white matter cross-sectional area and can undergo morphologic changes during injury and repair (88, 89). Therefore, instead of modeling myelin sheaths as infinitesimally thin membranes, myelin is more accurately modeled as multiple concentric bilipid layers, which result in anisotropic diffusion. The model thus provides flexibility in modeling various pathologic changes. To validate this model, Chin et al. (87) looked at the effects of time dependency and permeability on diffusion simulations with a digitized histologic section of the spinal cord. Their findings suggest that factors other than volume fractions of intracellular (intra-axonal) space (ICS), extracellular space (ECS) may be important in deriving ADC values in white matter. Histologic factors include the permeability of the axonal membrane and geometric spacing/orientation of the axons. Water exchange among cellular components is another important factor in determining ADC values, which suggests that proximity of water to the myelin sheath may be important and that differences in ADC will be seen in white matter with differing average axon diameters, even if overall volume fraction does not change.
Direct Correlation of Axon Morphometry with Diffusion Values
A critical goal of spinal cord imaging research is a noninvasive quantifiable predictor of axon loss. Although the mathematical models and computer simulations of water diffusion discussed above have been useful in determining the histologic factors that affect the changes in diffusion parameters seen following injury, we have taken a more straightforward approach by directly correlating axon morphometric parameters with transverse and longitudinal water diffusion. In order to obtain quantifiable histology, we developed an automated computer program that segments axons and quantifies their morphometric parameters from a digitized histologic image (Fig. 13-5). Using these data, we have shown that the natural variation of differing axon morphometric parameters (including axon density, axon spacing, axon diameter) between normal spinal cord tracts significantly correlates with different directional water diffusion values (54). Using regression analysis, we also showed that these quantitative measures of transverse and longitudinal diffusion could predict axon density with R2 = 64. Thus it is possible to create predictive mathematic equations that can translate diffusion data into precise measures of axon density and morphometry. We found that transverse water diffusion was related to the tortuosity of the extracellular space, with decreased transverse water diffusion in those white matter tracts with densely packed axons. Longitudinal diffusion appeared to be related to axon diameter, with larger axons having increased diffusion; this may reflect decreased overall density of cytoskeletal proteins in larger axons, resulting in fewer barriers to water diffusion. These findings seem to suggest that measurements of anisotropy based on different directional ADC values may not be solely an appropriate measure of axonal damage. If the ADC in each direction is based on different histologic parameters, then solely obtaining a ratio provides no more information than evaluating each of the ADC values separately and may actually provide less information.
Diffusion-tensor Magnetic Resonance Imaging of the In Vivo Rodent Spinal Cord
In vivo imaging of the rat spinal cord is difficult due to the small size of the spinal cord, motion, and time limitations. Nevertheless, there have been a number of publications confirming the anisotropic properties of spinal cord white matter in vivo. Nakada et al. (66) used a 7-T magnet to obtain in vivo diffusion encoding information in three directions in a rat. From this data, the authors constructed a color-coded image that displayed anisotropic directional information. Differentiation of gray and white matter was possible, and anisotropic water diffusion was seen in the white matter. These studies were limited by long acquisition times, as a single spin-echo sequence took almost 52 minutes. The data presented were qualitative, however, and no diffusion coefficients were provided.
Fenyes and Narayana (62, 90, 91) have published a series of papers that discuss and provide possible solutions to the difficulties arising from in vivo diffusion imaging of the rat spinal cord. The spinal cord in vivo is located further from the MRI receiver coil than an ex vivo specimen, resulting in decreased signal-to-noise ratio (SNR) with resultant poorer quality images. Fenyes and
Narayana alleviate this problem by using surgically placed inductively coupled implantable coils over the dorsal aspect of the thoracic spine to increase SNR, a strategy used by other researchers as well (92, 93). Motion artifacts from breathing were minimized by respiratory gating the MRI sequence. This required intubating the rats and using ventilators to ensure that MRI data acquisition was performed at the same point in the respiratory cycle. Other methods that decrease artifact include shimming the magnetic field, and postprocessing the data with reference scans. Fenyes and Narayana then could obtain a diffusion tensor of the spinal cord in vivo using a standard spin echo technique in 43 minutes, and multishot echoplanar imaging (EPI) sequence that decreased imaging time to 9 minutes. Although the spatial resolution was not as fine as in the ex vivo studies, anisotropy was seen in the white matter with longitudinal diffusion coefficient values in the white matter ranging from 2.22 × 10⁻³ mm2/s (spin echo) to 2.11 × 10⁻³ mm2/s (EPI) and transverse diffusion coefficients ranging from 0.36 – 0.56 × 10⁻³ mm2/s (higher values obtained with EPI). Gray matter was also noted to be anisotropic with longitudinal values ranging from 1.36 – 1.46 × 10⁻³ mm2/s and transverse values ranging from 0.41 – 0.59 × 10⁻³ mm2/s. Silver et al. (60) described similar in vivo anisotropic findings with an implantable coil, and, although no diffusion values were presented, they did provide a color-coded map of diffusion anisotropy. Much of this in vivo research with implantable coils has been performed in the thoracic spine, as the cervical spine is technically more difficult due to the necessity of maintaining coil configuration in a more mobile portion of the spinal column.
Narayana alleviate this problem by using surgically placed inductively coupled implantable coils over the dorsal aspect of the thoracic spine to increase SNR, a strategy used by other researchers as well (92, 93). Motion artifacts from breathing were minimized by respiratory gating the MRI sequence. This required intubating the rats and using ventilators to ensure that MRI data acquisition was performed at the same point in the respiratory cycle. Other methods that decrease artifact include shimming the magnetic field, and postprocessing the data with reference scans. Fenyes and Narayana then could obtain a diffusion tensor of the spinal cord in vivo using a standard spin echo technique in 43 minutes, and multishot echoplanar imaging (EPI) sequence that decreased imaging time to 9 minutes. Although the spatial resolution was not as fine as in the ex vivo studies, anisotropy was seen in the white matter with longitudinal diffusion coefficient values in the white matter ranging from 2.22 × 10⁻³ mm2/s (spin echo) to 2.11 × 10⁻³ mm2/s (EPI) and transverse diffusion coefficients ranging from 0.36 – 0.56 × 10⁻³ mm2/s (higher values obtained with EPI). Gray matter was also noted to be anisotropic with longitudinal values ranging from 1.36 – 1.46 × 10⁻³ mm2/s and transverse values ranging from 0.41 – 0.59 × 10⁻³ mm2/s. Silver et al. (60) described similar in vivo anisotropic findings with an implantable coil, and, although no diffusion values were presented, they did provide a color-coded map of diffusion anisotropy. Much of this in vivo research with implantable coils has been performed in the thoracic spine, as the cervical spine is technically more difficult due to the necessity of maintaining coil configuration in a more mobile portion of the spinal column.
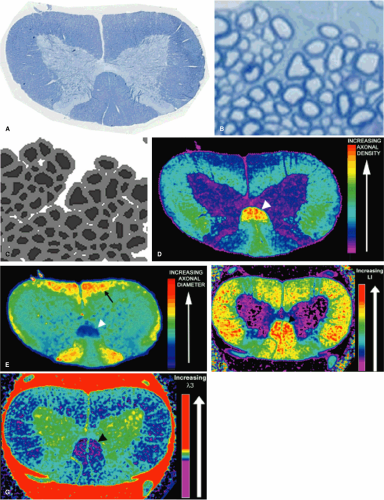 FIGURE 13-5. One micron toluidine blue stained section (A) of the normal rat cervical spinal cord can be entirely digitized at high resolution with multiple nonoverlapping images (B). Each image is then segmented with automated software to define each axon and its myelin sheath (C). Finally all the images can be montaged to create histologic maps such as axon density (D) and axon diameter (E). Note in D and E that the corticospinal tract (arrowhead) has the highest axon density and smallest axon diameter, as expected. Also as expected, the vestibular spinal tract has the largest axons (arrow, E). These histologic maps can potentially be registered with DTI maps, such as lattice index anisotropy (F) and λ3 (G). Note that the corticospinal tract (arrowhead, F and G) has the greatest anisotropy and smallest λ3, also consistent with previous studies that suggest that tightly packed axons have the smallest transverse diffusion and greatest anisotropy. |
In vivo diffusion imaging of the spinal cord has also been performed without implantable coils as well (58, 94). Although anisotropic water diffusion was seen in both gray and white matter, the values in these reports differed from those reported by Fenyes and Narayana. While these findings raise issues of reproducibility, it should be noted that measurements were taken in different parts of the spinal cord (cervical versus thoracic) and full diffusion tensor measurements were not obtained. Therefore, ADC values could be less accurate due to inadvertent misalignment of the experimental (spinal cord) and laboratory (MRI gradient) frame of reference.
Applicability of Ex Vivo Findings to the In Vivo Setting
Although the use of fixed tissue allows for higher resolution imaging, the question of whether findings from ex vivo studies are applicable in the in vivo setting is often raised. A DTI study comparing in vivo mouse brain with fixed mouse brain showed that while overall trace diffusions decreases in fixed tissue, the directional ADC values decrease proportionally, resulting in identical anisotropy data (95). Recently, Madi et al. (63) also looked at this issue in a study that compared in vivo and ex vivo DTI data of the rat spinal cord. As with Sun et al. (95), they found decreased average diffusivity in the fixed, excised spinal cord; however, they also found increased anisotropy (measured with FA) in the in vivo setting. They did see a linear relationship between the in vivo and ex vivo values (r = 0.99 for FA), however, they noted that care needs to be taken in interpreting in vivo pathology from ex vivo data.
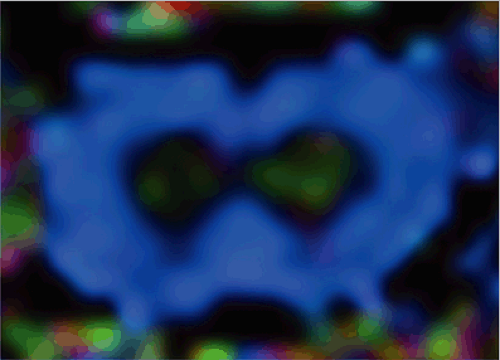 FIGURE 13-6. In vivo axial color-coded diffusion tensor image of the normal rat spinal cord at the thoracic-lumbar junction. As with ex vivo imaging, there is strong rostral-caudal anisotropic diffusion in the white matter, again seen as blue. |
We performed in vivo DTI of the rat thoracic spinal cord using a 4.7-T magnet with a standard spin echo diffusion tensor sequence for both cardiac gating and respiratory gating to minimize spinal cord motion (Fig. 13-6). In addition to evaluating measures of anisotropy, we also looked at eigenvalues between different spinal cord tracts. Our diffusion values for white matter appeared similar to those of Madi et al. (63). By looking at specific spinal cord tracts, we found significant differences that correlated with our previous ex vivo studies (53), in that spinal cord tracts with the larger axons, such as the vestibulospinal tract in the ventral white matter, had larger longitudinal and transverse diffusivities. Therefore, the same histologic factors that were related to ex vivo diffusion data (see above, “Direct Correlation of Axon Morphometry with Diffusion Values”) appear to be important in determining in vivo diffusion data as well.
Biexponential Diffusion in Neural Tissue
Prior publications have discussed the presence of two diffusion fractions (fast and slow) in neural tissue based on biexponential DWI models using high b-values (96, 97 and 98) and have argued that these diffusion fractions correlate
with volume fractions of the extracellular and intracellular spaces, respectively (99). Computer simulations, however, do not support the notion that the fast and slow components obtained with biexponential fits correspond solely to the intracellular and extracellular volume fractions (87).
with volume fractions of the extracellular and intracellular spaces, respectively (99). Computer simulations, however, do not support the notion that the fast and slow components obtained with biexponential fits correspond solely to the intracellular and extracellular volume fractions (87).
In general, biexponential diffusion is seen using b-values ranging from 4,000 to 10,000 s/mm2 (96, 98, 99 and 100). Elshafiey et al. (61), however, reported biexponential diffusion in the rat spinal cord in vivo, and suggested that biexponential diffusion may be seen with b-values as low as 1,600 s/mm2. If not taken into account, this property could result in artifactually low ADC values. In our ex vivo studies with b-values ranging up to 3,100 s/mm2, we performed linear regression analysis and demonstrated robust linear fit to our data, both in the transverse and longitudinal directions, with R2 >0.99 (53). Although a slow diffusing component may be identified with much larger b-values, we have used a monoexponential fit for our data as the diffusion values appear to primarily arise from the fast diffusing component.
Diffusion-weighted and Diffusion-tensor Magnetic Resonance Imaging in Experimental Spinal Cord Injury
Evaluation of Axonal Integrity
Axonal transection is only partly responsible for the functional deficits resulting from spinal cord injury. Much of the damage is due to secondary injury that expands the size of the lesion with additional degeneration of axonal fiber tracts (101, 102, 103). Within 15 minutes, intact myelinated axons swell and there is a reduction in intact neurofilaments (104). Myelin sheaths then begin to split, and vesicles may form in larger axons (105). It may be postulated that damage to the myelin sheath should increase membrane permeability, which would subsequently increase the tADC. The effect of myelin on lADC values is not as strong, and therefore the cellular swelling seen in damaged axons, as well as loss of energy dependent systems in transected axons, may be expected to lower the lADC. Treatments for spinal cord injury, however, may attenuate these diffusion changes, and perhaps correct diffusion values over time. Early experimental research has supported these hypotheses.
Ford et al. (21) showed that alterations in ADC values were more sensitive than conventional MRI techniques in detecting spinal cord injury. They measured tADC and lADC values in fixed rat spinal cords that had been subjected to thoracic spinal cord weight drop injury and then sacrificed seven days later. T2 maps were created with a spin echo sequence utilizing identical slice thickness and positioning. Conventional MRI was used to subjectively evaluate the spinal cord, and in areas where gray matter and white matter could be differentiated, the gray matter, dorsal white matter, and lateral white matter were described as normal appearing versus abnormal appearing. At the lesion center, large portions of the spinal cord were so severely damaged that gray matter could not be distinguished from white matter. As expected, the axial slices farthest from the lesion center appeared more normal. At all sites, whether appearing abnormal or normal, the T2 values did not differ significantly from normal controls. Following injury, tADC values increased and lADC values decreased in both normal and abnormal appearing white matter. These changes resulted in decreased anisotropy. These results imply that there are consequences of spinal cord injury that dramatically alter axon structure without changing water content or T2, and, therefore, would not be detected by conventional MRI. If we assume that the myelin sheaths and cell membranes restrict water diffusion in the transverse direction, then the loss of diffusion anisotropy at the lesion epicenter may be due to mechanical disruption of the axons and their myelin sheaths. Farther from the lesion center, axonal swelling may have decreased the lADC, while the increased tADC may be attributed to increased permeability of damaged and degenerating myelin sheaths or cell membranes.
Nevo et al. (55) has recently shown that measurement of ADC values and anisotropy can be used to quantify spinal cord injury and neuroprotection. Rats were subjected to a weight drop contusion injury. Untreated rats were then compared with rats treated with T cells specific to the central nervous system self-antigen myelin basic protein, an intervention that has been shown to be neuroprotective (106). Rats were sacrificed after more than 3 months and ex vivo MRI was performed. Anisotropy maps were created and visual inspection of these maps suggested that there was lower anisotropy in both treated and untreated rats compared to control animals, possibly reflecting spinal cord injury and disruption of anisotropic axon fibers. There also appeared to be less anisotropic tissue at the lesion site and surrounding tissue in untreated rats compared to treated rats, perhaps due to neuroprotection in treated rats. Histograms were constructed from portions of the spinal cord near the injury center, revealing greater loss of anisotropy in untreated rats compared to treated rats. Locomotor scores were obtained for these animals and improved scores were seen in the treated animals, and decreased anisotropy appeared to correspond with poorer locomotor performance. Although detailed histologic analysis was not performed, the authors attribute the improved anisotropy in the treated rats to enhanced survival of myelinated fibers and decreased formation of cysts. This study suggests that measures of anisotropy in the injured spinal cord may be used to evaluate injury severity and possibly evaluate treatment effects.
Related posts:
 Pathophysiology of Spinal Cord Injury
Plain Film Radiography and Computed Tomography of the Cervical Spine: Part I. Normal Anatomy and Spinal Injury Identification
Imaging of Thoracolumbar Spinal Injury
Plain Film Radiography and Computed Tomography of the Cervical Spine: Part II. Classification and Subtypes of Spinal Injury
Magnetic Resonance Imaging of Acute Spinal Trauma
Postoperative Spinal Imaging
Pathophysiology of Spinal Cord Injury
Plain Film Radiography and Computed Tomography of the Cervical Spine: Part I. Normal Anatomy and Spinal Injury Identification
Imaging of Thoracolumbar Spinal Injury
Plain Film Radiography and Computed Tomography of the Cervical Spine: Part II. Classification and Subtypes of Spinal Injury
Magnetic Resonance Imaging of Acute Spinal Trauma
Postoperative Spinal Imaging
Stay updated, free articles. Join our Telegram channel

Full access? Get Clinical Tree


