Chapter 7 Filters in the Electroencephalogram
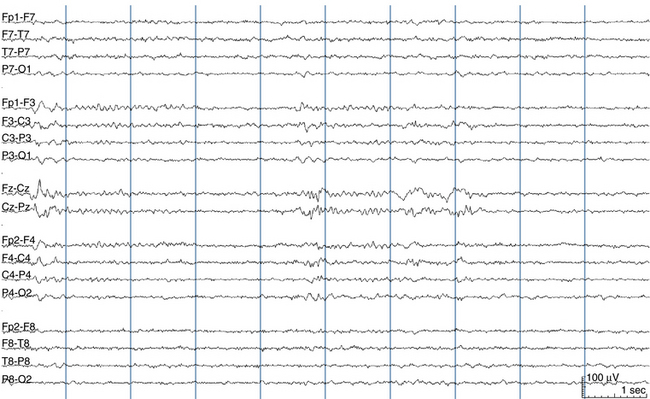
Figures 7-1 and 7-2 illustrate the impact of filters on an EEG page. Figure 7-1 shows an EEG recorded during a moderate amount of patient movement, a “raw” EEG trace displayed without the explicit use of filters. Figure 7-2 shows the same page displayed with typical filter settings. Note that, despite the fact that muscle artifact still obliterates portions of the top four and bottom four lines of the EEG (the temporal areas), in the filtered example, the amplitude of that muscle artifact is reduced, making it easier to see adjacent channels. Indeed, in the filtered example, the presence of certain waveforms can be intermittently recognized within the areas of muscle artifact (this artifact is generated by contraction of the temporalis muscles) that otherwise would not have been detectable. Also note that the baseline of each channel is flatter, allowing for easier interpretation—each channel is more likely to stay within its own horizontal area after the filters are used.
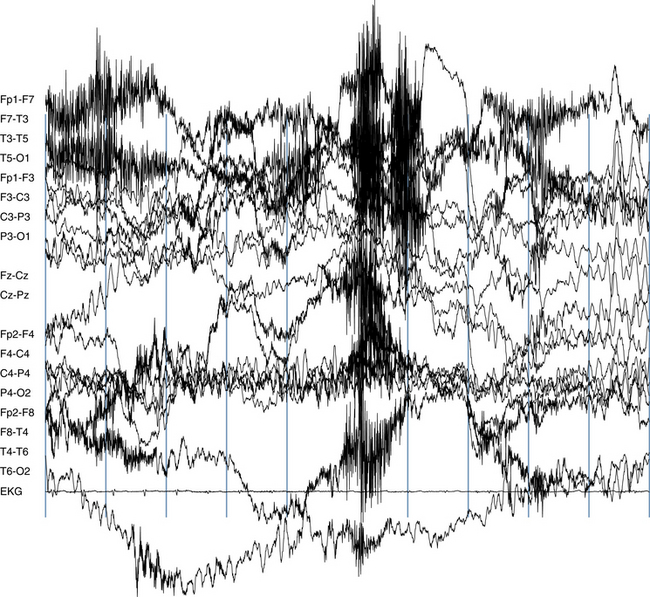
Figure 7-1 This EEG page was obtained without the explicit use of filters. Muscle artifact obliterates much of the temporal chains (the top four and bottom four EEG channels). The baselines of certain channels fluctuate so widely that they often obliterate other channels. Note that the bottom two channels even dip below the electrocardiogram channel. Compare to Figure 7-2.
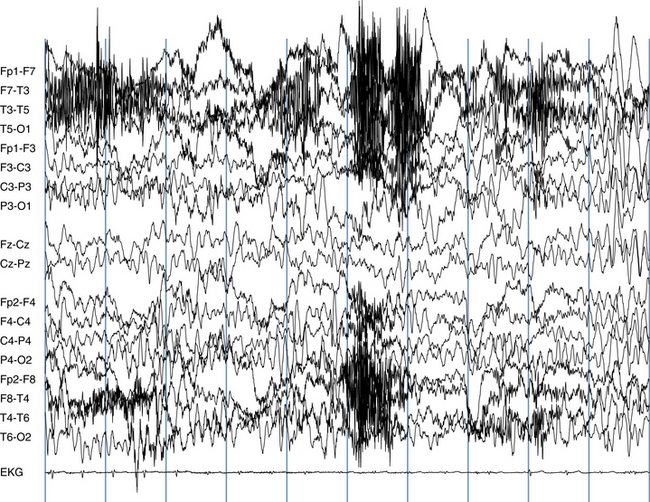
Figure 7-2 This is the same 10-second EEG page that was displayed in Figure 7-1 except that now the low-frequency filter is set at 1 Hz, and the high-frequency filter is set at 70 Hz. Note that the baselines of each channel are flatter. Also, the amplitude of the muscle artifact is significantly reduced throughout. Although there is still a large amount of artifact present on this page, the use of standard filter settings has rendered this page considerably more readable.
THE BASIC STRATEGY BEHIND CHOOSING FILTER SETTINGS
The most ideal filter design would be one that removes all of the electrical noise or artifact from the EEG and only allows true cerebral activity to pass through. Unfortunately, no such “smart” filters exists; filters can only remove waves according to rigid mathematical rules. Luckily, there are good rationales for filtering out certain components of EEG signals using fairly simple mathematical assumptions. These assumptions are based on the idea that the brain only generates EEG waves within a certain range of frequencies and that any activity outside that range (unusually slow activity and unusually fast activity) is not likely to be of cerebral origin. Indeed, one of the general assumptions of EEG filter design is that activities well below 1 Hz and well above 35 Hz do not arise from the brain and likely represent electrical noise or artifact. Like many assumptions, this claim is mostly true but not completely true, as we shall see. On the basis of the concept that the frequency of almost all brain electrical activity of interest lies within a particular bandwidth, EEG filters are typically set up so that one filter rejects the majority of very high-frequency activity and another filter rejects the majority of very low-frequency activity. The range of frequencies between these unwanted high and low frequencies that is allowed to pass through the filter setup is referred to as the bandpass. The way that different filter setups are associated with different bandpasses is illustrated here.
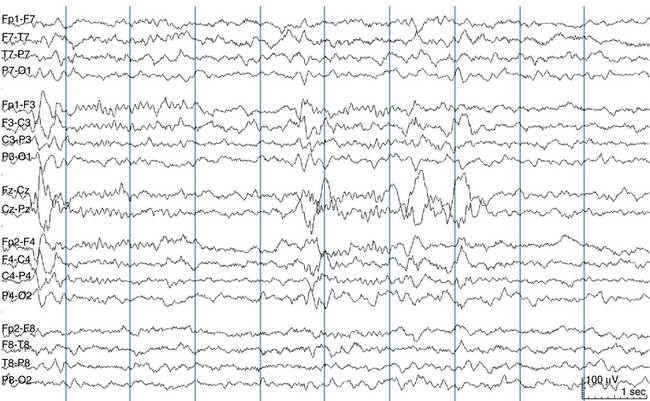
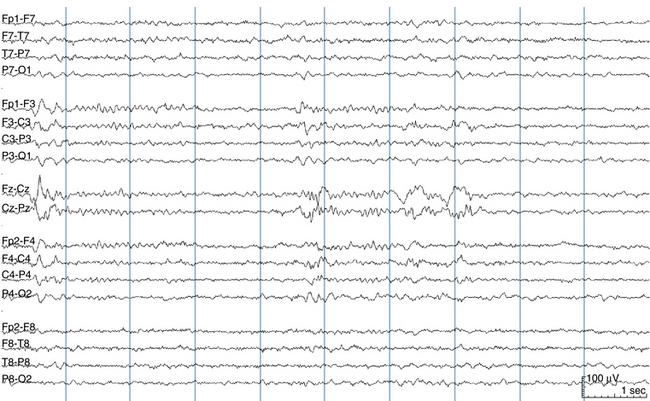
Rather than being used to reject spurious activity, occasionally filtering techniques can be used to bring out certain EEG activity that might otherwise have been hidden in other, higher voltage activity. In this application, the electroencephalographer may purposely attenuate the slow activity in a record (even though it represents true cerebral activity) to accentuate or “bring out” fast activity that would otherwise be lost in high-voltage slow waves. Examples of such special filtering techniques (which are not necessarily used during every EEG reading session) are illustrated in Figures 7-3 and 7-4. These figures show how aggressive use of the low-frequency filter can be used to bring out the presence of spike-wave discharges.
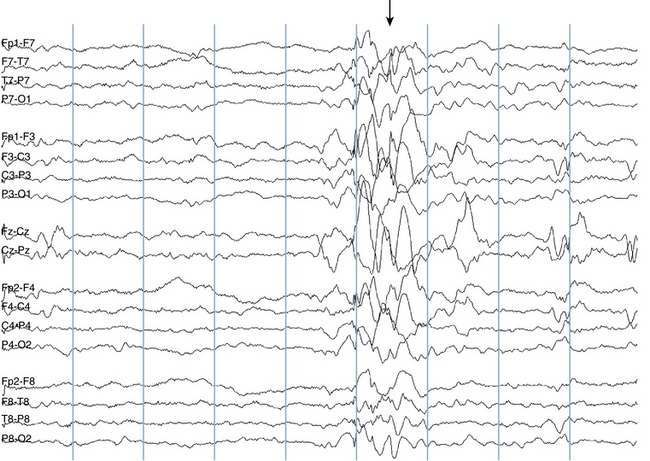
Figure 7-3 This recording is made during a transition from Stage I to Stage II sleep using the standard low filter setting of 1 Hz. A burst of high-voltage slowing is seen during the sixth second (arrow). Inspection of the burst suggests the possibility that some spike activity may be intermixed, but a definite determination as to whether spike activity is truly present is difficult. Compare to same EEG signals displayed with different filter settings in Figure 7-4.
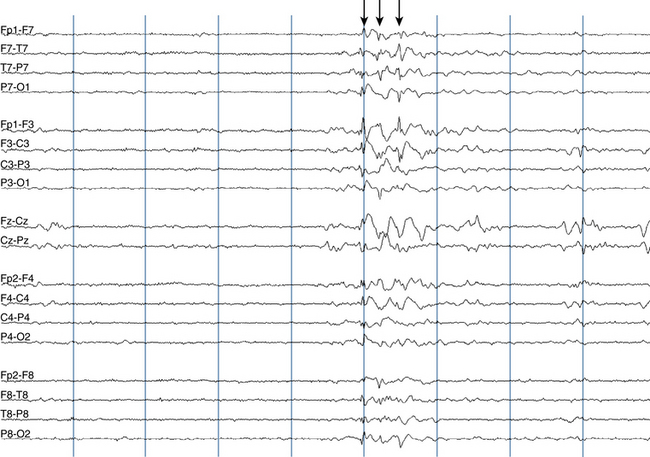
Figure 7-4 The same EEG page as shown in Figure 7-3, but this time with an aggressive low-filter setting of 10 Hz. Note that the bulk of the slow activity is suppressed, and because the slow activity is less prominent, faster activity—in particular, the spikes—is accentuated. With this filter setting, it is clear that there are three repetitive spikes with a broad field (below arrows) mixed into this slow-wave burst. If there was a question as to whether the initial slow-wave burst represented some type of motion artifact, the presence of these three embedded, rhythmically repetitive spikes with organized topography increases the likelihood that this represents an example of a diffuse, repetitive spike-wave discharge rather than motion artifact.
TYPES OF FILTERS
The three commonly used filter types in clinical EEG are low-frequency filters, high-frequency filters, and notch filters. The purpose of a low-frequency filter is to filter out low-frequency activity and to leave higher frequencies as they are. Because low-frequency filters attenuate low frequencies and allow high frequencies to “pass through,” engineers often refer to low-frequency filters as high-pass filters. Likewise, high-frequency filters are designed to filter out high-frequency activity and allow low-frequency activity to pass through and are sometimes referred to by engineers as low-pass filters. Although the use of the terms high pass and low pass to name filters is more common in the world of electrical engineering, these are not the preferred terms in clinical electroencephalography. In the world of clinical EEG, the alternate terms high-frequency filter (HFF—filters out the high frequencies) and low-frequency filter (LFF—filters out the low frequencies) are used, with the terms high filter (HF) and low filter (LF) sometimes used as shorthand abbreviations. Thus, HF is synonymous with HFF and LF is synonymous with LFF.
FILTER NAMING CONVENTIONS
There are two different naming schemes for high- and low-frequency filters. A filter can be named after a frequency (e.g., a “5-Hz low filter”) or after its time constant (e.g., a “low-filter with time constant of 0.1 seconds”). When a filter is named after a particular frequency, this is referred to as the nominal frequency or the cutoff frequency of the filter. Whether the filters on a particular EEG machine are named according to a cutoff frequency or a time constant is the decision of the manufacturer. Because referring to filters by their cutoff frequencies is becoming more common, and also because cutoff frequencies are easier to understand, we discuss the relationship between a filter’s electrical characteristics and its cutoff frequency first.
Low-Frequency Filters
Visual Effects of Low-Frequency Filters
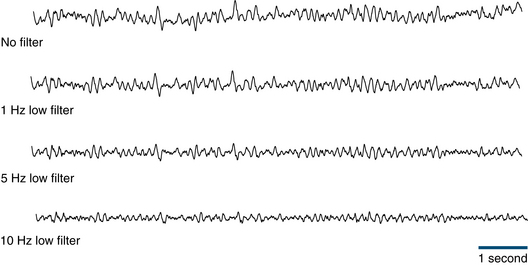
When standard low frequency filter settings such as a cutoff frequency of 1 Hz or below are used for the low-frequency filter, the main effect is to help keep each EEG channel within its own horizontal area, eliminating large drifts upward or downward into the space of other channels. This is because this baseline drifting actually represents a very low frequency wave. More aggressive use of the low-frequency filter (higher cutoff frequencies such as 3 Hz or 5 Hz) initially begins to attenuate delta frequencies and, when even higher cutoff frequencies are used, may almost completely eliminate some slow activity, sometimes with the advantage of bringing out other features in the EEG (see Figures 7-5, 7-6, 7-7, 7-8, and 7-9). Examples of how different low-frequency filters might affect a simple trace of the posterior rhythm are shown in Figure 7-10. Note that when successively more restrictive settings are used for the low filter, the baselines of each channel become straighter, but faster activity is relatively preserved.
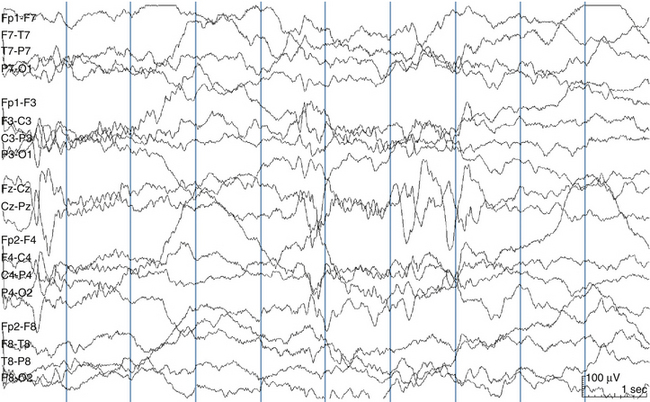
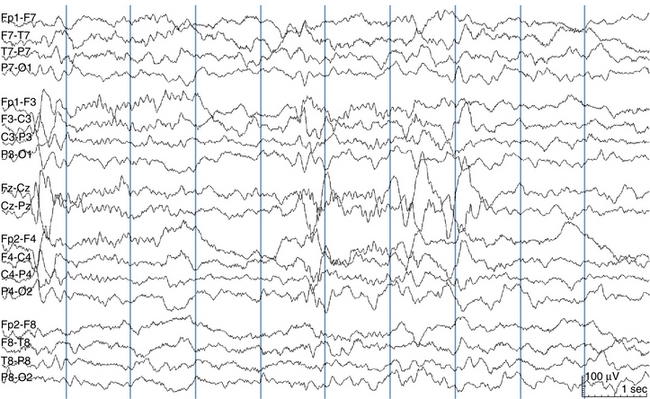
Figure 7-6 The same page of Stage II sleep from the previous example is shown, now displayed with the standard LFF setting of 1 Hz. The wide deflections in the baselines seen in Figure 7-5 of each channel are no longer present making the page more readable.
Roll-off Characteristics
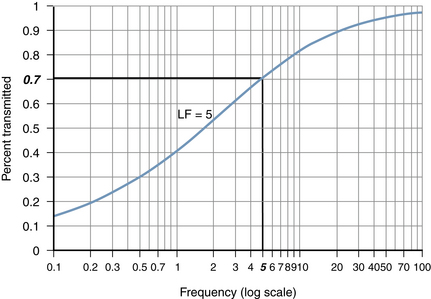
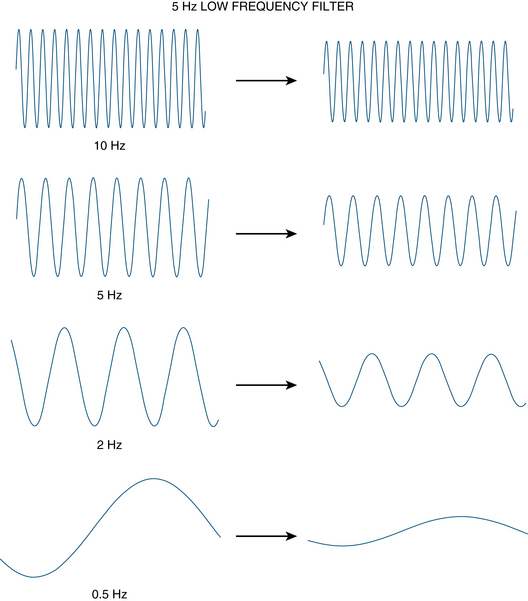
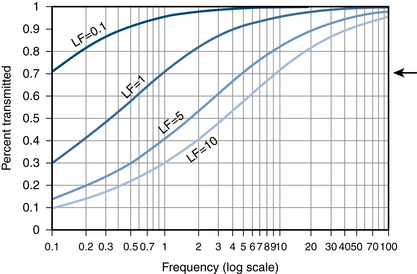
The graph in Figure 7-11 illustrates how a 5-Hz LF would handle sine waves of varying frequencies. The curve describes what portion of a pure sine wave (y axis) at a given frequency (x axis) would be allowed to pass through the filter. Considering the example of this 5-Hz low-frequency filter in more detail, the curve shows that a 5-Hz sine wave presented to this filter will lose 30% of its amplitude after passing through the filter. (Why the amount of reduction at the cutoff frequency is specifically 30% is explained later.) If the original 5-Hz wave presented to the filter has an amplitude of 100 μV (the input wave), then the filter’s output wave would only have an amplitude of 70 μV. What does the 5-Hz LF do with waves just above and just below 5 Hz? The roll-off curve for this filter shown in this figure indicates that a 4-Hz curve would be attenuated by 33%, but a 6-Hz sine wave would only be attenuated by 26%. The type of curve shown in Figure 7-11 that shows how a given filter processes pure sine waves of different frequencies is called the roll-off characteristic of the filter. Figure 7-12 shows how a 5-Hz LFF handles input waves of 10 Hz, 5 Hz, 2 Hz, and 0.5 Hz of the same amplitude, attenuating the lowest frequency waves dramatically but only causing a mild reduction in the amplitude of the 10-Hz wave. The exact amount of reduction at each frequency is given by the roll-off characteristic shown in the previous figure. Figure 7-13 shows the roll-off characteristics of 0.1-, 1-, 5-, and 10-Hz low filters.
High-Frequency Filters
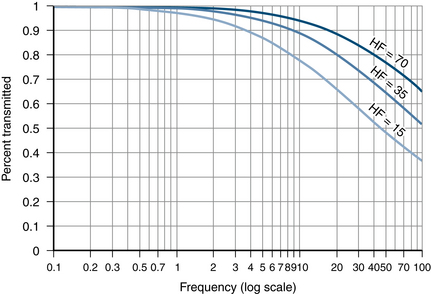
High-frequency filters also have a roll-off characteristic, but, logically, the curve rolls off in the direction opposite to the roll-off curves for LFFs, falling off toward the right (the direction of the higher frequencies). Just as was the case for LFFs, an HFF attenuates a sine wave at its nominal frequency by 30%; higher frequency waves are attenuated by even more than 30%, and lower frequency waves are attenuated by less than 30%. Figure 7-14 shows examples of roll-off characteristics for theoretical 70-, 35-, and 15-Hz HFFs. High-frequency filters are especially useful for filtering out muscle artifact and other high-frequency noise. Overly aggressive use of HFFs, however, will not only attenuate the height of high-frequency waves but can also change wave shape giving misleading results, as discussed later in the discussion of time constants.
WAVE ATTENUATION AND DECIBELS
where p1 and p2 are the powers of the two waves being compared.
where a1 and a2 are the amplitudes of the two waves being compared.
This equation can be rewritten taking the squared terms out of the parentheses:
The nominal or cutoff frequency of a filter is defined by the frequency at which the power is attenuated by 50%. This frequency at which the power is reduced by 50% is also called the “3-dB point” of a filter because the formula tells us that a 50% reduction in power is equal to approximately 3 dB: when p1 is twice p2, 10 log (2) ≅ 3.01. What ratio of amplitudes corresponds to a 2:1 ration of powers? Because the amplitudes must be squared to get the power, the corresponding pair of amplitudes that would also manifest a 3-dB change would represent approximately a 70% reduction in wave height, such as from 10 to 7:
10 log (102/72) = 10 log (100/49) ≅ 3 dB
The steepness of the roll-off characteristic of a filter is sometimes described in the units of decibels per octave. The term octave is best known in the music world, describing the difference between two notes such as “middle C” and “high C.” In both the world of music and the world of electrical signals, an octave represents a doubling or a halving of a wave frequency. Therefore, 2 Hz is one octave below 4 Hz (and “middle C” on the piano represents a tone at 256 Hz, whereas the note one octave above, “high C,” is the tone at 512 Hz). Simple low-filter frequency-response curves “roll off” at a maximum of 6 dB per octave, although this roll-off rate is not constant across the entire frequency band.
BANDPASS FILTERS
As mentioned earlier, an HFF and an LFF are typically combined to create a specific bandpass. Typical filter settings with which many routine EEGs are initially recorded include a pairing of an LFF set at 1 Hz and an HFF set at 70 Hz. Taking into account the fact that the roll-off characteristics for these filters are relatively gradual (rather than creating a “brick wall” where no activity below 1 Hz or above 70 Hz can pass), it is no surprise that a fair amount of EEG activity with frequencies above and below the nominal frequencies of 1 Hz and 70 Hz still may appear in the recording. Figure 7-15 shows two possible bandpass setups, one with LFF = 1 Hz and HFF = 70 Hz, and the other with LFF = 5 Hz and HFF = 70 Hz. Figure 7-16 illustrates the same bandpass setup, but plotting the curves with the frequency on a linear scale for comparison. Figure 7-17 illustrates the bandpass curve that uses a more aggressive HFF setting of 35 Hz. Note that, comparing the Figures 7-15 and 7-17, the shapes of the curves are similar, and the portions of the curves on the left (representing the low frequencies) are nearly identical. The portions of the curves on the right side (representing the higher frequencies) show more attenuation when the HFF is set to 35 Hz rather than 70 Hz.
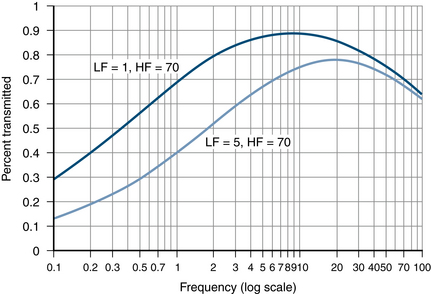
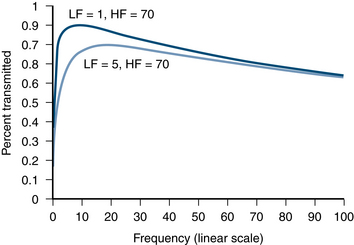
Figure 7-16 For the sake of comparison, the same two bandpass curves as are shown in Figure 7-14 are plotted on a linear frequency scale.
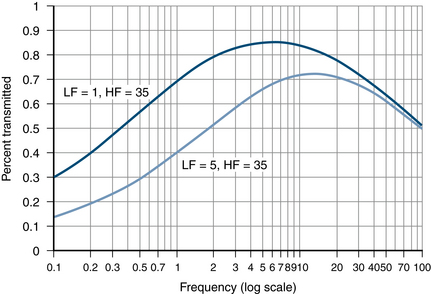
Figure 7-17 These curves illustrate the bandpasses resulting from pairing a 1-Hz LFF with a 35-Hz HFF and the pairing of a 5-Hz LFF with a 35-Hz HFF, respectively. Frequency is plotted on a logarithmic scale. Note that the right side of the curve falls off more steeply compared with the curves shown in Figure 7-14 because of the more aggressive (lower) HFF cutoff frequency used.
50-HZ AND 60-HZ NOTCH FILTERS
Unlike HFFs and LFFs, which have a gradual roll-off curve, the purpose of a notch filter is to exclude a single frequency from the EEG signal. These notch filters are most useful when the field of AC current from the electrical wiring and outlets that surround the patient contaminates the record. The ideal notch filter’s transmission curve shows a flat response for all frequencies, except for the nominal frequency of the filter, where there is a notch in the curve denoting near complete attenuation of any waves at that particular frequency (see Figure 7-18). Of course, in the world of working EEG, notch filters may not operate as perfectly as this description implies, but they typically do a good job of suppressing unwanted AC line voltage artifact. Figure 7-19 shows a sample of EEG with 60-Hz contamination in multiple channels. Figure 7-20 shows detail of the 60-Hz artifact. The reader should become adept at identifying the 60-Hz sine wave that comprises the fine structure of this type of artifact. Figure 7-21 shows the same page of EEG with the 60-Hz notch filter “in” (applied).
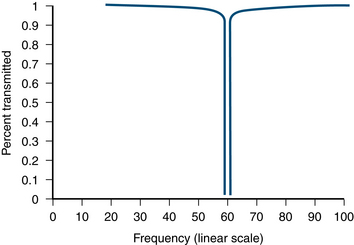
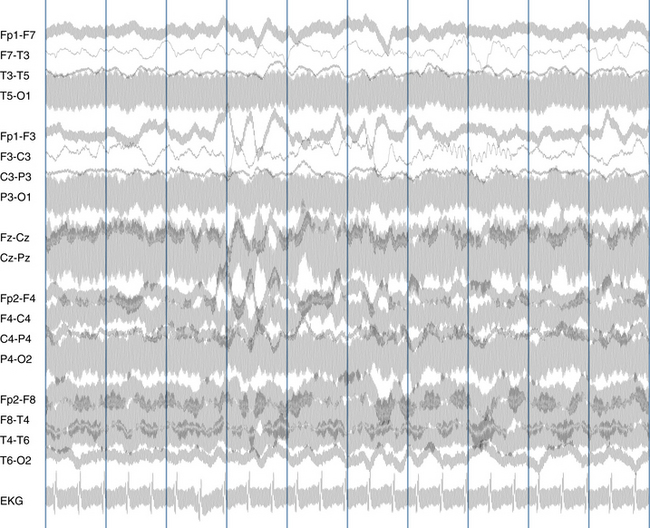
Figure 7-19 Multiple channels in this tracing are obscured by 60-Hz artifact. In general, 60-Hz artifact can be distinguished from muscle artifact by its highly regular, sinusoidal appearance. Close examination of the waves sometimes allows a 60-Hz wave to be discerned, which in this example has the appearance of vertical ribbing. Also, notice that the amplitude of the artifact tends to stay steady in each channel. Compare to Figure 7-20.
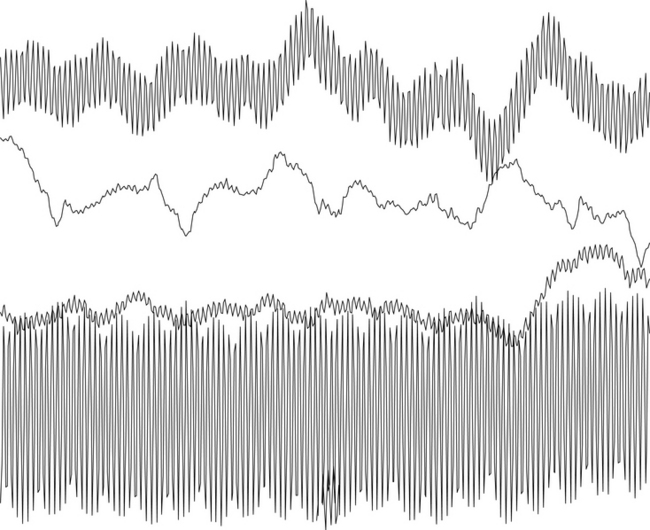
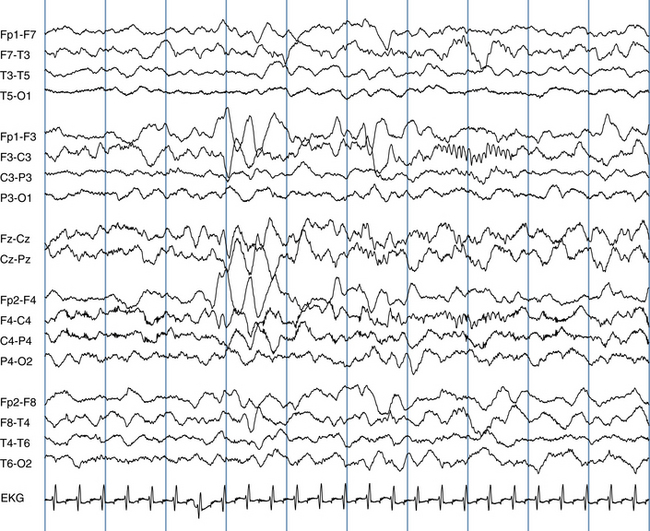
Figure 7-21 The same page of EEG as was shown in Figure 7-18, this time displayed with the use of a 60-Hz notch filter. The notch filter has dramatically “cleaned up” the EEG tracing, and the page now looks fairly unremarkable. Now that the page has been filtered, there is little to suggest to the reader that several of the electrode contacts probably have impedance problems.
Some of the imperfections of notch filters can be overlooked, such as the fact that a 60-Hz notch filter will also attenuate some adjacent frequencies, such as 59 Hz and 61 Hz. The good news is that the electroencephalographer is rarely interested in these nearby frequencies because they are in a range much faster than the cerebral rhythms that are of interest during routine analysis; this type of shortcoming is rarely noticed. Also, a notch filter may have difficulty suppressing particularly large amounts of 60-Hz activity. The 60-Hz notch filter is useful in countries in North America and other locations where AC electricity is supplied at 60 Hz. The 50-Hz notch filter is used in the majority of countries where the line frequency is 50 Hz (in North America, the 50-Hz notch filter would serve no useful purpose).
Related posts:


Stay updated, free articles. Join our Telegram channel

Full access? Get Clinical Tree


