Focal Mass Lesions


Focal Mass Lesions


Michelle Wilson Bell

Alexander G. Khandji

Fabio M. Iwamoto


INTRODUCTION

The differential diagnosis of an undifferentiated focal brain mass lesion is broad and the clinical presentation quite variable. This chapter will discuss the major etiologic categories of focal brain mass lesions—namely tumors, abscesses, and other inflammatory lesions—and present an algorithm for implementing empiric management in stable patients while a definitive diagnosis is pursued.


EMERGENT MANAGEMENT OF SYMPTOMATIC INTRACRANIAL MASS EFFECT

The first step in management of a focal mass lesion is to assess for increased intracranial pressure (ICP) and signs of herniation in patients with radiographic signs of mass effect and midline shift.

Common symptoms and signs of increased ICP include headache, vomiting, depressed level of consciousness, papilledema, abducens nerve palsies, and hypertension with or without bradycardia (Cushing reflex). As mass effect worsens, in addition to the expected contralateral hemiparesis, patients develop motor signs ipsilateral to the lesion as a result of lateral and rotation displacement of both corticospinal tracts. Common signs include stiffening, hyperreflexia, and extensor plantar responses. With further brain tissue displacement, transtentorial herniation leads to ipsilateral third nerve palsy (“blown pupil”).


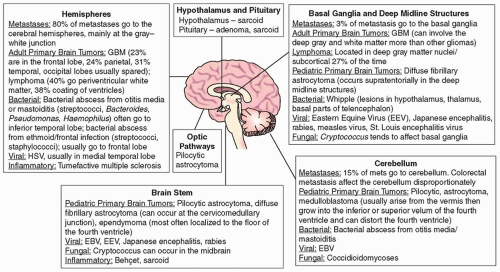
FIGURE 17.1 Common causes of focal lesions in the brain based on location. GBM, glioblastoma; HSV, herpes simplex virus; EBV, Epstein-Barr virus.

If the clinical assessment is concerning for elevated ICP, it is imperative to take immediate measures to reduce it. First-line interventions include head elevation to 30 degrees and bolus osmotherapy with either 20% mannitol 1 g/kg intravenously (IV) or 30 mL of 23.4% hypertonic saline if there is central venous access. If level of consciousness is depressed with inability to maintain and protect the airway, the patient should be intubated and hyperventilated to PaCO2 of 30 mm Hg while awaiting definitive treatment (see Chapter 107 for further details).

If there is no evidence of increased ICP, further management should be determined by the clinician’s assessment of the most likely underlying cause of the mass lesion. This chapter will discuss the diagnostic evaluation of undifferentiated mass lesions and the initial steps in management depending on the suspected diagnosis.


CAUSES OF FOCAL BRAIN LESIONS

Figure 17.1 shows common causes of focal lesions of the brain not consistent with stroke or trauma based on location.


BRAIN TUMORS

Tumors account for the majority of focal brain mass lesions. In adults, metastatic tumors account for approximately 50% of symptomatic brain tumors (Fig. 17.2). The most common primary tumor to metastasize to the brain is lung cancer. Approximately 50% to 60% of brain metastasis originate from lung cancer, with 25% to 40% being of non-small cell lung cancer (NSCLC) origin and 5% to 15% being of small cell lung cancer (SCLC) origin. About 20% of lung cancer brain metastases are found at the time of initial diagnosis. The next most common sources of brain metastases are breast cancers (15% to 30%), melanoma (10%), renal cancer (5%), and gastrointestinal cancers (5%) (see Chapter 97).


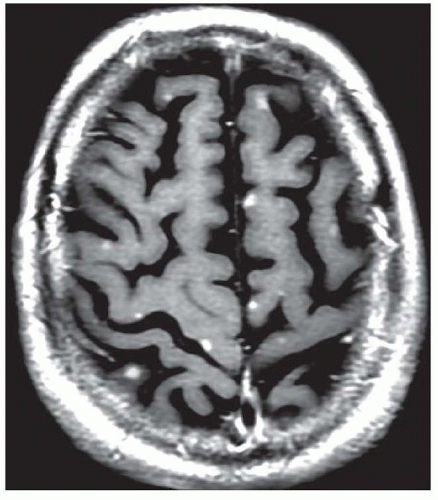
FIGURE 17.2 Metastatic small cell lung cancer. T1 MRI of the brain shows multiple small enhancing metastatic nodules.


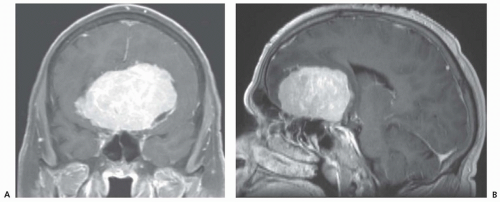
FIGURE 17.3 Large parasagittal olfactory groove meningioma strongly enhancing after contrast. Note the small cleft of CSF noted along the left margin of the lesion (coronal image, panel A).


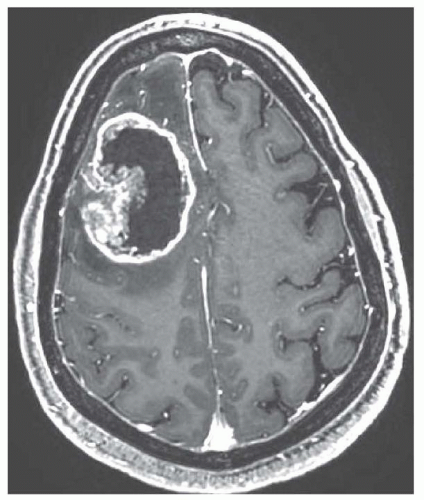
FIGURE 17.4 Glioblastoma multiforme. T1 MRI shows central necrosis and ring enhancement with a nodular component extending into the center of the lesion.

Approximately 70,000 primary brain tumors are diagnosed each year. The most common form of primary brain tumor found in adults are meningiomas (35%). These dural-based masses enhance densely with gadolinium on magnetic resonance imaging (MRI) (Fig. 17.3) and are easy to identify prior to surgery due to their highly characteristic appearance (see Chapter 98). Gliomas are the second most common form of primary tumor accounting for 30% of all brain tumors (see Chapter 97). Glioblastoma multiforme is the most common form of glioma and account for 80% of all malignant brain tumors (Fig. 17.4). Anaplastic astrocytoma and oligodendrogliomas (Fig. 17.5) are lower grade tumors that show less prominent enhancement and no necrosis. Less common
adult primary brain tumors, in order of frequency, are pituitary adenomas (Fig. 17.6 and Chapter 100), nerve sheath tumors such as acoustic neuromas (see Chapter 102), and primary central nervous system (CNS) lymphomas (Fig. 17.7 and Chapter 99). Table 17.1 outlines typical clinical features, imaging findings, and suggested ancillary testing in adult patients with suspected brain neoplasm.


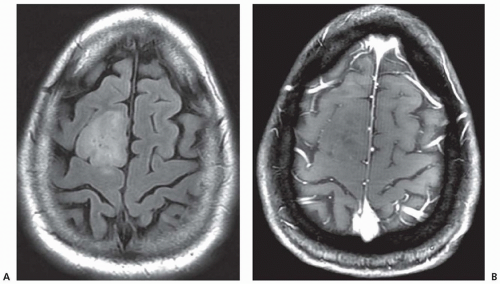
FIGURE 17.5 FLAIR (A) and T1 gadolinium enhanced (B) MR of a right frontal oligodendroglioma showing very little contrast enhancement and very little surrounding edema.


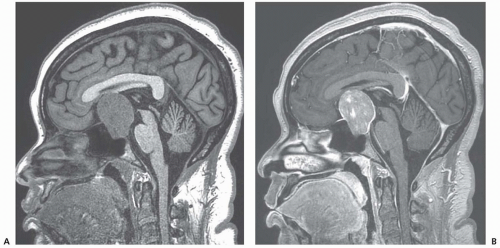
FIGURE 17.6 Pituitary macroadenoma. A: Hypointense on T1. B: Enhancing postcontrast.

In children, the most common primary brain tumors are gliomas (40%) including pilocytic astrocytoma (Fig. 17.8), embryonal tumors (15%) including medulloblastoma (Fig. 17.9), and ependymoma (˜5%). Table 17.2 outlines typical clinical features, imaging findings, and suggested ancillary testing in children with suspected brain neoplasm (see also Chapter 145).


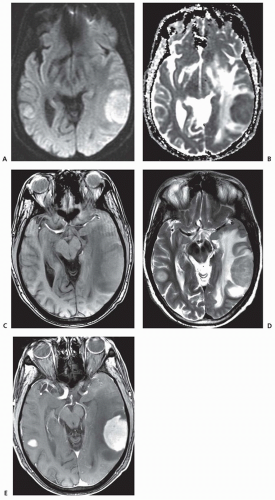
FIGURE 17.7 Primary CNS lymphoma. A: MRI restricted diffusion of DWI. B: Reduced apparent diffusion coefficient (ADC) appears as a dark core. C: T1 hypointense. D: T2 hyperintense peripherally due to edema tracking through the white matter. E: Avid contrast enhancement with gadolinium on T1 imaging.


TABLE 17.1 Common Adult Brain Tumors


Clinical Pearls


Imaging Features


CSF Studies and Systemic Workup


Metastatic tumors (in order of decreasing frequency)


Lung


  • Small cell lung cancer eventually metastasized to the brain in up to 50% of cases.


Breast


  • HER2+/ER− receptor status portends a higher likelihood of metastasis to the brain.


Melanoma


  • Head, neck, and primary oral lesions have a higher rate of metastasis.


Renal


  • In up to 10% of patients, a new metastasis later develops in patients who were thought to have been cured of their primary tumor.


Colorectal


  • Left-sided cancers are more likely to metastasize to the lung and brain, whereas right-sided tumors usually go to liver.


  • 80% of brain metastases occur in the cerebral hemispheres, 15% in the cerebellum, and 5% in the basal ganglia.


  • Metastases tend to localize to the gray-white junction location and the border zone between two major arterial distributions.


  • Brain metastases are multiple, approximately 50% of cases.


  • FLAIR imaging tends to reveal a large amount of associated vasogenic edema.


  • MR spectroscopy shows low N-acetylaspartate (NAA) and creatine levels and elevated choline levels reflecting cell membrane and myelin turnover.


  • Gradient echo or SWI may demonstrate hemosiderin deposits in cancers that tend to hemorrhage (e.g., melanoma, choriocarcinoma, renal cell, and thyroid cancer). Melanoma tends to be hyperdense on CT scan even in the absence of hemorrhage. On MRI, melanoma is hyperintense on T1 and hypointense on T2.


  • Colorectal metastases involve the cerebellum disproportionately.


More than 60% of patients with brain metastases will have a mass demonstrated on chest imaging that is either due to a primary lung cancer or lung metastases from a primary tumor elsewhere.


Tests to consider when brain metastases are suspected:


  • Mammogram


  • Skin exam


  • Whole-body CT


  • Whole-body FDG-PET


Meningoma


  • 35% of all primary brain tumors


  • 67% of cases occur in women


  • Peak incidence, age 40-60 yr


Dural based with dense, homogeneous enhancement


  • Isointense to hypointense on T1


  • Isointense to hyperintense on T2


Anatomic predilection in order of frequency


  • Parasagittal


  • Convexity


  • Sphenoid ridge


  • Cerebellopontine angle


  • Olfactory groove


Can elicit a bony reaction leading to hyperostosis of the overlying calvarium


Calcification occurs in approximately 20% of cases.


None


Gliomas


  • 30% of all primary brain tumors


  • Average age of diagnosis:


    • Glioblastoma: 65 yr


    • Anaplastic astrocytoma: 50 yr


    • Oligodendroglioma: 40 yr


    • Anaplastic astrocytoma usually evolves from a lower grade astrocytoma.


Glioblastoma (GBM)


  • Causes extensive edema in the deep white matter


  • Enhances with gadolinium


  • Central areas of necrosis restrict on DWI (bright)


  • May have satellite lesions


  • Tumor often crosses the corpus callosum and anterior commissure.


  • MR spectroscopy: Cho/NAA ratio >2.2 is thought to be high grade.


Anaplastic astrocytoma


  • Some contrast enhancement but no necrosis


Oligodendroglioma


  • 40%-80% rate of calcification


  • Enhances in 50%-70%


  • Hemorrhage or cyst formation occurs in 20%.


  • Usually, there is little edema.


Order lower extremity Doppler in patients with GBM. Ultimately, up to 25% of these patients suffer from venous thromboembolism during the first year of diagnosis.


Pituitary adenoma


10% of all primary brain tumors


Classified as secretory (75%) and nonsecretory (25%)


Prolactinoma


  • Amenorrhea


  • Galactorrhea


  • Gynecomastia


  • Erectile dysfunction or impotence


  • Infertility


  • Decrease in body hair


Growth-hormone-producing tumor:


  • Gigantism


  • Acromegaly


Adrenocorticotropic hormone (ACTH)-producing tumors


  • Cushing syndrome


Thyroid-stimulating hormone (TSH)-producing tumors:


  • Primary hyperthyroidism


  • Tends to be hypodense on CT


  • Microadenomas are generally hypointense on T1 and variable intensity on T2.


  • Adenomas do not enhance as much, and enhance later, than normal pituitary tissue. Dynamic contrast-enhanced MRI scans are best of delineate adenomas.


  • Macroadenoma are adenomas >10 mm. They have a propensity for hemorrhage and infarction (pituitary apoplexy).


  • Differential diagnosis:


    • Rathke cyst: hyperintense on T1 and does not enhance


    • Craniopharyngioma: has cystic lesions and calcifications


Pituitary hormone panel


  • Prolactin


  • FSH


  • LH


Serum and 24-h urine cortisol levels


TSH and T3/T4 levels


Growth hormone


Formal visual field testing and ophthalmologic evaluation are critical.


Serum prolactin >200 µg/L with an adenoma >10 mm in size is diagnostic of a prolactinoma.


Primary central nervous system lymphoma (PCNSL)


  • Causes <5% of all primary brain tumors


  • Immunocompromised state (e.g., HIV, transplant) is a major risk factor.


  • Among immunocompetent patients, the mean age of onset is 60 yr and there is a slight male predominance.


Tends to be hypodense on CT


MRI features


  • T1 hypointense and T2 hyperintense


  • DWI shows diffusion restriction (bright)


Anatomic predilection


  • Periventricular white matter in 40%


  • Coating of ventricles in 40%


  • Deep gray matter nuclei/subcortical in 30%


  • Unusual multifocal distribution of tumor can occur.


Diffusely enhancing in the immunocompetent patients; necrotic center can occur in immunocompromised patients.


Spread across corpus callosum is suggestive of PCNSL.


Masses tend to be <2 cm in patients with AIDS and >2 cm in non-AIDS patients.


Slit lamp examination reveals intraocular involvement in 15% of patients.


CSF, cerebrospinal fluid; FLAIR, fluid-attenuated inversion recovery; MR, magnetic resonance; SWI, susceptibility-weighted imaging; CT, computed tomography; MRI, magnetic resonance imaging; FDG-PET, 18F-fluorodeoxyglucose positron emission tomography; DWI, diffusion-weighted imaging; FSH, follicle-stimulating hormone; LH, luteinizing hormone.


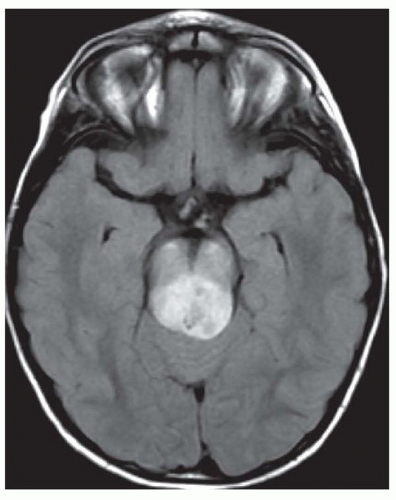
FIGURE 17.8 Pilocytic astrocytoma with high signal intensity on FLAIR imaging invading the midbrain.


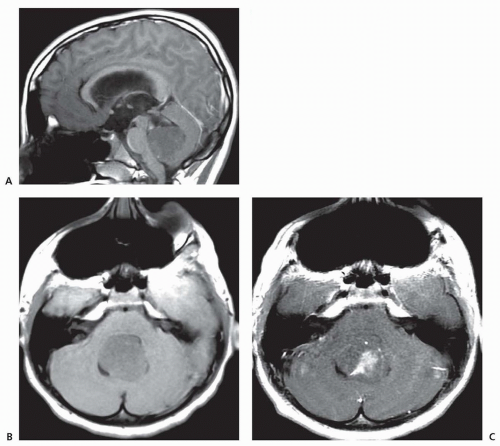
FIGURE 17.9 Medulloblastoma with distortion of the fourth ventricle and secondary hydrocephalus. A and B: Hypointense on T1. C: Moderate partial gadolinium enhancement.


CEREBRITIS AND ABSCESSES

Approximately 1,500 cases of brain abscess occur annually in the United States with an incidence of 0.3 to 1.3 cases per 100,000 of the population annually. Brain abscess (see Chapter 62) is most commonly caused by bacterial infection (Fig. 17.10), most commonly streptococci and staphylococci. Focal brain infection resulting in cerebritis or abscess can also be caused by fungi (Table 17.3). Among fungal infections, aspergillosis (Fig. 17.11), cryptococcosis (Fig. 17.12), candida, mucormycosis, and nocardia are most common in immunosuppressed patients. Blastomyces, Histoplasmosis, and


Coccidioides are most common in immunocompetent patients. The most common parasitic organisms that causes brain abscess are by far toxoplasmosis (Fig. 17.13) and cysticercosis (Fig. 17.14), although Strongyloides and Entamoeba histolytica are also common causes (see Chapter 65). Tuberculosis forms solid tuberculomas; after the caseous core liquefies, the tuberculoma becomes a tuberculous abscess (see Chapter 64). Syphilis can form gummas, cysticercosis can cause an inflammatory mass lesion when the cyst degenerates and dies, and viruses such as herpes simplex 1 (see Chapter 66) can cause encephalitis complicated by acute swelling and inflammation of the affected temporal lobes (Fig. 17.15).

Only gold members can continue reading. Log In or Register to continue

Stay updated, free articles. Join our Telegram channel

Jul 27, 2016 | Posted by in NEUROLOGY | Comments Off on Focal Mass Lesions

Full access? Get Clinical Tree

Get Clinical Tree app for offline access