Ictal Electroencephalogram
Michael R. Sperling
Robert R. Clancy
Introduction
This chapter reviews the electroencephalographic features of seizures. The electroencephalogram (EEG) is an indispensable tool for studying seizures and is often the only means by which a diagnosis of epilepsy can be unequivocally established or seizures accurately classified. It supplies unique information about seizures that is not provided by any other physiologic method. Depending on the EEG technique, the spatial resolution ranges from 1 mm to several centimeters. Its recording characteristics allow the resolution of brief transients lasting a few milliseconds, yet comfortably allow the examination of events like seizures that last for minutes or hours.
Several questions about seizures can be answered using the EEG. The EEG verifies that the event in question is an epileptic seizure and not something else. It helps to classify the type of seizure, defining whether it is partial or generalized. Often, the EEG helps to pinpoint where seizures arise in the brain. The frequency of seizure occurrence and the effectiveness of therapy can be gauged with EEG.
This chapter first discusses the rationale and methods for recording seizures, then illustrates and describes the types of seizures seen in neonates, children, and adults. The EEGs shown here have mainly been recorded with scalp electrodes because seizures recorded with intracranial electrodes are amply illustrated in a subsequent chapter.
Rationale for Recording Seizures
Differential Diagnosis
There are many types of episodic events (see Chapter 68). Some are seizures, whereas others might be pseudoseizures, syncope, paroxysmal movement disorders, transient ischemic attacks, night terrors, somnambulism, narcolepsy, fugue states, or transient global amnesias, among others.23 Although the medical history often helps to establish the diagnosis, it is not always adequate for the task. The history at times is misleading, and data must be obtained from other sources to arrive at a diagnosis. Ultimately, one can be confident of the diagnosis only when the episode is witnessed and physiologic recordings are made. Interpretation of the EEG recording is generally enhanced by simultaneous analysis of the behaviors that occur during the spell, although that is not always necessary.
Because seizures are characterized by paroxysmal changes of the brain’s electrical activity, the diagnosis of a seizure can be confirmed with certainty by demonstrating those changes during the event in question. Seizures that produce impairment in consciousness or bilateral movements such as tonic–clonic seizures, tonic seizures, and complex partial seizures nearly always appear in the scalp EEG. However, there are certain circumstances in which the electrical signature of a seizure is not seen in the scalp EEG, even if a seizure has occurred:
During some seizures, the brain’s electrical activity may be completely obscured by muscle and movement artifact. Whereas this sometimes prevents physicians from reaching a firm conclusion, the diagnosis of an epileptic seizure can still be offered if the pattern of muscular contractions is stereotyped (as in tonic–clonic seizures) or if it is followed by postictal slowing of EEG frequencies.
The scalp EEG usually does not show ictal discharges during simple partial seizures because of their restricted potential fields.21,69 Whereas this is especially true of simple partial seizures arising in medial, basal, and interhemispheric cortex, this is often true of convexity simple partial seizures as well. Even when simple partial seizures produce bilateral movements (e.g., supplementary motor seizures), a scalp EEG correlate is often lacking.
The scalp EEG, on rare occasion, also fails to detect ictal discharges during complex partial seizures, particularly when they originate in a frontal lobe.38,78 Intracranial EEG generally eliminates these problems, and with adequate spatial sampling, seizures should appear in the EEG recorded by electrodes directly in contact with the cortex from which the seizures originate.
Occasionally, it is useful simultaneously to record other physiologic parameters along with the EEG when trying to diagnose episodic events. For example, the electrocardiogram (ECG) may reveal a primary cardiac rhythm disturbance, which then secondarily produces changes in the EEG. Blood pressure, muscle, and eye movement can also be studied if they might be helpful. Finally, the events in question can be provoked to help arrive at the diagnosis. For example, suggestion can be used to elicit a pseudoseizure while simultaneously recording the EEG, or tilt-table testing might reproduce vasodepressor syncope.
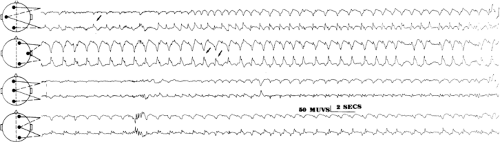 FIGURE 1. Neonatal seizure. This electroencephalogram was recorded from a 1-day-old, full-term infant boy who showed an acute neonatal encephalopathy, including seizures after a placental abruption. Two ongoing, independent electrographic neonatal seizures are apparent in the temporal-central regions (see text for details). The calibration mark in this and subsequent neonatal rhythm strips is 7 μV/mm and 2 seconds. |
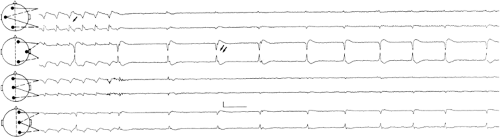 FIGURE 2. Neonatal seizure. This electroencephalogram was recorded from the same patient as in FIGURE 1, at a slightly later time. The very end of an electrographic neonatal seizure appears at T3, and periodic lateralized epileptiform discharges recur invariantly at T4-C4 (see text for details). |
Case Report
A 19-year-old woman had a history of absence seizures since the age of 12 years. They had never been completely controlled and, at the time of her latest evaluation, occurred three to four times daily. They came without warning and had no postictal confusional state, and she believed that they lasted between 10 and 20 seconds. She had taken ethosuximide (Zarontin) for the previous 7 years. She had normal developmental milestones and intelligence, and was a college student at a prestigious university at the time of her evaluation. Her medical history was significant only for well-controlled asthma, and no one in the family had a history of seizures. The neurologic examination was entirely normal. Her interictal EEG showed brief, 3- to 4-Hz generalized spike-and-wave bursts, mainly in light stages of sleep.
A decision was made to try to stop the seizures because of her dissatisfaction with her condition. First, the dose of ethosuximide was increased without benefit. She next tried valproic acid (Depakene) alone, then a combination of ethosuximide and valproic acid, then valproic acid and methsuximide (Celontin), then valproic acid and acetazolamide (Diamox), then valproic acid and clonazepam (Klonopin), and then trimethadione. With each drug or combination, she complained of persistent seizures and often had sedation, tremor, or some other side effect. Midway in the course of adjusting her medication, another EEG was obtained. This again showed interictal generalized spike-and-wave discharges.
Because therapy had failed, she had continuous EEG recording to study the seizures. During a 4-hour morning session, she complained of two absence seizures. Although she appeared briefly to stare, the EEG remained normal. She was informed that her seizures were not epileptic in nature, and psychogenic seizures were diagnosed. Ethosuximide was restarted and psychotherapy begun. Her complaints of seizures stopped, and she had no further complaints of seizures for the next 4 years of follow-up. After the seizures resolved, her asthma became more severe, requiring several hospitalizations in the next few years.
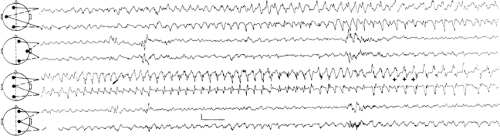 FIGURE 3. Neonatal seizure. This electroencephalogram was recorded from a comatose, 1-day-old, full-term infant boy who was being treated by extracorporeal membrane oxygenation for severe respiratory distress syndrome due to meconium aspiration syndrome and perinatal asphyxia (see text for details.) |
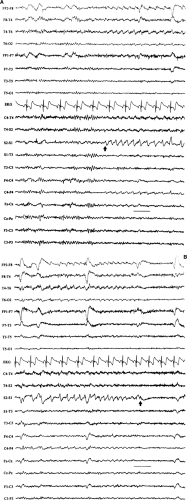 FIGURE 4. Simple partial seizure of right temporal lobe origin. A: The record begins with the patient awake, with eye blinks and frontalis muscle artifact. Midway through the page, rhythmic sharp waves appear in the right temporal region at approximately 3 Hz. In the anterior to posterior chain (channels 1–4), they phase-reverse at F8 (between channels 1 and 2). In the transverse chain, the phase reversal is less well defined, although it is apparent between channels 10 (C4-T4) and 12 (S2-S1). The sharp waves progressively increase in amplitude while simultaneously diminishing in frequency. When they appear, a bilateral desynchronization and attenuation of the alpha rhythm are seen, probably related to arousal. B: As the seizure continues, the sharp waves evolve in frequency and amplitude while the spatial extent of the field remains relatively constant. The discharge increases in frequency in the 5 seconds prior to seizure termination (arrow). The ictal activity does not spread to the contralateral hemisphere, and the patient remains conscious and in full contact during the entire seizure. Note the subtle increase in heart rate during the course of the seizure, due to either hypothalamic activation or heightened arousal. Although this patient felt this aura midway through the surface electroencephalographic (EEG) manifestation, awareness may precede, coincide, or follow its scalp EEG appearance in others. (Note: bar = 1 second in this and all subsequent figures.) |
 FIGURE 5. Complex partial seizure of right temporal lobe origin. A: This sequence illustrates a typical complex partial seizure of temporal lobe origin. The seizure begins with rhythmic 8- to 8.5-Hz sharp waves in the right basal temporal region, with a crisp right sphenoidal phase reversal (arrow). Because of the steep field gradient between T4, S2, and S1, the activity is best seen in the transverse chain. The same activity, although much reduced in amplitude, is seen in the anterior-to-posterior chain as well (channels 1–4), and it becomes clearer toward the end of this page. Note the progressive increase in amplitude of the sharp waves as the seizure continues. There is a subtle increase in the amount and rhythm of the theta- and alpha-frequency waves in the left hemisphere leads at the same time. This probably reflects invasion of the ictal discharge in that hemisphere. B: The seizure continues (arrow) with a gradual slowing of the sharp wave frequency, seen best in T4-S2 and S2-S1. In the anterior-to-posterior chain, the rhythmic sharp waves phase-reverse between channels 1 and 3 or 1 and 2 as the field varies, which is characteristic of mesial temporal lobe seizures. The ictal activity in the left hemisphere is subtle compared with the right, but rhythmic alpha-frequency waves are present that were not seen in the interictal state. C: On this page, the right sphenoidal sharp waves vary more in amplitude and frequency (arrow), and semirhythmic delta activity becomes prominent in the right hemisphere, although it is noted in the left-sided derivations also. D: The rhythmic sharp waves stop early in this page (arrow), marking the end of the seizure. Immediately afterward, lateralized postictal slowing, consisting of prominent delta activity in the right temporal region, appears. This last page also illustrates how physiologic artifact from eye blinks and muscle contraction help to diagnose a seizure and to characterize the behavior. This last page contains at least eight eye blinks in 7 seconds after the seizure stopped. In contrast, no eye blinks are seen on the first two pages once ictal activity appears, and only two blinks are seen in panel C. This lack of blinking correlates with a motionless stare, noted during some complex partial seizures. The high-frequency activity in channels containing the right temporal leads (F8, T4, T6, S2) is muscle artifact, which reappeared immediately after seizure cessation. It had been present before the seizure early in panel A and disappeared once the seizure began. Hence, the seizure produced a decrease in muscle tone, further confirming concomitant behavioral change, had no observer been present. |
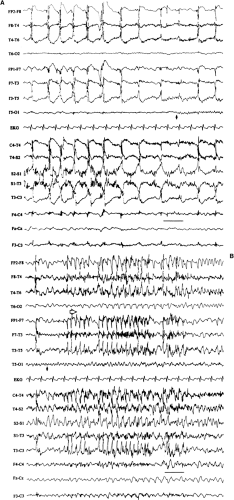 FIGURE 6. Left occipital complex partial seizure. A: This seizure begins with low-amplitude 9-Hz waves (arrow). The patient was eating prior to seizure onset, and the record shows muscle artifact caused by chewing. B: The seizure continues with an occipital alpha-frequency discharge (small arrow). Several seconds after the start of the page (large arrow), higher-amplitude sharp waves appear in the temporal regions, with mid- to anterior temporal phase reversal. This represents anterior spread of the seizure and the development of an independent ictal discharge in the temporal lobes at a different frequency from that of the occipital lobe. |
This case illustrates the usefulness of EEG recording to clarify a diagnosis. In retrospect, it would have been prudent to perform EEG recording of her seizures much earlier. Her physician was swayed by the abnormal interictal EEG, and, in all likelihood, she did have epilepsy at one time and may still have had a tendency for seizures. Arriving at a diagnosis of pseudoseizures allowed for institution of appropriate therapy.37 The subsequent worsening of the asthma reveals the need for illness that motivated the complaints of absence seizures, and it may be suggested that ongoing psychotherapy is required.
Classification
Once seizures are diagnosed with certainty, the type of seizure should be determined. The classification of seizures and the epilepsies is reviewed elsewhere, and here it suffices to remind the reader that seizures typically fall into one of two categories—generalized or partial. Generalized seizures begin more or less simultaneously throughout the cortex, whereas partial seizures begin focally and spread to a variable extent. This distinction is important because it helps to determine which of the epilepsy syndromes a particular patient has, influences the choice of medication, and ultimately affects prognosis. The history and interictal EEG usually suffice for reasonable diagnostic confidence. However, should a patient fail to respond to therapy or experience adverse side effects to a number of medications, recording of seizures with EEG not only can confirm the diagnosis of epilepsy, but it also can establish the classification to ensure that appropriate therapy is prescribed. EEG recording, particularly when behavior is studied, greatly furthers this aim.
Generalized seizures begin with a number of character-istic patterns that are apparent in the scalp EEG: Typically, generalized spike-and-wave discharges (e.g., absence or tonic–clonic seizures), generalized paroxysmal fast activity (e.g., tonic seizures), a diffuse electrodecremental response (e.g., atonic seizures), or a generalized frontally predominant slow wave (e.g., atonic seizures). Because partial seizures begin focally, one
might reasonably assume that the EEG shows a focal onset in a frequency domain when they begin. This often happens and, in theory, should always be present. However, technical limitations in recording methods make demonstration of a focal seizure onset either impractical or unattainable. Some seizures spread so quickly—within a few milliseconds—that localized onset cannot be demonstrated, despite the best of modern technology. Other seizures begin in “buried cortex,” that is, cortex hidden from the recording electrodes. These seizures are detected only once they have spread elsewhere in the brain, and the propagation may be so diffuse that a focal start cannot be seen. Fortunately, the EEG patterns of partial seizures
usually differ sufficiently from those of generalized seizures that they are diagnosed with reasonable confidence, even though a focal onset is not seen. Nevertheless, there still remain some occasions when seizures cannot be definitively classified.
Case Report
A 22-year-old man complained of seizures that began at the age of 15 years. He had a prior history of an uncomplicated febrile convulsion. His seizures began with a feeling of lightheadedness lasting several seconds, and then he became unresponsive and motionless for approximately 20 seconds. He had been treated unsuccessfully with phenytoin (Dilantin) since his seizures began and still had several per month. No one in his family had a history of seizures. Neurologic examination was normal, and an interictal EEG was normal.
The phenytoin was discontinued and carbamazepine (Atretol, Tegretol) was begun. The seizures continued unabated, perhaps slightly increased in frequency. Another interictal EEG was normal. Because of nausea at higher doses, the carbamazepine was stopped and phenobarbital (Arco-Lase, Bellergal-S, Donnatal, Quadrinal, Mudrane, Rexatal, Solfoton) was begun. The seizures continued.
He then had continuous EEG recording to capture seizures. During one of his typical seizures, the EEG showed a prolonged run of generalized, 4- to 5-Hz spike-and-wave discharges. Valproic acid was then begun, and his seizures stopped.
This case illustrates how ictal recording, by classifying seizures, can help. Once it was realized that this patient had generalized epilepsy, appropriate medical therapy could then be used successfully to treat the seizures.
Localization
There are two reasons to localize seizures. The first reason is scientific. By directly studying seizures and characterizing how they begin, spread, and end, one can better understand epilepsy. Planning for epilepsy surgery provides the main clinical reason to localize seizures. If a surgical procedure is planned, it is first necessary to establish whether all seizures come from one region and, if so, to identify the specific region of cortex that gives rise to the seizures. Whereas evaluation for epilepsy surgery involves performing a variety of tests, recording seizures with
either scalp or intracranial EEG still offers the most direct means of identifying the tissue to be resected. Seizures can be localized either with scalp (extracranial) electrodes or with intracranial electrodes. It is important to recall that both extracranial and intracranial EEG can be misleading with regard to localization. Just as partial seizures might not appear to be localized in some EEG recordings or might not appear at all (as discussed previously), a “clear-cut” localization can at times be misleading if the propagation of an ictal discharge is seen first, rather than its initiation. For example, a seizure might start in the occipital lobe but spread rapidly to the temporal lobe and falsely appear to begin in the temporal lobe in the scalp EEG.
either scalp or intracranial EEG still offers the most direct means of identifying the tissue to be resected. Seizures can be localized either with scalp (extracranial) electrodes or with intracranial electrodes. It is important to recall that both extracranial and intracranial EEG can be misleading with regard to localization. Just as partial seizures might not appear to be localized in some EEG recordings or might not appear at all (as discussed previously), a “clear-cut” localization can at times be misleading if the propagation of an ictal discharge is seen first, rather than its initiation. For example, a seizure might start in the occipital lobe but spread rapidly to the temporal lobe and falsely appear to begin in the temporal lobe in the scalp EEG.
Quantification
The last of the major clinical reasons to record seizures is to quantify their rate of occurrence. Many people do not know when they have had a seizure or how often they occur. A prolonged recording session can define how often seizures occur, thereby providing a gauge of the effectiveness of therapy. For example, absence seizures may occur dozens of times per day in small children, and a 24-hour recording can establish whether medication levels are sufficient. Examination can be made of the relationships between seizure occurrence and the time of day or month, the different stages of sleep, and medication levels, among other factors.
Methods for Recording Seizures
Electrodes
Extracranial Electrodes
Most types of EEG electrodes that are employed for interictal EEG recording are also suitable for recording seizures. The only requirements are that the electrodes be suitably placed to detect the electrical activity of the brain and that they be reasonably secured so that they do not fall off or move too much during a seizure. The electrodes most often used for extracranial recording are attached to the scalp (placed in the 10/20 system, its intermediate placements, or more inferiorly).61 Collodion should be used to maintain optimal contact and minimize movement. Sphenoidal electrodes are inserted medially beneath the zygoma to record from basal temporal structures67 and are sometimes useful for detecting basal temporal lobe spikes and localizing temporal lobe seizures.57 Nasopharyngeal electrodes are too unstable to use for recording seizures. Extracranial electrodes are subject to significant limitations. These include limited spatial resolution and inability to detect activity from deep cortex (such as basal cortex, including basal orbitofrontal, temporal, and occipital
cortex; interhemispheric cortex; and activity within the depths of sulci).
cortex; interhemispheric cortex; and activity within the depths of sulci).
In addition, EEG electrodes record some physiologic artifacts that may sometimes aid in diagnosis. These include characteristic patterns of muscular contraction, changes in heart rate, and alteration in eye blinking. For example, whereas the muscle artifact of a tonic–clonic seizure may completely obscure the EEG, the pattern of muscular contractions is so stereotyped that the EEG is diagnostic. Subtle increases or decreases in tonic muscle activity help to establish whether electrographic seizures have an associated subtle change in behavior. The cessation of eye blinking often heralds the onset of many temporal lobe complex partial seizures; this observation is readily made in the EEG. Most seizures induce an increase in heart rate, sometimes even before the seizure produces a conscious response, and this is often recorded in the EEG.
Intracranial Electrodes
These are used to localize the source of seizures when noninvasive methods are inadequate.27,40 They lack many of the limitations of scalp and other extracranial electrodes and are discussed at length in a separate chapter. Briefly, they include electrodes that can overlie the dura, known as extradural electrodes; electrodes that overlie the pia and are beneath the dura, known as subdural electrodes; and electrodes that enter the substance of the brain, known as intracortical or depth electrodes. Electrodes may also be inserted through the foramen ovale to record from the mesial temporal lobe from an epidural location. They are more sensitive to small field potentials than with scalp EEG and serve to localize seizures when noninvasively obtained data are inadequate. They may often show a well-localized seizure onset, even when scalp EEG recording is nonlateralizing.40 A more complete discussion can be found in Chapter 171.
Other Electrodes
Electrocardiography (ECG) recording is usually done along with EEG. At times, an electromyogram (EMG) may be recorded, using surface electrodes glued to the skin. These help to define artifacts in the recording environment and so assist in interpreting the EEG.
Electroencephalographic Recording
The EEG should be recorded using standard filter settings (low-frequency filter, 1.0–1.6 Hz, and high-frequency filter, 70 Hz). If excessive movement is present, the low-filter settings can be increased to reduce sway; reducing the high-frequency filters rarely clarifies the situation. Montages should incorporate at least 16 channels and should include bipolar montage configurations in anterior-to-posterior and transverse directions (at times, referential montages are useful supplements). Paper records should be displayed at 30 mm/s. When digitally recording the EEG, the sample rate should be at least 200 Hz.
Seizures can be recorded in the EEG in a routine laboratory setting, on an outpatient ambulatory basis, or in an inpatient unit. Routine laboratory recording allows for behavioral
testing but suffers from technical and time constraints. Ambulatory recording eliminates the time limitations, but video is not available, and technical problems are not immediately remediable. An inpatient unit permits the most comprehensive and technically satisfactory recording, although at greater expense than the other methods. Automatic spike and seizure detection programs employed during long-term monitoring reduce the amount of EEG that must be directly reviewed by the electrophysiologist and, therefore, are useful means of performing data reduction while simultaneously enhancing detection capabilities.
testing but suffers from technical and time constraints. Ambulatory recording eliminates the time limitations, but video is not available, and technical problems are not immediately remediable. An inpatient unit permits the most comprehensive and technically satisfactory recording, although at greater expense than the other methods. Automatic spike and seizure detection programs employed during long-term monitoring reduce the amount of EEG that must be directly reviewed by the electrophysiologist and, therefore, are useful means of performing data reduction while simultaneously enhancing detection capabilities.
 FIGURE 7. Frontal lobe complex partial seizure. A: This page immediately precedes seizure onset. Frequent interictal sharp waves are present at F4, C4, and F3. These wane in the last 2 seconds of this page. B: The sharp waves are replaced by irregular theta and delta discharges in the first several seconds of this page. In the last few seconds, an obvious ictal discharge consisting of rhythmic 9- to 10-Hz sharp waves appears (arrow), maximal at F4, suggesting right frontal localization. C: The seizure continues, but no definite ictal discharge is seen in the electroencephalogram. Toward the end of this page, high-amplitude rhythmic delta discharge appears. This is accompanied by a notable increase in tonic muscle artifact, indicating a behavioral change. D: The seizure continues with rhythmic theta- and delta-frequency activity. Contractions of the temporalis muscles show as phasic muscle artifact in the latter portion of the page. |
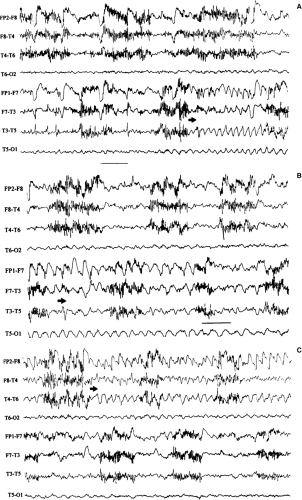 FIGURE 8. “Ping-pong” complex partial seizure of temporal lobe origin. A: The seizure begins with rhythmic theta-frequency activity in the left temporal derivations (arrow). B: The seizure continues with rhythmic theta and delta activity in the left temporal region, which diminishes toward the end of this page. C: The left temporal ictal discharge has stopped. However, rhythmic 3- to 4-Hz waves develop in the right temporal region as the seizure continues in that lobe, despite having ceased in the temporal lobe of origin. |
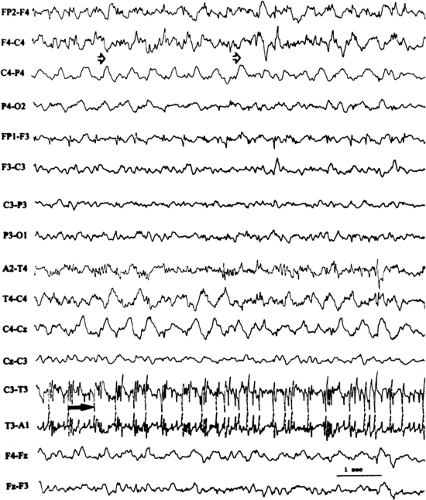 FIGURE 9. Electroencephalogram (EEG) of epilepsia partialis continua. The channels containing T3 show irregular muscle twitch artifact (solid arrow). Nonevolving semirhythmic delta activity that phase-reverses at C4 (hollow arrows) is the electrographic feature of this seizure. Note the lack of relationship between twitch rate and EEG frequency. |
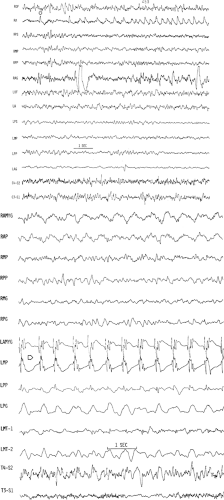 FIGURE 10. Seizure onset demonstrated with intracranial electroencephalogram. A: A discrete (focal) seizure onset is seen in the right amygdala (arrow). The seizure begins with rhythmic triangular sharp waves that are confined to the amygdala. B: This regional onset seizure contrasts with the previous seizure in that a more widespread onset is seen in both amygdala and hippocampus. Rhythmic spiking (arrow) is seen in electrodes recording from amygdala and mid pes hippocampus, with some reflection of the spikes in the posterior pes electrode and reflection of the slow wave in the parahippocampal gyrus. AMYG, amygdala; AP, anterior pes hippocampus; L, left; MG, mid parahippocampus gyrus; MP, mid pes hippocampus; MT, middle temporal gyrus; PG, posterior parahippocampus gyrus; PP, posterior pes hippocampus; R, right. |
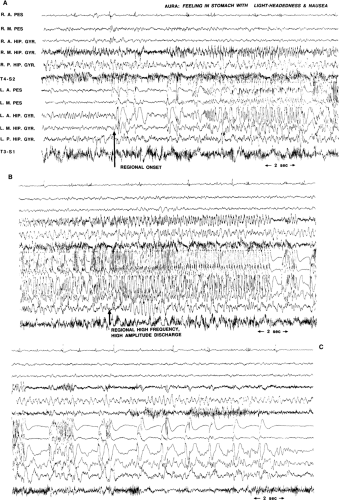 FIGURE 11. Mesial temporal simple partial seizure recorded with intracranial electrodes. A: The seizure begins with regional high-amplitude spiking (arrow) for several seconds. This is followed by the development of regional fast activity in the latter portion of the page. B: The regional discharge progressively slows in frequency while increasing in amplitude. The extracranial channel (bottom channel) shows a rhythmic pattern, although the fast spiking present in the depth electrodes cannot be seen. Toward the end of the page, the discharge is interrupted by transient suppressions. The seizure does not spread to the contralateral hemisphere but remains confined to the left mesial temporal lobe. C: The pattern of ictal fast activity and suppression continues initially, although the fast activity is then replaced by spikes. The seizure ends with flattening in the anterior mesial channels. A. HIP. GYR., anterior hippocampus gyrus; A. PES, anterior pes hippocampus; L, left; M. HIP. GYR., mid hippocampus gyrus; M. PES, mid pes hippocampus; P. HYP. GYR., posterior hippocampus gyrus; R., right. |
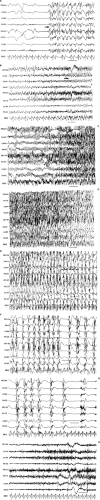 FIGURE 12. Generalized tonic–clonic seizure. A: The seizure begins with a generalized spike-and-wave burst (arrow) that is replaced by polyspike and wave. B: The polyspike and wave is succeeded by generalized continuous fast activity, which is the start of the tonic phase of the seizure. The latter half of this page begins to show tonic muscle artifact indicative of a generalized increase in continuous muscle contraction. C: The fast activity, at 8 to 10 Hz, continues with progressive increase in muscle artifact. D: During this segment, the tonic phase continues. The electroencephalogram cannot be seen because it is completely obscured by muscle artifact. Slow waves start to appear in the last second of this page, heralding the onset of the clonic phase. E: The clonic phase now predominates. Bursts of muscle contractions are interrupted by pauses (coexistent with the slow wave), with a gradual diminution of the frequency of muscle contractions. F: The clonic phase shows increasing intervals between contractions, with occasional long pauses between jerks. G: The clonus becomes less frequent, and suppressions of increasing duration are seen. H: The seizure is now mostly ended. This page shows a mild tonic phase that lasted 30 to 40 seconds in this patient. This subtle tonic phase typically follows tonic–clonic seizures and is succeeded by loss of muscle artifact and profound background amplitude attenuation and slowing. |
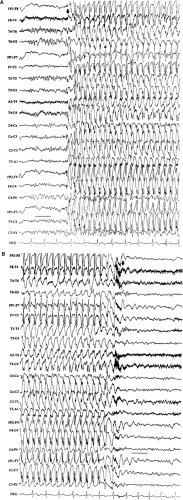 FIGURE 13. Absence seizure. A: This absence seizure begins abruptly with a generalized spike-and-wave discharge at 3.5 Hz (arrow). The discharge continues with a slight diminution in frequency. B: As the seizure continues, the frequency of the discharge gradually slows, and the seizure terminates with a series of slow waves (arrow), seen best in the channels in the lower half of the page. |
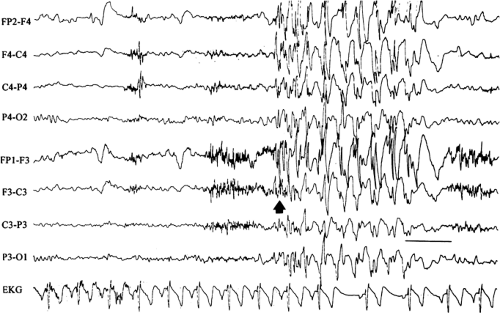 FIGURE 14. Atypical absence seizure. This brief seizure begins with a burst of generalized polyspikes (arrow) that are interrupted at irregular intervals by slow waves. This seizure lacks the regularity of the preceding absence seizure (Fig. 11), with its machine-like spike-and-wave repetition rate. |
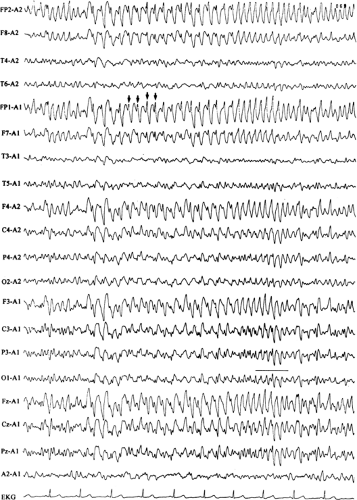 FIGURE 15. Continuous spike-and-wave state (absence status; spike-wave stupor). Spike-and-wave discharges at 4 Hz occupy part of this page (arrows highlight the spikes), whereas rhythmic theta at approximately 5 Hz predominates at other times. |
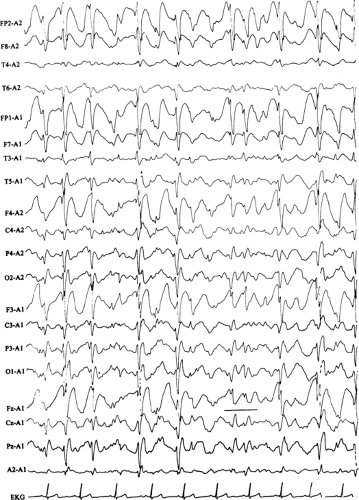 FIGURE 16. Interictal electroencephalogram from a patient with symptomatic generalized epilepsy. This shows high-amplitude generalized slow spike-and-wave discharges arrhythmically and at 1.25 to 2.0 Hz superimposed on a diffusely slow background. |
Limitations of Electroencephalographic Recording
Seizures often produce abnormal movements such as blinking, chewing, jerking, and stiffening, among others. These movements can obscure portions of the EEG recording and sometimes may render an EEG uninterpretable. Scalp EEG suffers from other limitations. When recording from scalp electrodes, the EEG signal is filtered variably, depending on frequency (fast frequencies are attenuated more than slow frequencies); spatial signal averaging takes place; volume conduction occurs; and signals from perpendicularly oriented superficial cortex predominate.52 To be visible with scalp electrodes, a large volume of cortex must display synchronized activity. The scalp and skull serve as spatial averagers, further hindering EEG interpretation. In addition, deep cortex (e.g., interhemispheric, basal frontal, temporal, and occipital cortex) is often too distant for scalp electrode detection of potentials. Finally, the orientation of the dipole in EEG is critical, so that only orthogonally oriented potentials are visible.52 Consequently, the standard scalp EEG may record from as little as one third of the cortex. For all of these reasons, many EEG events, including some interictal discharges and seizures, do not appear in the scalp EEG.
Using intracranial EEG eliminates muscle and movement artifact, but these electrodes suffer from “tunnel vision.” They record from a limited amount of cortex, and the electrode placement biases the results.27 For example, a seizure can be localized only to the cortex in which electrodes have been placed; because it is impossible to put electrodes everywhere, mislocalization must occasionally occur.
Enhancing Seizure Occurrence
Because seizures usually occur infrequently and unpredictably in most people, the EEG must often be recorded for a long time before a seizure occurs. Certain methods can be used to increase the likelihood of seizure recurrence. Stress, either emotional or physical (e.g., sleep deprivation), sometimes helps to
bring on a seizure. Anticonvulsant medication taper more reliably induces seizures, so this is commonly employed. This is safest when reserved for the inpatient setting. It should be performed cautiously to avoid status epilepticus and secondarily generalized seizures.
bring on a seizure. Anticonvulsant medication taper more reliably induces seizures, so this is commonly employed. This is safest when reserved for the inpatient setting. It should be performed cautiously to avoid status epilepticus and secondarily generalized seizures.
Neonatal Seizures
The behaviors and activities of the newborn infant are regulated by a variety of innate neurobiologic mechanisms that govern the natural rhythms of life. Sleeping, waking, feeding, crying, and quiet visual exploration wax and wane as the infant’s biobehavioral state cycles through an orderly progression of predictable state changes that appear and evolve as the nervous system matures from the preterm to the term infant and beyond. Healthy newborn infants possess an inherently modest repertoire of motor activities and behaviors commensurate with their limited maturity. There are also a number of paroxysmal behaviors that the healthy newborn can display, such as tremors, jitteriness, benign apnea-bradycardia, rapid eye movement sleep activities, and startles. These arise suddenly and unexpectedly against the background of the normal unfolding of the activities and behaviors dictated by the infant’s biobehavioral state. Neurologically compromised neonates may also display an assortment of abnormal paroxysmal postures, movements, or behaviors that must be distinguished from their innocent counterparts.
Neonatal seizures are a common phenomenon encountered in the care of the newborn infant.3,15,17,73,74 Historically, neonatal seizures were diagnosed on clinical grounds alone and were classified by their most visually conspicuous features as subtle, clonic, tonic, myoclonic, or autonomic. In more recent times, there has been a growing appreciation of the limitations of diagnosing neonatal seizures on clinical grounds alone and an increased recognition of the role of EEG in confirming and characterizing epileptic-based seizures in the newborn infant.22,36,41,51,74 Specifically, not every clinical “neonatal seizure” is simultaneously accompanied by a coincident electrographic seizure, and, conversely, many electrographic seizures recorded in the newborn arise subclinically.13,18,48,77 Such occult electrographic seizures, those subclinical electrographic seizures unaccompanied by simultaneous clinical seizures, constitute a significant fraction of recorded electrographic seizures.77 Furthermore, there are common circumstances in the newborn nursery in which the use of neuromuscular blocking agents such as pancuronium bromide (Pavulon) renders the patient clinically neurologically unassessable due to the iatrogenic paralysis. EEG examinations performed to provide a measure of neurologic assessment during therapeutic paralysis may capture electrographic seizures that were clinically unexpected.28 Consequently, the electroencephalographer must be familiar with the basic characteristics of the electrographic neonatal seizure (ENS) and alert to their possible presence when reviewing neonatal EEGs performed for any reason.
Related posts:


Stay updated, free articles. Join our Telegram channel

Full access? Get Clinical Tree


