Magnetic Resonance Imaging
Vesselin Zdravkov Miloushev
Angela Lignelli
INTRODUCTION
Magnetic resonance imaging (MRI) is a noninvasive medical imaging technique. The images created by MRI often appear similar to gross-anatomic specimens. The major strength of MRI is the ability to distinguish different soft tissues and identify pathologic abnormalities. It is indispensable to modern neurologic practice for diagnosis, confirmation, and characterization of neurologic conditions, as well as for monitoring response to therapy. Although MRI signal abnormalities can be very sensitive to pathologic processes, in isolation, the findings may lack specificity, requiring thorough integration of clinical information. The main weaknesses of MRI are cost, inherent low signal to noise necessitating high magnetic fields as well as lengthy exam times, and distortion of images by artifacts. The MRI scanner consists of a bore that is generally small and constricting, creating anxiety or claustrophobia in many patients. In addition, implanted devices can be ferromagnetic and therefore contraindicated for MRI imaging, for example, most pacemakers. As in all radiologic procedures, contrast agents should be administered when the benefit of improved diagnostic accuracy outweighs their generally low risk. In the following paragraphs, the physics of MRI and technical considerations will be discussed. In addition, the application of basic imaging sequences and advanced imaging methods will be reviewed.
PHYSICS OF MAGNETIC RESONANCE IMAGING
MRI is based on Fourier transform nuclear spin spectroscopy of water protons. Clinical imaging is performed on the nuclear spin of water protons because water is abundant in biologic tissues and protons have relatively greater sensitivity in a magnetic resonance than other nuclei.
In the classical description relevant for clinical imaging, MRI can be understood by considering the spin properties of protons to be equivalent to small magnetic dipoles that align in a magnetic field. In the quantum mechanical description of proton magnetic resonance, individual proton spins exist as a combination (superposition) of two quantized energy states, transitions between which can be manipulated using radiofrequency pulses and delays. The very large number of water protons leads to behavior of biologic tissues in the magnetic field that can be thought of as net magnetization. This longitudinal magnetization can be tipped from the aligned state by a radiofrequency excitation pulse. The change in angle from the original aligned state is called the flip angle. Once in the transverse plane, the magnetization begins to rotate (precess) around the magnetic field at a specific resonant frequency called the Larmor frequency (˜43 MHz per tesla for protons). This precessional motion in turn generates a time-varying voltage in a receiver coil. The specific resonance frequency depends on the nucleus being imaged, its local environment, and the magnetic field strength.
Relaxation of the signal back to equilibrium is described by the T1 and T2 exponential time constants. Relaxation of magnetization is not a spontaneous process but rather a phenomenon that is due to underlying molecular motion and molecular interactions. The BPP theory of relaxation named after Bloembergen, Purcell, and Pound has proven accurate and permits calculation of relaxation times from first principles. The two principal relaxation mechanisms are termed T1 and T2 processes, which are relevant to clinical imaging and approximately depend on the molecular tumbling rate or rather the rotational diffusion of individual molecules. The T1 time constant describes the recovery of longitudinal magnetization back to the equilibrium aligned state (after a time T1 ˜63% of the magnetization has realigned). The T2 time constant describes the decay of magnetization in the transverse plane (after a time T2 ˜63% of the magnetization has decayed).
IMAGE CREATION
MRI creates images by applying linear spatial magnetic field gradients so that different parts of the human body resonate at different frequencies. One dimension can be sampled directly (called the frequency dimension), whereas other dimensions can be sampled indirectly (called phase dimensions). By combining multiple gradient directions, two-dimensional or three-dimensional images can be constructed.
The MRI signal is composed of time-dependent damped sinusoids and requires Fourier transformation to convert it to a power spectrum that is the image. The term k-space is used to refer to the time-dependent data. This is sometimes a source of confusion because the Fourier transform is very similar to its own inverse and acquisition of time-dependent MRI data in k-space is essentially equivalent to acquisition of different frequency components of the image. For this reason, it is often noted that the center of the k-space image determines image contrast (low-frequency components), whereas the edges of the k-space image determine detail in the image (high-frequency components).
Since the first live human images were obtained in the late 1970s, the field has drastically expanded to include a wide variety of clinical applications. The sequence of radiofrequency pulses, gradient pulses, and intervening time delays used to prepare magnetization and the methods of sampling k-space are referred to as the pulse sequence. Different pulse sequences are also tailored for specific applications. The two basic sequences are gradient echo and spin echo techniques, upon which additional sequences can be derived. Gradient echo sequences refocus magnetization following a radiofrequency pulse using a field gradient, whereas spin echo sequences refocus magnetization using a radiofrequency inversion (180-degree) pulse. Spin echo sequences are generally less susceptible to artifacts because artifacts are also inverted by the refocusing pulse and subsequently cancel out.
CLINICAL MAGNETIC RESONANCE IMAGING SYSTEMS
Clinical imaging systems are rated by the strength of the main magnetic field, referred to the as the B0 field, measured in tesla (1 T = 10,000 gauss ˜15,000-40,000 the earth’s magnetic field). The majority of clinical imaging systems use field strengths of 1.5 or 3 T. The term high field in the context of clinical imaging refers to magnet systems operating at 7 to 9 T. High-field systems have clear benefits in terms of improved anatomic resolution and increased signal to noise but are more prone to artifacts and require more radiofrequency power (higher specific absorption rate). Higher field magnets are typically closed-bore, meaning that they are shaped like long tube or cylinder. A variety of open-bore magnets is also commercially available. These magnets are more accommodating to variations in patient body habitus and typically create a less claustrophobic environment. Completely open-bore magnets operate at lower field strengths than closed-bore systems, with resultant lower resolution that may compromise clinical diagnosis.
Multiple components of the magnetic imaging system influence the ultimate sensitivity in detecting the magnetic resonance signal and generating a distortion-free image. One important physical factor that is changed between different applications is the radiofrequency coil. A variety of receive and transmit/receive coils are available for specific applications to the brain, head, neck, and spine. These include including bird cage-type coils for imaging the brain, surface coils, multichannel, and parallel imaging coils, all of which have different trade-offs in terms of size of allowed imaging volume, as well as sensitivity and speed of imaging.
MAGNETIC RESONANCE IMAGING SAFETY
The main safety considerations in MRI include the powerful main magnetic field, rapidly changing magnetic field gradients, deposition of radiofrequency power, sound pressure levels, and safety concerns related to contrast agents. The powerful magnetic field produced by an MRI scanner is a major safety consideration because objects can become dangerous projectiles when placed in the field. Moreover, non-MRI-compatible implanted devices or metallic foreign bodies pose a danger because of local tissue-heating effects and movement of the object in respect to critical structures. Commonly encountered devices in clinical practice include implanted cardiac devices (e.g., cardiac pacemakers) as well as others such as infusion pumps, cochlear implants, and a variety of surgical implants such as some aneurysm clips. Recently, MRI-compatible cardiac devices have been devised and new MRI-compatible implanted surgical devices are being developed. However, precaution needs to be taken with every implanted device to ensure MRI compatibility and patient safety. Before the patient is even brought near the magnetic field, which is never turned off, a thorough safety check by appropriately trained medical personnel must be performed.
Once inside the MRI scanner, some patients may experience a variety of physical effects in addition to the possibility of claustrophobia. Federal limits on the main magnetic field strength imposed by the U.S. Food and Drug Administration are 8 T for adults and 4 T for neonates. Fields greater than these limits may pose a risk. Limits are also placed on the speed of the rapidly switching magnetic field gradients in MRI due to the possibility of neural or cardiac depolarization resulting in pain, auras, or possibly cardiac arrhythmias. Regulatory limits are also placed on the rate of energy deposition by radiofrequency pulses (similar to limits placed on cell phones for example). This limit is referred to as the specific absorption rate and meant to prevent heating damage of body tissues.
Gadolinium chelates are commonly used contrast agents in MRI because of the local relaxivity effects that lead to T1 shortening and resultant bright signal on T1-weighted images. Other contrast agents including manganese-based contrast agents and superparamagnetic iron oxides are currently less common in clinical practice. The risk of contrast administration in the context of MRI includes contrast reactions that may be life threatening. The deposition of gadolinium in tissues and resulting fibrosis, commonly known as nephrogenic systemic fibrosis (NSF), has been reported in patients with significantly reduced renal function necessitating appropriate screening.
BASIC SEQUENCES
For the purpose of clinical imaging, there are many sources of image contrast. Dynamic processes on the molecular level such as flow-related and diffusion effects and a variety of relaxation mechanisms are responsible for the power of MRI to generate contrast between different biologic tissues.
The basic sequences that are weighted for specific sources of image contrast are as follows:
T1-weighted
T2-weighted
Fluid-attenuated inversion recovery T2-weighted
Diffusion-weighted
Susceptibility-weighted
Post-contrast-enhanced images
T1-WEIGHTED AND T2-WEIGHTED IMAGING
The two core sequences in magnetic resonance are T1-weighted and T2-weighted sequences, which individually emphasize either the T1 or the T2 relaxation time of tissues. T1-weighted imaging emphasizes short T1 relaxation times as bright signal; tissues composed of spins with long T1 relaxation times will appear relatively lower signal intensity (dark) on T1-weighted images. The main clinical use of T1 imaging is to display brain and spinal cord anatomy. However, T1-weighted images are also useful to evaluate for subacute hemorrhage, lipids, paramagnetic metals, or proteinaceous composition of lesions, which all shorten the T1 relaxation time and appear bright on T1-weighted images. T1-weighted images also serve as the baseline comparison to contrast-enhanced images. T1-weighting can be accomplished by either decreasing the repetition time (TR) between successive excitations thus preventing magnetization from fully relaxing to equilibrium or by changing phase of successive radiofrequency pulses thus causing destructive inference (referred to as spoiled gradient echo or SPGR).
The main clinical use of T2 imaging is to display brain and spinal cord pathology, as evidenced by increased tissue water content. T2-weighted images emphasize long T2 relaxation times as a bright signal. Tissues composed of spins with short T2 relaxation times will appear dark on T2-weighted images. However, susceptibility effects resulting in local field inhomogeneities also decrease the T2 time (this type of effect is sometimes referred to as T2 *). T2 weighting can be accomplished by increasing the time the magnetization spends in the transverse plane, or time to echo (TE), prior to acquisition. Different from both T1-weighted and T2-weighted images, proton-density (PD) weighted images are obtained with a short TE to minimize relaxation losses and long TR to allow more magnetization to recover between successive excitations.
Fluid-attenuated inversion recovery (FLAIR) is the preferred sequence for demonstrating subtle brain pathology. FLAIR images are obtained by preparing magnetization with a radiofrequency inversion pulse, which inverts the equilibrium alignment. As the magnetization relaxes back to the aligned state with the T1 time constant, it temporarily becomes negligible as it crosses zero and timing detection at this time can essentially null signal from spins with a specific T1. Although FLAIR sequences can be T1-weighted or T2-weighted, in common clinical parlance, the FLAIR method refers to FLAIR T2-weighted images. The main advantage of FLAIR images is sensitivity to detect a broad array of pathologic processes and is specifically useful for the evaluation of white matter diseases in the brain. The archetypal example is multiple sclerosis, which is characterized by periventricular white matter lesions, radially oriented to the bodies of the lateral ventricles (requiring both axial and sagittal FLAIR sequences for complete assessment) (Fig. 21.1; see Fig. 21.6).
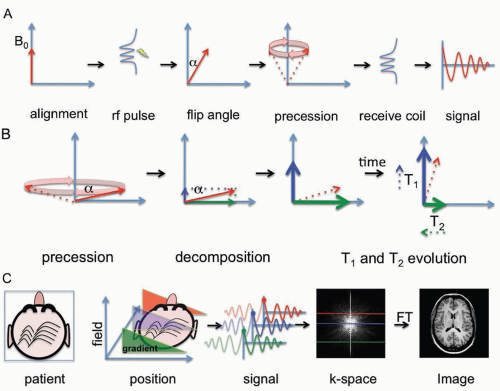 FIGURE 21.1 Schematic representation of magnetic resonance. A: Magnetization (red arrow) aligns along the main magnetic field (B0). A radiofrequency pulse generated by a transmit coil tips the magnetization from the aligned state by a flip angle (α). The magnetization precesses around the main magnetic field. The precessional motion results in a time-varying voltage in a radiofrequency receive coil, which is recorded as the magnetic resonance signal. B: While the magnetization precesses around the magnetic field, the decay of magnetization can be described by two separate exponential time constants. The magnetization vector can be decomposed into a longitudinal component parallel to the main magnetic field and a transverse component orthogonal to the main magnetic field. The T1 time describes the relaxation of magnetization back to the equilibrium-aligned state. The T2 time constant describes the decay of transverse magnetization. C: Images are created in magnetic resonance by applying multiple field gradients, which positionally encode the magnetic resonance signal. In this schematic of a patient’s head, directly acquiring signal from each gradient direction allows encoding of the frequency dimension. Applying an additional increasing orthogonal gradient with every frequency encoding gradient allows encoding of the phase dimension. The signal from one gradient direction thus corresponds to one line of k-space. Once all of the lines of k-space are filled, a Fourier transform (FT) is used to make an image representation. |
Individual tissues have characteristic appearance on T1-weighted, T2-weighted, and FLAIR images. For example, cerebrospinal fluid (CSF) has a relatively long T1 and long T2 relaxation time and thus appears dark on T1-weighted images and bright on T2-weighted images (Fig. 21.2A and B). CSF appears dark on FLAIR images because these images are specifically calibrated to suppress CSF or “free” water (Fig. 21.2C). White matter in the adult is fully myelinated and appears slightly bright on T1-weighted images and dark on T2-weighted images (see Fig. 21.2A and B). Gray matter is brighter than white matter on T2-weighted images, whereas the reverse is true for T1-weighted images. Parenchymal hemorrhage can have a variety of appearances on T1- and T2-weighted images based on its components. In the brain, hemorrhage evolves predictably and its appearance can be used to infer its age. T2 prolongation (bright on T2-weighted images) correlates with hyperacute hemorrhage and late subacute hemorrhage, whereas T1 shortening (bright on T1-weighted images) correlates with early and late subacute hemorrhage. These characteristic appearances are summarized in Table 21.1.
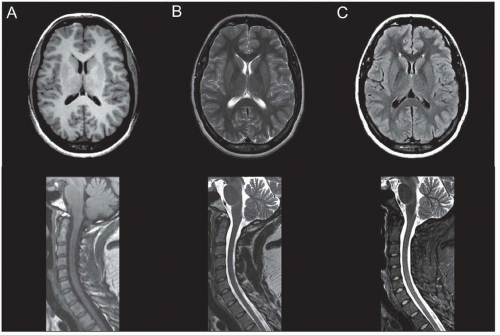 FIGURE 21.2 Normal T1-weighted, T2-weighted, FLAIR, and inversion recovery (IR) images. A: Normal T1-weighted images of the brain and cervical spine. White matter is bright and gray matter is dark. CSF signal is dark. B: Normal T2-weighted images of the brain and cervical spine. Gray matter is bright and white matter is dark. CSF signal is bright. C: Normal FLAIR image of the brain and IR image of the cervical spine. On the FLAIR image, CSF signal is suppressed and appears dark; white matter is dark and gray matter is bright similar to a T2-weighted image. On the IR image of the cervical spine, fat is suppressed and there is increased contrast in the spinal cord. |
QUANTIFICATION OF T1 AND T2 TIMES
T1 and T2 relaxation time constants can be quantified to provide information of dynamic properties on a molecular level. Relaxation can also be measured during the application of a continuous radiofrequency pulse; in this case, the relaxation time constants are referred to as T1-rho and T2-rho (rho referring to a rotating reference frame used in the theoretical description). Magnetization transfer imaging, as well as chemical exchange saturation transfer (CEST) imaging are additional methods that rely on using a radiofrequency pulse to attenuate magnetization. These emerging methods are currently confined to the research setting but hold promise for future clinical applications.
DIFFUSION-WEIGHTED IMAGING
Diffusion-weighted imaging (DWI) is invaluable for the detection of early ischemic brain injury (Fig. 21.3). Like T1 and T2 processes, DWI creates image contrast by exploiting dynamic molecular properties, specifically translational diffusion, by applying multidirection
diffusion sensitizing field gradients. In clinical practice, DWI is typically performed for water although applications to other molecules have been reported. The “effect” of the diffusion gradient sequence is often quantified using a b-value. For adults, a b-value = 1,000 s/mm2 is typically used, whereas b-value = 1,500 s/mm2 is sometimes preferred in pediatric cases. In routine clinical practice, DWI is typically detected using an echo planar imaging (EPI) technique due to the speed of imaging. EPI is a gradient echo technique that can acquire the entirety of k-space within one excitation by interweaving frequency and phase dimensions.
diffusion sensitizing field gradients. In clinical practice, DWI is typically performed for water although applications to other molecules have been reported. The “effect” of the diffusion gradient sequence is often quantified using a b-value. For adults, a b-value = 1,000 s/mm2 is typically used, whereas b-value = 1,500 s/mm2 is sometimes preferred in pediatric cases. In routine clinical practice, DWI is typically detected using an echo planar imaging (EPI) technique due to the speed of imaging. EPI is a gradient echo technique that can acquire the entirety of k-space within one excitation by interweaving frequency and phase dimensions.
TABLE 21.1 Usual Appearance of Normal Structures on T1-Weighted, T2-Weighted, FLAIR, DWI/ADC, and GRE or SWI Images | ||||||||||||||||||||||||||||||||||||||||||
|---|---|---|---|---|---|---|---|---|---|---|---|---|---|---|---|---|---|---|---|---|---|---|---|---|---|---|---|---|---|---|---|---|---|---|---|---|---|---|---|---|---|---|
| ||||||||||||||||||||||||||||||||||||||||||
Diffusion imaging is considered a quantitative technique, permitting the calculation of an apparent diffusion coefficient (ADC), which measures the extent to which the diffusivity of water is restricted from free diffusion, presumably due to structural barriers such as cell membranes or association of water with larger molecules that have lower diffusion coefficients. The most useful application of DWI is in acute stroke imaging (see Fig. 21.3A). This occurs most frequently in the setting of cellular bioenergetic failure and cytotoxic brain edema due to cerebral hypoxia/ischemia. Acute and early subacute infarcts display restricted diffusion and are easily detected as bright regions on DWI. Differentiation of acute infarcts from late subacute infarcts, both of which can appear bright on DWI (known colloquially as T2 shine through), can be accomplished by examination concurrent ADC image. Acute to early subacute infarcts truly demonstrate restricted diffusion and appear dark on the ADC image (see Fig. 21.3B). Subacute to chronic infarcts are bright on DWI due to T2 shine through and appear isointense to bright on the ADC image.
Related posts:

Stay updated, free articles. Join our Telegram channel

Full access? Get Clinical Tree


