The cortical model and the cortical part of the thalamocortical model is inspired by the anatomy of the cerebral cortex with an anatomy and dynamics following the study in [68]. The model preserves important ratios and relative distances found in the mammalian cortex [71]. The ratio of excitatory to inhibitory neurons is 4–1. The radius of local non-myelinated axonal arborisations of an excitatory neuron is 1.5 mm, and the length of the myelinated axon is 12 mm as shown in Fig. 9.1. The long axon is sent to a distant region on the sphere and its collaterals span an area of radius 0.5. Each excitatory neuron innervates 75 randomly chosen local targets and 25 distant targets. The span of local non-myelinated axonal collaterals of an inhibitory neuron is 0.5 mm. Each inhibitory neuron innervates 25 randomly chosen neurons within a circle of radius 0.5 mm. As presented in [68], the axonal conduction velocity is 1 m/s for myelinated axons [72] and 0.15 m/s for non-myelinated collaterals [73].
Thalamic and Reticular Thalamic Network
The relative distribution of thalamic neurons is unknown [68]. It has been observed that there is 350,000 thalamocortical connections per 11,000,000 neurons in layer 4 of the primary visual cortex [74] leading to a ratio of 1/30 [75]. If we assume that each TCR neuron is associated with one fibre, then the distribution of TCR neurons is concluded as a proportion of cortical neurons resulting in 3340 TCR neurons in the thalamic network. The number of reticular thalamic neurons (RTN) is considered equivalent to the number of TCR neurons in the network as modelled in other studies [75–77]. TCR and RTN neurons are randomly allocated on a spherical surface of radius 2 mm.
Thalamic-Reticular Connections
Each TCR neuron selects 13 RTN neurons randomly within an area of radius 0.5 mm. Each RTN cell innervates 25 TCR neurons within an area of radius 0.5 mm and 13 local RTN neurons within an area of radius 0.5 mm. GJ have been observed between RTN neurons in mice and rats without evidence of chemical synapses [78]. Other studies have found chemical synapses among RTN neurons [79–81]. This model includes chemical and electrical synapses in RTN neurons. Hughes & Crunelli [82] have observed only GJ between TCR excitatory neurons. Since none of the studies has confirmed the existence of any chemical synapses among TCR neurons [75, 83], only GJ among TCR neurons are included in the model. According to [82], not all thalamic neurons have GJ, consequently, only 1000 neurons of each thalamic population (TCR and RTN populations) have GJ in this modelling study.
Thalamocortical Connections
Corticothalamic Fibers
Axonal Conduction Delays
Thalamocortical connections have 1 ms axonal conduction delay [86] while corticothalamic connections have a 5 ms axonal conduction delay [87]. In vivo, axonal conduction from cortex to thalamus is much slower than in the reverse direction [88]. A schematic diagram for the thalamocortical network model is presented in Fig. 9.2 below.
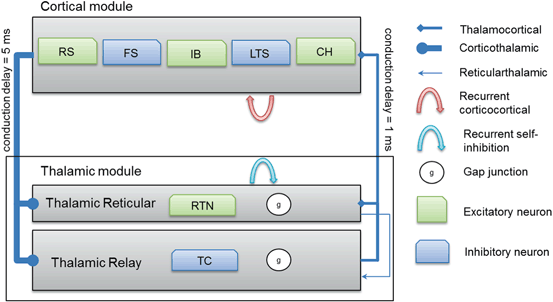
Fig. 9.2
A schematic diagram for the connectivity of the thalamocortical network model. Note that each cortical neuron selects its postsynaptic targets as described in Sect. “Cortical Model Structure”. The number of corticothalamic fibers is ten times more than thalamocortical fibers (therefore, represented by a bold line). Abbreviations: regular spiking (RS), fast spiking (FS), intrinsically bursting (IB), low-threshold spiking (LTS) and chattering (CH)
Model Dynamics
The model consists of different types of neurons, synaptic transmission with AMPA, GABA, and NMDA kinetics, short-term plasticity and a distribution of axonal conduction delays [68].
Neuronal Dynamics
Spiking dynamics of neurons are simulated based on Izhikevich’s model of spiking neurons [65], which can reproduce the firing patterns of known types of hippocampal, cortical, and thalamic neurons. A spiking neuron can be expressed in the form of ordinary differential equations (ODEs) as shown in Eqs. (9.1)–(9.3).

(9.1)

(9.2)
with the auxiliary after-spike resetting as follows

(9.3)
where the dimensionless variables V and u represent the membrane potential and the recovery variable of the neuron, respectively. The variable I syn denotes the total received cortico-cortical synaptic input as described below. The recovery variable u provides negative feedback to V, and it corresponds to the inactivation of Na+ ionic currents and activation of K+ ionic currents. Dimensionless parameters a, b, c and d can be tuned to simulate the dynamics of inhibitory and excitatory neurons. The parameter a describes the rate of recovery, the parameter b represents the sensitivity of the recovery variable u to the subthreshold fluctuations of the membrane potential V, the parameter c represents the after-spike reset value of variable V and the parameter d describes the after-spike reset of variable u [65].
The parameters of the cortical excitatory neurons are (a, b) = (0.02, 0.2) and (c, d) = (− 65, 8) + (15, − 6). r 2 to achieve heterogeneity, where r is uniformly distributed on the interval [0, 1]. The expression (r 2 ) biases the distribution towards RS neurons. Each cortical inhibitory neuron has (a, b) = (0.02, 0.25) + (0.08, − 0.05). r and (c, d) = (− 65, 2) [68]. Dynamics of thalamic neurons are expressed in the form [89]

(9.4)

(9.5)

(9.6)
where the parameters for TCR are C = 200, k = 1.6, v r = − 60, v t = − 50, a = 0.01, b = 0 (if v > −65 and b = 15 otherwise), c = − 60 and d = 10. The parameters for RTN are C = 40, k = 0.25, v r = − 65, v t = − 45, a = 0.015, b = 2 (if v > −65 and b = 10 otherwise), c = − 55, d = 50 and v peak = 0.
Synaptic Dynamics
Input
In addition to the input synaptic current, each neuron receives a noisy input of magnitude (15 pA) generated by a Poisson point process with 100 Hz mean firing rate as modelled in a previous study [50].
Synaptic Weights
The values of corticocortical excitatory synaptic weights are within the range [0, 0.5] as in [68]. The values of other types of synaptic weights are chosen such that the power spectra dynamics of the model has its peak at 10 Hz (as recorded in the wakeful relaxed state with closed eyes). The distribution of synaptic weights follows a Gaussian function with mean µ and standard deviation  as described in Table 9.1.
 as described in Table 9.1.
Table 9.1
The distribution of synaptic weights
Synaptic weights | |||
|---|---|---|---|
Type of synapse | Range [min, max] | Mean µ | Standard deviation  |
Corticocortical | [0, 0.5] | 0.25 | 0.085 |
Thalamocortical | [0, 1] | 0.5 | 0.180 |
Thalamicreticular | [0, 1] | 0.5 | 0.180 |
Corticothalamic | [0, 4] | 2 | 0.680 |
Corticoreticular | [0, 4] | 2 | 0.680 |
Short-Term Plasticity
Short-term depression and facilitation are implemented using the synapse model in [90]:

(9.7)

(9.8)
where R and w represent ‘depression’ and ‘facilitation’ variables, respectively. Excitatory synapses have U = 0.5, F = 1000 and D = 800. Inhibitory synapses have U = 0.2, F = 20 and D = 700. The parameters U, F and D were measured in [90, 91]. The expression δ is the Dirac function. The fractional amount of neurotransmitter available at time t is determined by  . When the postsynaptic neuron receives a spike at time t n (after axonal delay; i.e., when a presynaptic spike arrives at the synapse), the variable R decreases by
  while the variable w increases by
  .
.
 . When the postsynaptic neuron receives a spike at time t n (after axonal delay; i.e., when a presynaptic spike arrives at the synapse), the variable R decreases by
  while the variable w increases by
  .
. Synaptic Kinetics
The total synaptic current of neuron, i, is calculated as
![$$ {{I}_{syn}}={{g}_{AMPA}}(v-0)+\frac{{{g}_{NMDA}}(v-0)\left({{\left[\frac{v+80}{60} \right]}^{2}}\right)}{1+{{\left[\frac{v+80}{60} \right]}^{2}}}+{{g}_{GABAA}}(v+70)+{{g}_{GAB{{A}_{B}}}}(v+90) $$](/wp-content/uploads/2016/12/A319630_1_En_9_Chapter_Equ9.gif)
(9.9)
where v is the postsynaptic membrane potential, and the subscript indicates the receptor type. Each conductance updates by first-order linear kinetics  with
with  , 150, 6 and 150 ms for the simulated AMPA, NMDA, GABAA and GABAB receptors, respectively [68]. The ratio of NMDA to AMPA receptors is 1 for all excitatory neurons. Firing of a presynaptic excitatory neuron j increases g AMPA and g NMDA by
  where s ij is the strength of the synapse from neuron j to neuron i, R j is the short-term depression variable and w j is the short-term facilitation variable. The ratio of GABAB to GABAA receptors is 1 for all inhibitory neurons. Each firing of an inhibitory presynaptic neuron increases
  and
and  by
by  . The gap junction current is calculated according to the following formula
 with
with  , 150, 6 and 150 ms for the simulated AMPA, NMDA, GABAA and GABAB receptors, respectively [68]. The ratio of NMDA to AMPA receptors is 1 for all excitatory neurons. Firing of a presynaptic excitatory neuron j increases g AMPA and g NMDA by
  where s ij is the strength of the synapse from neuron j to neuron i, R j is the short-term depression variable and w j is the short-term facilitation variable. The ratio of GABAB to GABAA receptors is 1 for all inhibitory neurons. Each firing of an inhibitory presynaptic neuron increases
  and
and  by
by  . The gap junction current is calculated according to the following formula
(9.10)
where g (conductance) has a value of 2 and each thalamic neuron is electrically coupled to five neighbouring neurons of the same type.
Synaptic Degeneration and Compensation
Study 1– Cortical Network
We simulate ten random patterns of the model generated with different seeds (therefore representing ten individuals). All simulated networks preserve the ratios and distances described in Sect. “Cortical Model Structure”. For each network pattern, we simulate different degrees of synaptic loss (SL) with values between 10 and 70 % (accounting for different stages of neurodegeneration in AD). The GFS and spectral analysis is based on the average of these simulations. In the global compensation model, each network is simulated for 1 min model time with physiological values of all parameters. After the network reaches a steady-state, synaptic loss is introduced through a random deletion of a fraction, SL, of excitatory connections. Then, the firing rate of excitatory neurons is calculated every 5 s by averaging over all excitatory spikes in the preceding 5 s interval, as illustrated in Fig. 9.3. The remaining synaptic weights between excitatory neurons are then increased in these time-points by  , where
  is a rate parameter
  , g* is the target firing rate (the firing rate of the network during the steady-state before synaptic loss), and g is the current average firing rate.
 , where
  is a rate parameter
  , g* is the target firing rate (the firing rate of the network during the steady-state before synaptic loss), and g is the current average firing rate.
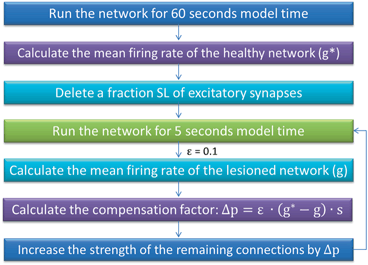
Fig. 9.3
A summary of the process of simulating synaptic degeneration and global compensation. The same model is utilized for local compensation. However, the compensation factor is estimated locally for each excitatory neuron based on the mean firing rate of the neuron during intervals of 40 s model time, settlement period is 80 s, the target firing rate of each excitatory neuron is calculated by averaging over all its spikes in the preceding 40 s interval (second 40 to second 80), synaptic loss is performed after second 80 and ε is 0.05
This phenomenological model of degeneration and compensation is adapted from the established study by Fröhlich et al. [50]. The overall model time for each network is 260 s. We apply the compensation rule from 80 s until time-point 220 s (model time). As suggested in [50], this synaptic scaling rule is chosen because, firstly, it is computationally impossible to simulate the real biological timescale (hours to days) for homeostatic plasticity with this model, and second, the effect of scaling the synaptic weights on the firing activity is faster than the homeostatic regulation of synaptic weights.
In local compensation, each excitatory neuron maintains its activity in a local manner in response to synaptic loss (it employs its own compensation factor). The remaining synaptic weights of each excitatory neuron are increased by  , where
  is a rate parameter
  ,
,  is the target firing rate of the neuron (the firing rate of the neuron during the steady-state before synaptic loss), and
  is the current average firing rate of the neuron (after synaptic loss). The total model time in the local compensation model is 1000 s. When applying combined compensation mechanisms (CCM) simultaneously, we apply local and global compensations in parallel. The rate parameter
  is 0.05 and 0.025 for global and local compensation rules respectively. The local target firing rate of each excitatory neuron and the global target network firing rate are calculated by averaging over all spikes in the interval from second 40 to second 80. Synaptic loss is performed after second 80 and the total model time is 1000 s. The local and global compensation factors are estimated based on the mean firing rates during intervals of 40 s model time. The number of network patterns is 5 random patterns generated with different seeds (i.e., representing five individuals).
 , where
  is a rate parameter
  ,
,  is the target firing rate of the neuron (the firing rate of the neuron during the steady-state before synaptic loss), and
  is the current average firing rate of the neuron (after synaptic loss). The total model time in the local compensation model is 1000 s. When applying combined compensation mechanisms (CCM) simultaneously, we apply local and global compensations in parallel. The rate parameter
  is 0.05 and 0.025 for global and local compensation rules respectively. The local target firing rate of each excitatory neuron and the global target network firing rate are calculated by averaging over all spikes in the interval from second 40 to second 80. Synaptic loss is performed after second 80 and the total model time is 1000 s. The local and global compensation factors are estimated based on the mean firing rates during intervals of 40 s model time. The number of network patterns is 5 random patterns generated with different seeds (i.e., representing five individuals).
The choice of modelling synaptic loss in this study is supported by the finding that synapse loss occurs before neuronal death [92–94] and the early reduction in synapse density is not proportional to the degree of neuronal loss [92, 95]. Furthermore, the loss of dendritic spines (excitatory postsynaptic contacts) is suggested to occur long before or even in the absence of neurodegeneration [93, 94, 96]. Indeed, the degree of synaptic loss is the most correlated factor with the severity of AD and cognitive decline [92, 97], even more than neurodegeneration or NFT components [98]. Hence, the main focus of this study is on the investigation of synaptic loss as well as the global and local synaptic reactions. Synaptic loss is considered a major correlate of cognitive impairment in aging as synapses are essential for interneuronal communication and are the smallest anatomical structures that appear to change easily [46].
Experimental studies have shown that the loss occurs in excitatory synapses ; [96, 98–101], in particular, in the early stages of AD [101]. These synapses are attacked by neuropathological forms of Aβ protein [92, 99]. Deficits in numerous neurotransmitters (including corticotropin-releasing factor, somatostatin, GABA, and serotonin) have been observed to accrue as the disease progresses. However, the early symptoms appear to correlate with dysfunction of cholinergic and glutamatergic synapses [101]. These findings provide supportive evidence to justify the implementation choice of varying the number of excitatory (glutamatergic) synapses to investigate AD in this modelling study.
Study 2– Thalamocortical Network
The thalamocortical model was simulated for 80 s model time with ten different baseline (normal) setups generated with different seeds (therefore representing ten individuals) to collect the baseline data for analytical purposes. Similarly, there are ten random patterns of the model for each type of connectivity loss. For each network pattern, different degrees of synaptic loss (SL) were simulated with values between 10 and 60 % (representing different stages of neurodegeneration). The spectral analysis is based on the average of these simulations.
Each network is simulated for 10 s model time with physiological values of all parameters. Then, synaptic loss is performed by a random deletion of a fraction, SL, of connections followed by the synaptic compensation mechanism as described below
Corticocortical connectivity loss
Synaptic loss is implemented in this case by deleting excitatory synapses among cortical neurons on the cortical surface. The compensation rule is applied from 80 s until 200 s (model time). The firing rate of excitatory neurons is calculated every 5 s by averaging over all excitatory spikes in the preceding 5 s interval. The remaining synaptic weights between excitatory neurons are then increased in these time-points by the following formula

(9.11)
where  The total model time is 300 s.
 The total model time is 300 s.
Thalamocortical connectivity loss
Cortical neurons receive input from thalamic neurons as described in Sect. “Corticothalamic Fibers”. This case examines the effect of losing such input (synapses) on the spectral output of the network. This case incorporates the presented compensation mechanism in case 1 (above) where corticocortical synaptic weights are scaled up to compensate for the loss of thalamic input signals that is induced by thalamocortical synaptic loss.
Corticothalamic connectivity loss
Several studies have reported the fundamental role of the cortex in generating slow oscillations and alpha waves [77, 102]. Interestingly, it has been found that slow oscillations [103] and alpha waves [104] can be maintained in the presence of lesions in the thalamus. On the other hand, slow oscillations in the thalamus have been supressed in decorticated cats [105]. Such studies pointed out the central role of the cortex in generating oscillations and driving the activity of the thalamus as observed in the rastergram analysis in [77] and the simulated LFPs in the current study (see Fig. 9.17).
This case explores the dynamics of the network after abnormal reduction of the distribution of cortical efferents (input) to the TCR neurons in the thalamic network. It is mentioned earlier (in Sect. “Corticothalamic Fibers” above) that TCR afferents are received from cortical and RTN neurons. To compensate for the loss of cortical input, the study has scaled down the inhibitory input from RTN neurons according to Eq. (9.11) with  has an initial value of 0.05 and evolves autonomously such that it is increased by 0.00125 if g is less than g* and decreased by 0.00125 otherwise. The computation is allowed to run for a long period (500 s) to allow the model to stabilise. When using a constant parameter value (as in the above two cases), a significant depolarized phase followed by highly hyperpolarized intervals is observed (similar to sleep oscillations) [77]. The aim is to maintain the asynchronous firing pattern of the system (as in the wakeful state). From a neurobiological point of view, an in vivo study has observed a reduced RTN inhibition to TCR neurons in response to corticothalamic synaptic degeneration (initiated by cortical neuronal death) and consequently, leading to enhanced TCR activity and recovered thalamocortical activity [106].
 has an initial value of 0.05 and evolves autonomously such that it is increased by 0.00125 if g is less than g* and decreased by 0.00125 otherwise. The computation is allowed to run for a long period (500 s) to allow the model to stabilise. When using a constant parameter value (as in the above two cases), a significant depolarized phase followed by highly hyperpolarized intervals is observed (similar to sleep oscillations) [77]. The aim is to maintain the asynchronous firing pattern of the system (as in the wakeful state). From a neurobiological point of view, an in vivo study has observed a reduced RTN inhibition to TCR neurons in response to corticothalamic synaptic degeneration (initiated by cortical neuronal death) and consequently, leading to enhanced TCR activity and recovered thalamocortical activity [106].
Corticoreticular connectivity loss
A recent thalamocortical modelling study based on neural mass models has speculated that reduced RTN afferents contribute to abnormal oscillatory activity in AD [1]. Using a microscopic model with more details such as GJ, this study considers this finding and includes a synaptic reaction mechanism that scales down the inhibition among RTN neurons to recover their output activity. The model employs the above mentioned technique in estimating  with an increase (or decrease) in magnitude of 0.0025.
 with an increase (or decrease) in magnitude of 0.0025.
Data Analysis
Power Spectra Analysis
The power spectra analysis is based on the relative band power, an analytic tool recommended in dementia studies [29]. The averaged spike trains over all excitatory neurons are smoothed using a Gaussian kernel with standard deviation (SD = 20 ms) as modelled in [50]. To analyse the relative power spectra, the Fast Fourier Transform (FFT) is applied on the smoothed spike trains during an 18-second window (after recovering the target firing rate for simulations of compensation mechanisms) in each simulation as follows: (1) the 18-second window is divided equally into six smaller windows of 3-s width each; (2) the FFT is applied separately on the spike trains within each small window; (3) the average power spectra over all six windows is then calculated; and (4) the relative power spectra are found by dividing the power spectrum at each frequency band by the mean of the total power spectra as in [1]. We consider the frequency bands from 1 to 100 Hz when calculating the total power spectra. One-way repeated measures ANOVA is used to analyse the statistical significance of the difference in relative band power within each frequency band between the physiological (baseline) case and cases with different degrees of synaptic loss (p-values less than 0.01 indicate a significant difference).
Global Field Synchronization Analysis
The study utilizes the GFS tool to measure the correlation in neural activity across the network at a given frequency band. GFS quantifies the phase coupling between the recorded EEG signals over several locations on the scalp [9, 21, 25, 107]. Each signal is transformed into the frequency domain and is represented as a two-dimensional vector in a complex plane where the phase of the signal is represented by the direction of the vector. Then, GFS tests the locations of the endpoints (in the complex plane) of the vectors representing all EEG signals. GFS value ranges from zero to one. Enhanced functional connectivity results in greater values of GFS whereas decreased functional connectivity has lower GFS values indicating the absence of common phase [9, 21, 25, 107]. GFS is not correlated with the total power of the EEG data [21]. The software used for computing GFS is freely available in [108].
For each network pattern, this study analyses the correlation in neural activity over six Local Field Potential (LFP) signals obtained from six locations on the cortical sphere as illustrated in Fig. 9.4. Each LFP signal is a 5-s epoch and is obtained from the activity of neurons chosen within a circle of radius 8 mm. LFP is estimated by averaging the spike trains smoothed with a Gaussian kernel (SD of 20 ms) as in [50]. For each network pattern, the GFS measure at a particular frequency band is computed under the following conditions: (1) baseline, (2) synaptic degeneration without compensation; (3) synaptic degeneration with local compensation; (4) synaptic degeneration with global compensation and (5) synaptic degeneration with combined compensation mechanisms (CCM).
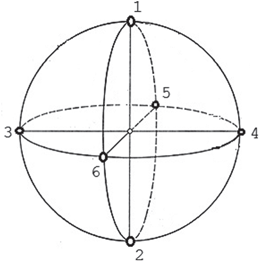

Fig. 9.4
The configuration of the six LFP locations are indicated on the diagram. The great-circle (orthodromic) distance between location 1 and location 2 is 25.1327 mm
For all modelled cases, the Sum of Squared Differences (SSD) is computed over all degrees of synaptic loss (10–70 %) at each frequency band to quantify the relative difference from the baseline value (in a single scalar value). SSD has the following simple formula:

(9.12)
where  is the baseline value at a given frequency band,
  is the mean relative power (or GFS) at a particular degree of synaptic loss and n is the number of simulated cases of synaptic loss (n = 7).
 is the baseline value at a given frequency band,
  is the mean relative power (or GFS) at a particular degree of synaptic loss and n is the number of simulated cases of synaptic loss (n = 7).
Event Related Synchronisation and Desynchronisation
EEG and modelling studies have quantified frequency alterations in the ongoing oscillatory signal in response to a stimulus (event) based on the event related desynchronisation/synchronisation (ERD/S) measure [109–111]. ERD refers to diminished power density in certain EEG waves after the internal or external stimulation, whereas ERS is observed if the event causes an enhancement in the power amplitude of an EEG frequency band. The measure first appeared in [112] and has been extensively utilised in BCI studies such as [113–115].
Study 2 employs an ERD/ERS tool1 to analyse the impact of synaptic loss (the event) and compensation on the network oscillatory activity. ERD/ERS estimation is based on a previous study [111] that is accompanied with an online freely available MATLAB® routine [116]. The approach uses a Short time Fourier transform (STFT or spectrogram) to compute the time-frequency power of different waves and bootstrapping with pseudo-t statistics to mark the significant increase (ERS) or decrease (ERD) of the frequency band power in a particular band.
The simulated LFP are estimated by averaging spike trains smoothed with a Gaussian kernel (SD of 20 ms). Time-frequency spectrogram is a common EEG (and signal processing) analytical method used to visualise changes on the spectral power of frequency bands as a function of time. In the study 2 (TC network) the spectograms of the simulated LFP signals based on the MATLAB® (MathWorks) function spectrogram() provided with a LFP signal of length 6 s and a Hamming window of size 2 s. For presentation purposes, the spectrogram plots have been filtered with the MATLAB® (MathWorks) function filter2(). Dynamics of neurons are simulated using the first-order Euler method with 0.5 ms time step to avoid numerical instabilities. The synaptic dynamics are simulated with 1 ms time step [68].
Computer Simulations
Study 1
The anatomy of the network is implemented in MATLAB and saved to ASCII files. Then a C implementation with MPI is used to load the network (ASCII files) and simulate the model dynamics. The models run on a HPC facility that consists of 31 Dell R401 computing servers, each with two physical Intel Xeon CPUs with six Cores running at 2.66 MHz. For study 1 the cortical model takes about 3 min to simulate 1 s model time on 40 cores. The total number of simulations for local and global compensation mechanisms is 140. As described above, each network pattern has 14 simulations, 7 simulations for global compensation (each representing a certain degree of synaptic loss) plus 7 simulations for local compensation. Half of the network patterns are involved in simulations of the CCM case (35 simulations). As in [68], neuron dynamics are simulated using the first-order Euler method with 0.5 ms time step to avoid numerical instabilities. The synaptic dynamics are simulated with 1 ms time step [68]. Data analysis is performed with custom-written MATLAB scripts and the GFS tool.
Study 2
The models were simulated on the HPC facility described above. It takes about 20 s to simulate 1 s model time on 40 cores. The anatomy of the network was implemented in MATLAB whereas the dynamics were simulated by using C programing language with MPI.
Results
Study 1– Cortical Network
Investigating the interplay between synaptic loss and compensation, and abnormal EEG power spectra based on a computational modelling approach is the focus of this study. Compensation mechanisms (i.e., homeostatic plasticity) play a critical role in controlling the activity levels of neurons and neural circuits. Excitatory synaptic loss leads to a decrease in the activity levels of neural circuits. Synaptic compensation increases the efficacy of the remaining excitatory synapses to maintain the activity of the network (compensate for synaptic loss).
Here, we model two compensatory mechanisms independently; a global compensation mechanism and a local compensation mechanism. In addition, we develop a third model of synaptic compensation that combines both local and global compensations in parallel. We also analyse the GFS and output power spectra of the lesioned network before and after the onset of synaptic compensation. Homeostatic plasticity is developed over the course of hours to days and possibly over much longer durations. However, it is simulated in this study by updating the remaining excitatory synapses at equally spaced time intervals. The underlying approximation of this separation of timescales is well justified by the fact that the effect of changes in synaptic conductance on firing rates is immediate, whereas homeostatic scaling triggered by changes in activity levels occurs on a much slower timescale [50].
With global compensation, the scaling factor estimate is based on the mean firing rate of excitatory neurons during a 5-s interval. The compensation factor estimates in local and CCM compensation mechanisms are based on the mean firing rate of the excitatory neurons (and the network in case of the global compensation factor in the CCM model) within a 40 s interval to gain an accurate estimate of the activity level of every excitatory neuron.
Rhythms and Asynchronous Firing
The network exhibits an asynchronous firing activity before synaptic degeneration and after synaptic loss with/without synaptic compensation mechanisms. It is suggested that stimulating the neurons with  Hz noisy input results in asynchronous firing behaviour, while low frequency input ( < 1 Hz) causes synchronized spiking activity [68]. This synchronized activity can be observed in networks with a small number of neurons such as in cortical slabs [77, 117] or cultures [118, 119].
 Hz noisy input results in asynchronous firing behaviour, while low frequency input ( < 1 Hz) causes synchronized spiking activity [68]. This synchronized activity can be observed in networks with a small number of neurons such as in cortical slabs [77, 117] or cultures [118, 119].
The output power spectrum for all conditions is displayed in Fig. 9.5a. Figure 9.5a illustrates the network exhibited cortical-like asynchronous dynamics. The network produces collective rhythmic behaviour in the frequency range corresponding to that of the mammalian cortex in the awake state. However, the power spectra dynamics of the lesioned network (dashed line) demonstrate a significant loss compared to the other cases where compensation mechanisms are applied. After applying compensatory mechanisms, the network recovers its activity. The recovered dynamics with global compensation and CCM have shown a shift to lower frequency bands. This shift is in agreement with the analysed EEG signals from animal models of AD (Fig. 9.5b) and AD patients (Fig. 9.6) [4, 13]. In the following section, this study utilizes the relative band power [1, 29] and the GFS measure [21] to evaluate changes in oscillations across various degrees of synaptic loss as well as to explore the impacts of compensation mechanisms.
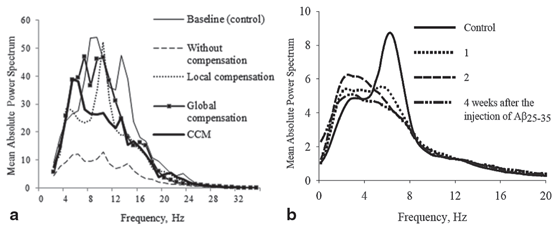
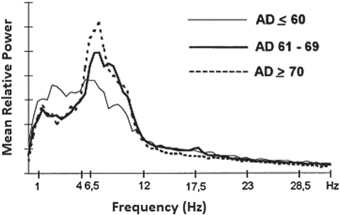

Fig. 9.5
(a) The mean power spectra of ten network simulations in each case (five network simulations for the CCM case). The degree of synaptic loss is 50 %. With compensation mechanisms, the power spectra are computed after the networks recover their baseline firing rate. The power spectral density vector for each network pattern is computed using Welch’s method with 2 s hamming window and 50 % overlap between windows. This is a 2 s sliding window over a 30 s time interval. The power spectrum for each network pattern is the average of all the sliding windows and (b) the mean power spectra of cortical EEG signal for the adult rats in control and after 1, 2 and 4 weeks of the injection of Aβ25–35 in animal models of AD. (Reprinted from Ref. [4] with kind permission from Springer Science and Business Media B.V. Copyright © 2009. Springer Science and Business Media B.V.)

Fig. 9.6
Mean relative power spectra of three cohorts of AD patients categorized according to the age of AD onset. (Reprinted from Ref. [13] with kind permission from Elsevier. Copyright © 1999, Elsevier)
Neural Correlates of Synaptic Loss and Compensation Mechanisms
Initially, we show the typical changes in the frequency bands in different stages of AD as presented in Fig. 9.7 [69]. Theta band power (6–7.5 Hz) increases in the mild stage of AD (score 3 on the GDS) and enhances further as the disease progresses to the moderate stage (scoring 4 and 5 on the GDS). An initial increase in delta band power is observed in moderate AD (scoring 4 and 5 on the GDS). A sharp increase in the activity of slow frequency bands (2–7.5 Hz) occurs in the sever stage of AD (score 6 on the GDS). The power spectra of faster frequency bands (8–22.5 Hz) is disrupted at this stage [69].
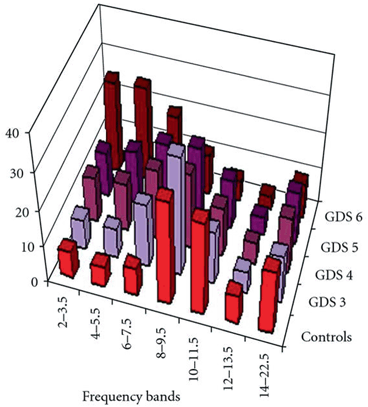

Fig. 9.7
Illustration of the association between AD severity and 7 EEG frequency bands (2–3.5; 4–5.5; 6–7.5; 8–9.5; 10–11.5; 12–13.5; 14–22.5 Hz). Five groups are included: a group of normal controls and four clinical classes of severity; Global Deterioration Scale (GDS) ranges from three to six. (Adapted with permission from Ref. [69]
The results of the current modelling study show that synaptic loss underlies the power spectra increase of delta and theta frequency bands with a parallel decrease in beta and alpha frequency powers, as illustrated in Fig. 9.7a, b, c, d.
Figure 9.8a shows the delta band power response to synaptic loss and the relationship to the type of compensation. It is clear that the relative power exhibits an abnormal increase with the increasing degree of synaptic loss (in the absence of the synaptic scaling rules). In contrast, global compensation controls the relative power magnitude up to 60 % synaptic loss (then, the relative power increases significantly). In local and CCM compensation mechanisms, the output relative power tends to increase (after 10 % synaptic loss) with the increasing degree of synaptic loss up to 50 and 60 % synaptic degeneration, respectively. As mentioned in Sect. “Introduction”, increased delta band power is one of the EEG hallmarks in AD patients (in later stages of the disease). The relative theta band power [120] increases in earlier stages of synaptic loss (10 %) as shown in Fig. 9.8b. Overall, theta band relative power demonstrated a progressive increase with an increased rate of synaptic loss. However, this abnormal increase is less pronounced with local compensation compared to the other cases.
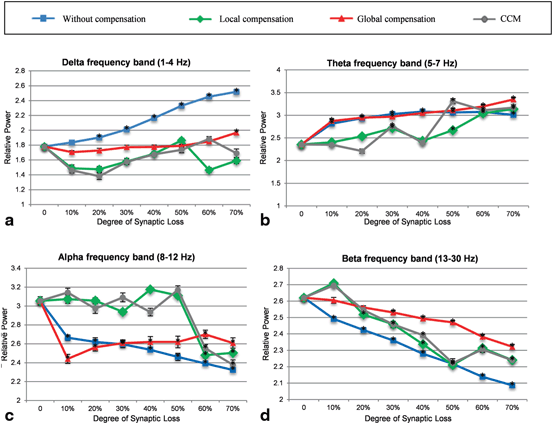

Fig. 9.8
Comparative power spectra analysis of the effects of synaptic degeneration without compensation (blue line), synaptic degeneration with local compensation (green line), synaptic degeneration with global compensation (red line) and synaptic degeneration with CCM (grey line) on the relative power of (a) delta, (b) theta, (c) alpha and (d) beta frequency band powers. Asterisk marks indicate cases where the difference between baseline and loss without/with compensation is significant (p < 0.01). The demonstrated power spectra represent mean values which are determined from ten simulations with different random patterns of synaptic loss for each degree of synaptic loss. Error bars indicate standard error of the mean (SEM). In (a) and (b) there is clear increase in power in slow bands (delta and theta) and (c) and (d) show a significant decrease in fast bands (alpha and beta) relative to baseline with increasing synaptic loss (blue line). The blue line shows varying degree maintaining consistency with baseline when different types of compensation mechanisms are applied
Figure 9.8b illustrates that local compensation can preserve the baseline level even at 40 % synaptic loss. Similarly, the CCM case maintains the normal value of theta band power at 40 % but thereafter causes the greatest power increase at the next stage. It can be seen also from Fig. 9.8b that local compensation fails to maintain the baseline value of theta relative power after 50 % synaptic loss. Therefore, even with local compensation the increase in theta relative power cannot be prevented and is ineffective after this level of synaptic loss. The results of global compensation show the highest increase in relative theta band power after 50 % synaptic loss. Before this point, the two cases, synaptic loss with global compensation and synaptic loss without compensation, have almost the same values of relative theta band power. As mentioned in Sect. “Introduction”, increased theta band power has been detected in the early stages of AD [2, 120].
Figure 9.8c shows that relative alpha band power is decreased with increasing levels of synaptic loss. Interestingly, with local compensation and CCM, the relative power is also maintained until 50 % synaptic loss. Within the beta frequency band, compensation processes have reduced the abnormal decrease in relative beta band power (compared to synaptic loss without compensation as presented in Fig. 9.8d). Decreased alpha and beta band powers have also been reported in the early stages of AD onset.
The detailed analysis in Fig. 9.8 can be generalized via computing the Sum of Squared Differences (SSD) across all degrees of synaptic loss (10–70 %) at each frequency band. This global method results in a single index value that reflects the efficiency of the modelled compensation mechanisms in preserving the relative power at a particular frequency band. It can be observed from Table 9.1 that delta and beta relative powers are maximally preserved with global compensation whereas theta and alpha relative powers are maximally preserved with local compensation. For all conditions, the SSD values for the CCM case are in the range between the SSD values of local and global compensation mechanisms. Considering the mean SSD value over all frequency bands (the bottom row in Table 9.2), it can be concluded that local compensation can best maintain the spectral power dynamics in the range (1–30 Hz) as compared to other compensation mechanisms.
Table 9.2
SSD values reflect the global preservation of relative power for a given frequency band. The optimal values (closest to the baseline) at each frequency band are marked with bold font. Rows represent frequency bands and columns represent the modelled cases. The bottom row presents the mean SSD value over all frequency bands for each case
Without compensation | Local compensation | Global compensation | CCM compensations | |
|---|---|---|---|---|
Delta frequency band (1–4 Hz) | 0.217346 | 0.053018 | 0.006962 | 0.047723 |
Theta frequency band (5–7 Hz) | 0.426037 | 0.194941 | 0.536856 | 0.333622 |
Alpha frequency band (8–12 Hz) | 0.305937 | 0.094795 | 0.217464 | 0.107403 |
Beta frequency band (13–30 Hz) | 0.131522 | 0.075926 | 0.028224 | 0.070483 |
Mean | 0.270211 | 0.10467 | 0.197377 | 0.139808 |
Perturbations on the frequency bands can also be analyzed using the Global Field Synchronization (GFS) measure [21]. Figure 9.9a shows that the mean GFS for the delta band before applying compensation increases remarkably, for local compensation increases are observed at 10, 30 and 50 % whereas for global compensation the minimal GFS increase is observed compared to the other cases. A marked decrease in mean GFS is observed at 30 and 50 % for the CCM case preceded by an early increase at 10 % synaptic loss. Increased GFS values in the delta band has been reported in an EEG study that involves 419 healthy and AD particpants [21]. However, a more recent EEG study (22 AD patients and 23 age-matched healthy controls) reported a minor decrease in GFS values for AD pateints at delta band [25].
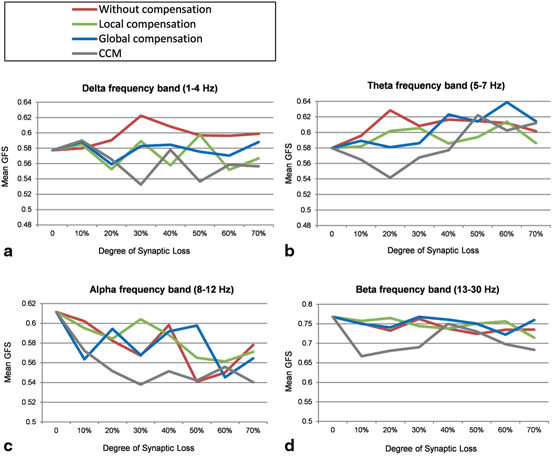

Fig. 9.9
Mean GFS values for (a) delta, (b) theta, (c) alpha and (d) beta frequency bands under four conditions: synaptic degeneration without compensation (red lines), synaptic degeneration with local compensation (green lines), synaptic degeneration with global compensation (blue lines) and synaptic degeneration with CCM (grey lines)
The mean GFS for the theta frequency band without compensation persistently increases. Local compensation can maintain the mean GFS for theta band at moderate (40 %) and late (70 %) stages of synaptic loss. However, it triggers abnormal increases in the early stages as presented in Fig. 9.9b. CCM and global compensation mechanisms break down at 40 and 50 % synaptic loss (though for CCM an early decrease is observed), respectively. Koenig et al. [21] have not found significant GFS alterations at theta frequency in AD pateints. On one hand, a nonsignificant GFS increase in the theta frequency band has been reported for EEG datasets aquired in New York (264 healthy and AD subjects), whilst GFS analysis of another EEG database from Stockholm (155 healthy and AD particpants) has shown a nonsignificant GFS decrease in the theta frequency band which is consistent with the EEG study in [25].
The mean GFS values at alpha frequency band are shown in Fig. 9.9c. The mean GFS with local compensation is closer to the baseline value compared to other compensation mechanisms. Local compensation and global compensation mechanisms break down at 40 and 50 % synaptic loss, respectively. The greatest differences are generated with CCM which can also be observed in the beta frequency band (Fig. 9.9d). The GFS values in Fig. 9.9d are relatively reduced with the increasing degree of synaptic loss. Local compensation and global compensation mechanisms can maintain the GFS dynamics until 60 and 70 % synaptic loss, respectively. Decreased GFS values in alpha and beta frequency bands have been reported in EEG studies in AD [21, 25]. Table 9.2 shows that GFS values at delta and beta frequency bands are maximally preserved with global compensation whereas local compensation can best maintain the GFS values in theta and alpha frequency bands. From the mean SSD value over all frequency bands (the bottom row in Table 9.2), it can be concluded that local compensation can best maintain the GFS values in the range (1–30 Hz) compared to other compensation mechanisms. These observations are relatively correlated with the frequency band findings shown in Table 9.2.
The Effect of Compensation Mechanisms on the Organization of Spiking Activity Patterns Across the Network
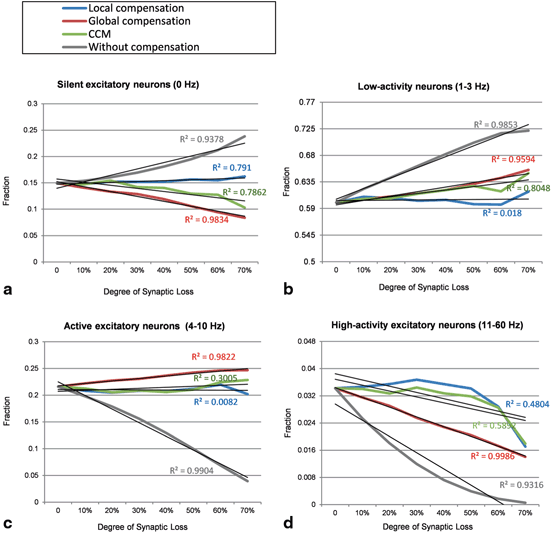
Global compensation changes the distribution of firing rates across excitatory neurons. Global compensation stimulates silent excitatory neurons (0 Hz) and increases the fractions of low activity excitatory neurons (1–3 Hz) and active excitatory neurons (4–10 Hz). Furthermore, global compensation could not preserve the performance of higher-activity neurons (11 Hz or more); the fraction of high-activity excitatory neurons decrease as a function of synaptic loss. The correlation coefficient (R 2 ) of the linear regression lines (Fig. 9.10) in global compensation shows a linear relationship between the rate of synaptic loss and the fraction of excitatory neurons. The significant linear changes can also be observed before applying synaptic compensation. The results in Fig. 9.9a, b, c, d reveal that global synaptic scaling reorganizes network dynamics while recovering the activity level of the network (Fig. 9.11). On the contrary, local compensation mechanism maintains firing rate distributions close to their baseline value. The output histograms of the CCM case (the green lines in Fig. 9.10) range between the outputs of local compensation and global compensation mechanisms (blue and red lines, respectively).

