Neurophysiologic Basis of EEG and DC Potentials
Erwin-Josef Speckmann
Christian E. Elger
Ali Gorji
The clinical electroencephalographer correlates central nervous system (CNS) functions as well as dysfunctions and diseases with certain patterns of the electroencephalograhy (EEG) on an empirical basis. Obviously, this method has been found valuable in clinical practice. Therefore, why should the clinical electroencephalographer study the basic elementary processes underlying the EEG? There is little doubt that the range of EEG interpretations can be much widened and misinterpretations avoided when the underlying elementary processes are also considered. This is true especially for convulsive disorders and cerebral metabolic disturbances. For example, an isoelectric EEG can be caused by selective pCO2 increase while the brain is sufficiently supplied with O2. On the other hand, in the presence of practically normal pCO2 levels, cerebral hypoxia may be the cause. It will be pointed out below that the prognosis may be quite different in these two cases.
POTENTIAL GENERATION AT NEURONAL AND GLIAL ELEMENTS: MEMBRANE POTENTIALS AND FIELD POTENTIALS
The basic mechanisms that give rise to potentials recorded outside the CNS elements will be described. Such extracellular potentials are generally known as field potentials (1).
In the course of this presentation, the morphology of generator structures is discussed briefly. Then, the electrical activity demonstrable with intracellular recordings from neurons and glia cells is described. On the basis of this information, the principles of the generation of extracellular field potentials are outlined and the various types of field potentials are characterized.
GENERATOR STRUCTURES
The CNS essentially consists of nerve cells and glia cells. The arrangement of neurons usually shows a specific type of laminar character. Glia cells are located between neurons. As shown in Figure 2.1, several processes emerge from the nucleus-containing cellular soma (body) of the nerve cell. These processes can be divided into two types according to their function. Most of the processes are dendrites that branch off into numerous small ramifications. Every cell also has an axon that may split up into multiple collaterals. Such an axon provides contact with other nerve cells or with other target organs. In the case of interneuronal connections, the contact consists of synapses that cover the dendrites, the soma, and the axon hillock in large numbers. Thus, nerve cells are usually covered with several thousand synapses (2). The glia cells are imbedded between nerve cell somata, dendrites, and axons. They usually have several processes that make contact with somata and processes of nerve cells; they may also make contact with vessels. This histologic arrangement results in a cerebral extracellular space consisting of very narrow intercellular clefts (3).
NEURONAL MEMBRANE POTENTIALS: INTRACELLULAR RECORDINGS
Essential potentials that can be demonstrated with intracellular recordings are characterized briefly. When the membrane of the nerve cell body is penetrated by a microelectrode, a potential of about 60 to 70 mV with negative polarity in the intracellular space can be recorded. This membrane potential is subject to various fluctuations that are elicited chiefly by synaptic activities. Their mechanisms are shown in greater detail in Figure 2.2. As can be derived from this schematic illustration, the neuron
from which the soma membrane potential is recorded has synaptic connections. The corresponding presynaptic structures are also explored with microelectrodes. If an action potential travels along the fiber, which ends in an excitatory synapse, an excitatory postsynaptic potential (EPSP) occurs in the following neuron (Fig. 2.2A). If two action potentials travel along the same fiber with a short interval, there will be a summation of EPSP triggering an action potential on the postsynaptic neuron after reaching the membrane threshold. If an action potential travels along a fiber ending in an inhibitory synapse, then hyperpolarization will occur, representing an inhibitory postsynaptic potential (IPSP) (4, 5 and 6).
from which the soma membrane potential is recorded has synaptic connections. The corresponding presynaptic structures are also explored with microelectrodes. If an action potential travels along the fiber, which ends in an excitatory synapse, an excitatory postsynaptic potential (EPSP) occurs in the following neuron (Fig. 2.2A). If two action potentials travel along the same fiber with a short interval, there will be a summation of EPSP triggering an action potential on the postsynaptic neuron after reaching the membrane threshold. If an action potential travels along a fiber ending in an inhibitory synapse, then hyperpolarization will occur, representing an inhibitory postsynaptic potential (IPSP) (4, 5 and 6).
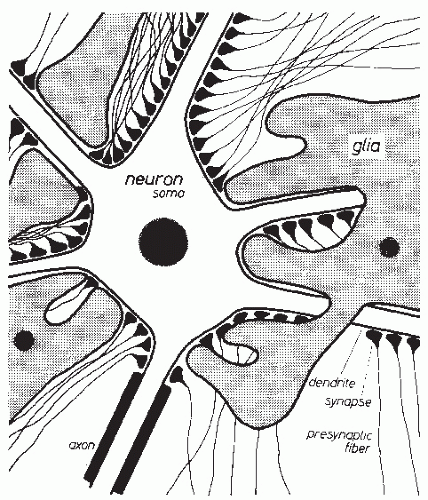 Figure 2.1 Schematic drawing of morphology and histology of neuronal and glial elements. |
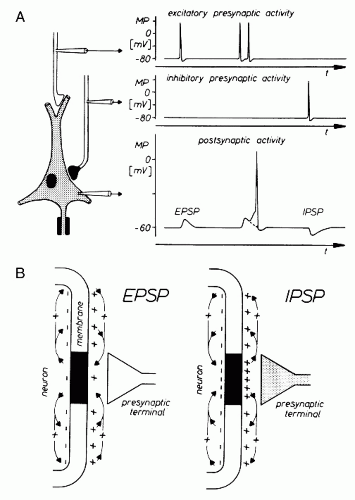 Figure 2.2 Membrane potential (MP) changes and current flows during synaptic activation. A: The MP of the postsynaptic neuron and the MP of the presynaptic fibers are recorded by means of intracellular microelectrodes. Action potentials in the excitatory and inhibitory presynaptic fiber lead to excitatory postsynaptic potential (EPSP) and inhibitory postsynaptic potential (IPSP), respectively, in the postsynaptic neuron. Two EPSPs sum up to a superthreshold potential, triggering an action potential in the postsynaptic neuron. B: During EPSP and IPSP, ionic current flows occur through as well as along the neuronal membrane, as shown by arrows. The density of + and − signs indicate the polarization of the subsynaptic (dark area) as well as that of the postsynaptic membrane during synaptic activation. |
Because of the time course of the various membrane potential fluctuations, the postsynaptic potentials are thought to contribute primarily to the generation of the extracellular field potentials in question (1,5,7,8). For this reason, the ionic mechanisms of these potentials are discussed in greater detail. The individual events of this process are presented with a magnified time base (Fig. 2.3). With the elicitation of an EPSP, a net inflow of cations occurs across the subsynaptic membrane. As shown in Figure 2.2B, a potential gradient develops along the neuronal membrane in the intra- and extracellular spaces. Because of this potential gradient, cations move along the nerve cell membrane through the extracellular space in the direction of the subsynaptic region. An inversely directed flow takes place in the intracellular space. With the generation of an IPSP, there is an outflow of cations from the nerve cell and/or an inflow of anions into the nerve cell. These changes first increase the membrane potential at the subsynaptic membrane in comparison with the surrounding segments of the membrane. For this reason, a potential gradient develops along the nerve cell membrane, as in the case of the EPSP genesis. This potential gradient causes, in the extracellular space, a flow of cations from the subsynaptic region to the surrounding portions of the membrane. An inverse process develops in the intracellular space (5).
The ion fluxes in the extracellular space are of paramount significance in the generation of field potentials. Therefore, these processes are further discussed in the following chapters.
GLIAL MEMBRANE POTENTIALS: INTRACELLULAR RECORDINGS
In addition to the neurons, glial cells may also play a role in the generation of extracellular field potentials (9,10). Therefore, the bioelectric properties of glial cells are summarized.
If a glia cell is penetrated with a microelectrode, a membrane potential can be recorded with a polarity similar to that of the nerve cells. The size of this membrane potential approximates the potassium equilibrium potential and hence somewhat exceeds the membrane potential of nerve cells. In contrast to neurons, glial cells fail to show any action potentials, and there are also no postsynaptic potentials. Thus, in contrast to neurons, glial cells do not show characteristic potentials that distinguish them unmistakably from other cells. The glial membrane potential, however, is also not constant. An augmentation of the extracellular potassium concentration (potassium activity) causes depolarization of glial cells (Fig. 2.4A). Concentration changes of other ions cause only negligible alterations of the glial cell membrane potential. The glial cell is hence comparable to a potassium electrode (9,11).
The dependency of the glial membrane potential on the extracellular potassium concentration is the reason for a functional linkage with adjacent neuronal structures. Neuronal activity is associated with outflow of potassium ions. As shown schematically in Figure 2.4B, repetitive firing of neurons gives rise to increased extracellular potassium concentration and hence to glial cell depolarization (12,13). If the potassium concentration does not affect the entire glial cell membrane and remains increased only locally, then potential gradients build up along the glial cell, giving rise to
intra- and extracellular current flows similar to the ones described in reference to neuronal synaptic transmissions (Fig. 2.2). Glial cells frequently have widespread processes and furthermore may have close connections with each other. For this reason, potential fields of considerable spatial extension may develop on the basis of the aforementioned mechanisms (1,10,14,15). In view of the above-described functional interconnections, it is quite likely that in the genesis of extracellular field potentials an amplifying effect can be attributed to the glial cells.
intra- and extracellular current flows similar to the ones described in reference to neuronal synaptic transmissions (Fig. 2.2). Glial cells frequently have widespread processes and furthermore may have close connections with each other. For this reason, potential fields of considerable spatial extension may develop on the basis of the aforementioned mechanisms (1,10,14,15). In view of the above-described functional interconnections, it is quite likely that in the genesis of extracellular field potentials an amplifying effect can be attributed to the glial cells.
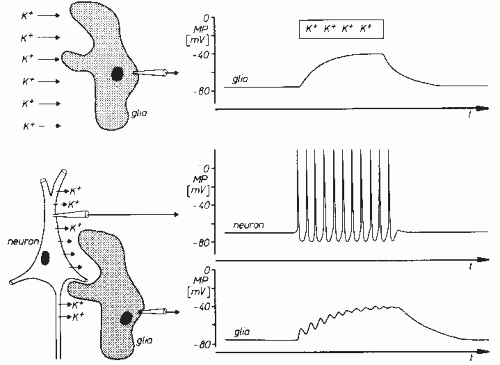 Figure 2.3 Basic mechanisms underlying generation of potentials (electroencephalography [EEG]) and of magnetic fields (magnetoencephalography [MEG]) in the extracellular space of central nervous system. The description is based on the assumption that an extended neuronal process, for example, a dendrite, is locally depolarized by activation of an excitatory synapse. |
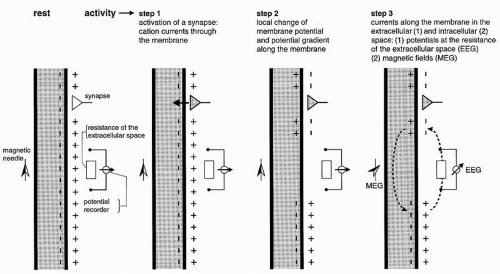 Figure 2.4 Membrane potential (MP) changes of glia cells induced by an increase in the extracellular K+ concentration (arrows in the schematic drawings). A: Potassium is applied extracellularly to the glia cell. B: The potassium concentration is increased due to an activation of a neighboring neuron. (From original tracings from Kuffler SW, Nicholls JG, Orkand RK. Physiologic properties of glial cells in the central nervous system of amphibia. J Neurophysiol. 1966;29:768-787.) |
FIELD POTENTIALS
It has been shown in the preceding section that primary transmembranous currents generate secondary ionic currents along the cell membranes in the intra- and extracellular spaces. The portion of these currents that flows through the extracellular space is directly responsible for the generation of field potentials (Fig. 2.3). Particular significance must be ascribed to the synaptic processes as causing events for the field potentials in question, especially for their time course. In accordance with these statements, the generation of extracellular field potentials will be discussed as exemplified by extracellular fields accompanying synaptic activity (5,8,15,16). The discussion of these events will again make use of a very protracted time axis (Fig. 2.3). The explanation of the events is given in reference to the schematic view in Figure 2.5. This figure shows a widely stretched neuronal element, with one end segment lying close to the surface of a central nervous structure. At both ends of this neuronal unit, the microelectrodes ME1 and ME2 are inserted. At the same time, the extracellular electrodes E1 and E2 are located at the surface and at the deeper end of the neuronal element. The potentials picked up from the intra- and extracellular electrodes are shown in the vicinity of each electrode. The potential recorded from the surface of the nervous structure is accentuated by thicker lines. Figure 2.5 shows active excitatory and inhibitory synapses, either close to the surface or located in the depth. As described elsewhere, the activation of an excitatory synapse leads to a net inward flow of cations. If this statement is applied to Figure 2.5A1, then it becomes evident that the upper end of the neuronal element will be depolarized in comparison with other segments of the same cell. Accordingly, the synaptic current flow causes an EPSP at the microelectrode ME1. This local depolarization then gives rise to further intra- and extracellular ionic currents along the nerve cell membrane. Because of the intracellular movements of positive charges, depolarization in the area of microelectrode ME2 also takes place. This depolarization, however, is less steep and of smaller amplitude. At the superficially located extracellular electrode E2, the inflow of positive charges into the neuronal element causes a negative field potential. The extracellular electrode E2 is, metaphorically speaking, approached by positive charges so that a positive field potential will develop in this area. The point of reversal of the field potentials is localized between electrodes E1 and E2. The exact position of the point of reversal depends on the distribution of extracellular impedances.
Current flows of reversed direction (in reference to the recording electrodes) will occur if the active excitatory synapse is located at the deeper end of the neuronal element (Fig. 2.5A2). In this case, positive charges approach the superficially located electrode (E1) (again speaking metaphorically) and remove themselves from the deeply located electrode (E2). This arrangement of the active synaptic structures causes a positive field potential at the surface and a negative one at the deep electrode. The current flows accompanying the activation of inhibitory synapses located in deeper and in more superficial areas, respectively, are shown in Figure 2.5B. As can be derived from this illustration, the activation of a deep inhibitory
synapse (Fig. 2.5B1) produces a current flow that is largely similar to the one generated by the activation of a superficial excitatory synapse (Fig. 2.5A1). In the same manner, there are also similar current flows in the extracellular space when a superficial inhibitory synapse (Fig. 2.5B2) or a deeply located excitatory synapse (Fig. 2.5A2) is activated. Accordingly, a negative field potential will develop at the surface of a central nervous structure (in the schematic view of Fig. 2.5) whenever a superficial excitatory or a more deeply located inhibitory synapse is activated. The corresponding principle applies to generation of the superficial field potentials of positive polarity.
synapse (Fig. 2.5B1) produces a current flow that is largely similar to the one generated by the activation of a superficial excitatory synapse (Fig. 2.5A1). In the same manner, there are also similar current flows in the extracellular space when a superficial inhibitory synapse (Fig. 2.5B2) or a deeply located excitatory synapse (Fig. 2.5A2) is activated. Accordingly, a negative field potential will develop at the surface of a central nervous structure (in the schematic view of Fig. 2.5) whenever a superficial excitatory or a more deeply located inhibitory synapse is activated. The corresponding principle applies to generation of the superficial field potentials of positive polarity.
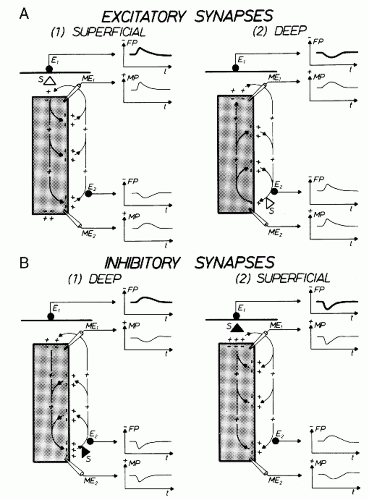 Figure 2.5 Membrane potential (MP) changes and field potentials (FPs) elicited by the activation of excitatory and inhibitory synapses in the central nervous system. The elementary processes are explained by means of a neuronal element (hatched area), the one end of which contracts the surface of a structure in the central nervous system. The MP of the neuron element is recorded at both ends by the microelectrodes ME1 and ME2. The extracellular field is picked up at the surface of the neuronal structure by the electrode E1, as well as in the vicinity of ME2 by the electrode E2. Active excitatory and inhibitory synapses are marked by open triangles and black triangles (S), respectively. A1: The inward current at S generates an EPSP that appears in the region of ME1, as well as in that of ME2. Because S is located superficially, the FP generated, due to the direction of the extracellular current flow (arrows), is of negative polarity at the surface (E1) and of positive polarity in the deeper recording (E2). A2: The activation of a deep excitatory synapse elicits a current flow with inverse direction as compared with A1. Therefore, the extracellular FP consists of a positive deflection at the surface and a negative one at the depth. B1: The outward current at S generates an IPSP in the region of ME2, as well as in that of ME1. Due to the direction of the extracellular current flow, the FP generated consists of a positive fluctuation in the depth (E2) and a negative one in the surface recording (E1). B2: The current flow during the activation of a superficial inhibitory synapse is inverse as compared with B1. Therefore, the FP recorded from the surface consists of a positive fluctuation. Differences in the time course of the various potentials are caused by the electrical properties of the tissue. |
Due to their higher densities especially the currents flowing through the intracellular spaces give rise to magnetic fields surrounding the elements. These magnetic fields can be picked up from the scalp as magnetoencephalography (MEG; Fig. 2.3).
Types of Field Potentials
The field potentials, whose generation has been described, can be subdivided into different types. If field potentials are recorded against an inactive reference point with an upper frequency limit of about 100 Hz, then two types of field potentials can be distinguished, depending on the time constant of the amplifying recording device. In the case of a time constant of 1 second or less, the extracellular field potentials correspond with that which is commonly known as the EEG. If the recording is carried out with an infinite time constant, that is, with direct current (DC) amplifier, then slower potentials can also be picked up. Potentials recorded with this technique are generally known as DC potentials (1,8,15,17). Thus, DC potentials comprise slow as well as fast field potentials. The fast components correspond with the potential fluctuations of the EEG. Due to different time constants, however, the faster potential components may differ from each other as far as their time course is concerned when recordings are done either with conventional EEG amplifiers or with DC amplifiers.
Thus far, technical problems have made it difficult to carry out DC recordings from the scalp. Except for special areas of application, DC recordings are usually performed in animal experiments. DC potentials directly reflect the state of activity of central nervous cells and therefore contribute to the explanation of the mechanisms of genesis of cerebral field potentials (14,18). For this reason, DC potentials will be discussed jointly with EEG waves.
For the sake of comparison, Figure 2.6 shows the EEG and the DC potentials during convulsive activity, hypercapnia, and asphyxia. As shown in this illustration, a tonic-clonic convulsion is associated with a negative DC shift (8,13, 14 and 15,19, 20 and 21). Furthermore, it can be seen that the hypercapnia-induced disappearance of the EEG is associated with a monophasic positive DC shift. In the case of EEG extinction due to primary asphyxia, however, there are characteristic patterns of DC fluctuation. Hence, similar findings in the conventional EEG may be associated with different DC shifts.
Original Remarks Made by Ernst Niedermeyer
What does the term DC shift mean? What is DC? Speaking from experience, many electroencephalographers have no clear
concept regarding DC potentials or DC shifts. One cannot blame them because, for strange reasons, “DC” has two meanings in this context:
concept regarding DC potentials or DC shifts. One cannot blame them because, for strange reasons, “DC” has two meanings in this context:
DC means direct current (and this is, of course, commonplace): a current without oscillations; a current derived from a battery source; a current maintained in one direction through a circuit. A more imperfect DC is produced by a rectifier, used to change alternating current (AC) into DC. For multilingual readers, DC is courant continu in French, Gleichstrom in German, and corrente continuo in Italian.
Electroneurophysiologically, DC shifts are ultraslow potentials, about as slow as 0.1 to 0.2/sec. This, however, is not true DC. Such slow activity is just a bit more “DC-like” since it does not show the faster “AC-like” activity. One simply has to live with this kind of misnomer.
DC also means direct coupling (and this is much less known). What coupling? The coupling between the stages of EEG amplification. Conventional EEG machines have stages coupled by capacitors. Now one has to remember that capacitors (a) reject DC and (b) determine the time constant. Even a very long time constant (several seconds duration) may not suffice for the recording of DC potentials. Direct coupling is a capacitor-free coupling between the stages of amplification and provides the optimal condition for DC recording. This is technically quite difficult in clinical conventional EEG recording but easier under experimental neurophysiologic conditions in animals.
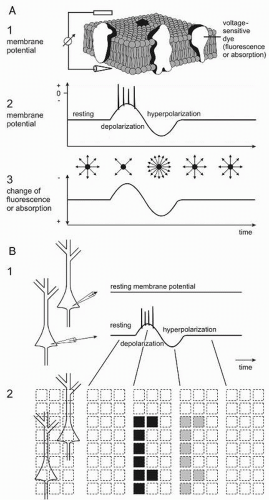 Figure 2.6 Recording of neuronal membrane potentials using voltage-sensitive dyes, and principles and schematic example of application. A: (1) A dye is incorporated into the double lipid membrane of nerve cells and illuminated by light with dye-specific wave length; simultaneously the membrane potential is recorded with an intracellular microelectrode against a reference electrode in the extracellular space. (2) Changes of the membrane potential (MP) starting from the resting level passing a decrease (depolarization) with action potentials superimposed and a subsequent increase (hyperpolarization) and eventually returning to resting level. (3) In correspondence to the different MP levels fluorescence and absorption of the dye change. With fluorescent dyes a depolarization is associated with a decrease and a hyperpolarization with an increase of fluorescence (symbols). B: (1) Two neurons in a population; one stays in the resting state and the other changes its MP as in A2. (2) By the aid of a microscope and a connected array of diodes (squares) the different MP changes of both neurons can be detected via the different optical behaviors. (Speckmann E-J. Das Gehirn meiner Kunst. Kreativität und das selbstbewußteGehirn. Münster: Daedalus; 2008.) |
Hence, be aware of the dual significance of the term DC.
Validation of Field Potentials As to Their Functional Significance
Correlating field potentials with other signals accompanying neuronal activity may contribute to a validation of them. There is a variety of methods other than electroencephalography for detecting brain activity. Thus, single photon emission tomography (SPECT), positron emission tomography (PET), functional magnetic resonance imaging (fMRI), and intrinsic optical imaging (IOI) are based on metabolic changes associated with increases of local neuronal activity. The latter methods are “very indirect” (22). EEG including evoked potentials (EP) and MEG represent “more direct ones” since they measure the field effects of the proper neuronal activity and therewith of the information processing brain activity. For the analysis of neuronal network functions, the immediate and simultaneous recording of membrane potentials of all neurons in a population by application of voltage-sensitive dyes is the “only direct” method available yet (23, 24, 25, 26, 27 and 28). All these methods have advantages and disadvantages. Thus, the functional imaging using voltage-sensitive dyes cannot be applied in patients for several reasons, for example, prerequisite of direct access to the brain structure to be investigated, phototoxicity, and pharmacologic side effects of the dyes. But, this method is helpful to analyze the principles of functional meaning of field potentials in living human brain slices in vitro, especially with spontaneously occurring epileptic discharges.
A principle and schematic example of recording neuronal membrane potentials using voltage-sensitive dyes is displayed in Figure 2.7. The living brain slices are stained with fluorescence (or absorption) dyes (Fig. 2.7A1). With depolarization and hyperpolarization the fluorescence is decreased and increased, respectively (Fig. 2.7A2 and A3). The changes in fluorescence are measured via a microscope by an array of detectors and therewith the actual membrane potentials of the neurons are observed (Fig. 2.7B1 and B2).
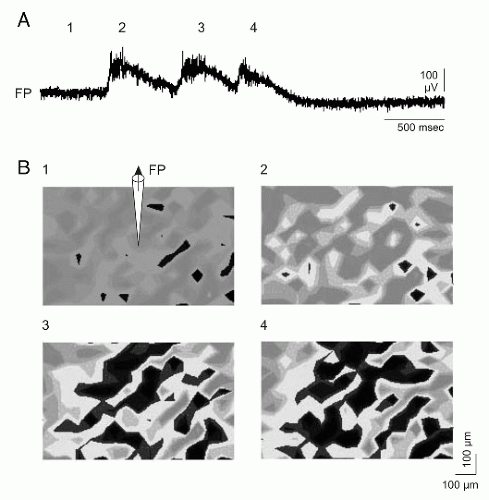 Figure 2.7 Simultaneous detection of membrane potentials (MP) of all neurons in a population (voltage-sensitive dye) and conventional recording of the local field potential (FP) at the same time. Living brain tissue (0.5 mm thick) from the temporal lobe of a patient who underwent epilepsy surgery. A: Recording of the local FP (“local EEG”). (1) Resting state; (2 to 4) epileptic discharges of different intensities. Epileptic discharges appeared spontaneously, that is, they were not induced experimentally. B: MP changes indicated by the intensity of fluorescence of the dye (black, decrease of the MP, depolarization). Resting state (1); similar epileptic potentials in the FP (2 and 3) are associated with different extents of neuronal depolarizations and similar extents of neuronal depolarizations with different epileptic potentials in the FP (3 and 4). (Speckmann E-J. Das Gehirn meiner Kunst. Kreativität und das selbstbewußteGehirn. Münster: Daedalus; 2008.)
Related posts: Analog Signal Recording Principles
EEG of Degenerative Disorders of the Central Nervous System
Metabolic Disorders and EEG
Anticipating Seizures Based on EEG
Intracranial Monitoring: Depth, Subdural, and Foramen Ovale Electrodes
EEG Event-Related Desynchronization (ERD) and Event-Related Synchronization (ERS) Analog Signal Recording Principles
EEG of Degenerative Disorders of the Central Nervous System
Metabolic Disorders and EEG
Anticipating Seizures Based on EEG
Intracranial Monitoring: Depth, Subdural, and Foramen Ovale Electrodes
EEG Event-Related Desynchronization (ERD) and Event-Related Synchronization (ERS)
Stay updated, free articles. Join our Telegram channel
Full access? Get Clinical Tree
 Get Clinical Tree app for offline access

|