CHAPTER 55 Neuroradiologic Evaluation for Epilepsy Surgery
Computed Tomography, Magnetic Resonance Imaging, and Functional Imaging (Diffusion Tensor Imaging, Positron Emission Tomography, and Functional Magnetic Resonance Imaging)
Magnetic Resonance Imaging
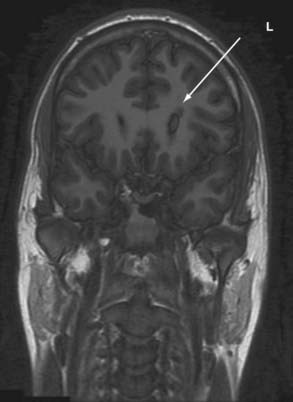
Because of its high sensitivity and excellent tissue contrast, MRI should be the first step in screening an epilepsy patient because it detects underlying structural pathology in as many as 75% of patients with refractory focal seizures. MRI is the primary imaging modality when a patient experiences the first seizure or when the clinician suspects epilepsy. Most centers will have performed screening studies that usually include T1-weighted (with contrast enhancement if a space-occupying lesion is suspected), T2-weighted, and fluid-attenuated inversion recovery (FLAIR) sequences in the axial, sagittal, and coronal planes. These studies can be sufficient to reveal focal pathology. If focal pathology as shown by MRI is concordant with that noted on electroencephalography (EEG), a better surgical outcome is achieved, and identifying a focal lesion in patients with refractory epilepsy remains one of the most important factors in determining surgical outcomes.1 However, if no focal lesion is seen and if EEG suggests a focal etiology, further MRI and other imaging studies should be performed.2 In recent years, detection of lesions with MRI has improved by optimizing scan protocols with the use of FLAIR sequences, diffusion-weighted images, and volume acquisition with three-dimensional reconstruction.
MRI protocols specific for epilepsy patients can differ but often include variations of the following3:
Recent imaging improvements include the following:
3 T and 7 T versus 1.5 T
Some lesions, such as cortical dysplasia, can be difficult to detect, and there is ongoing interest in using new advances in MRI, such as high-field and multichannel technology. It remains to be tested whether multichannel 3- or 7-T imaging can provide additional useful information. Increasing field strength from 1.5 to 3 and 7 T for the clinical evaluation of epilepsy has required optimization of imaging protocols but has shown that increased field strength improves the SNR and may therefore prove useful in the detection of cortical dysplasia. However, some have found that 1.5 T appears to be more sensitive in cases of tissue loss and mesial temporal sclerosis.8
Diffusion Tensor Imaging
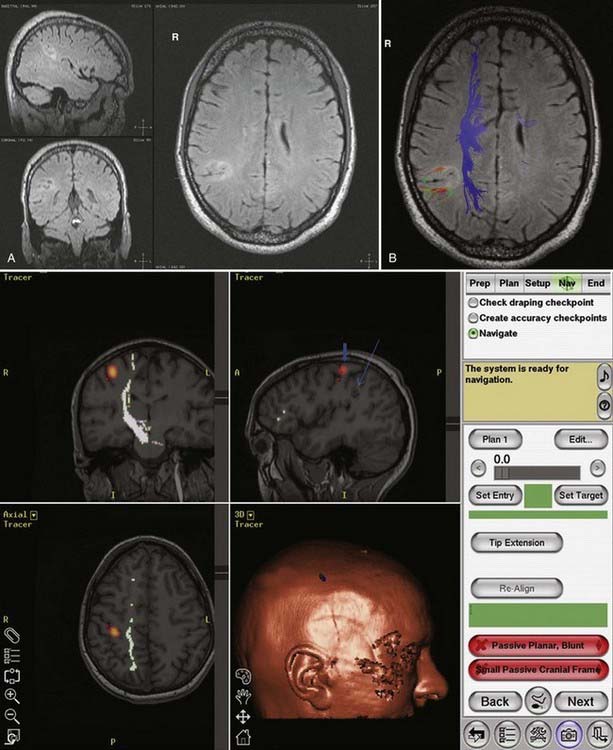
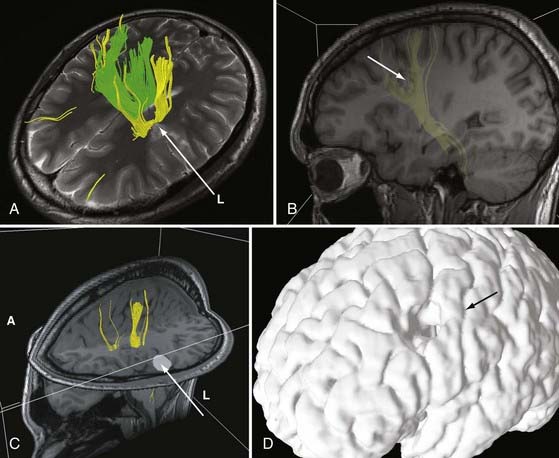
DTI, also known as “fiber tracking,” is an MRI modality that has allowed three-dimensional study of white matter fiber bundles at visible resolution (millimeters). Previously, white fiber (axonal) tracts were mapped post mortem by using specialized preparations or chemical techniques. DTI provides imaging of major white matter bundles connecting functional groups of neurons (Fig. 55-3). Computer analysis can connect fiber bundles in close relation to a planned surgical field such as the motor cortex to motor areas in the brainstem. DTI can therefore aid in planning surgery by avoidance of not only eloquent cortex but also the white matter tracts that connect functional areas.
Because white matter tract trajectories are complex, the use of DTI necessitates knowledge of the core or seed regions (voxels) of interest, specifically, where the tracts originate, where they pass through, and where they end. For example, when mapping the corticospinal tracts, the seed areas are the cortex in the motor area, the internal capsule, and the peduncles of the midbrain (Fig. 55-4). Placement of a seed area in the motor cortex is often preceded by fMRI to enable precise choice of the tracts of interest (Fig. 55-5).
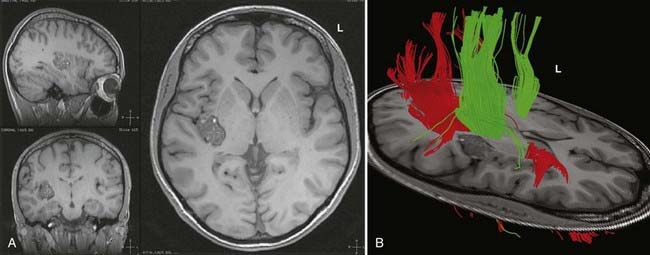
In clinical practice, it is probably not necessary to study more than 20 prominent tracts in the cerebrum and brainstem. Regions of special interest to the epilepsy surgeon are tracts that connect areas of special functional importance and include the corticospinal tracts, corpus callosum, arcuate and uncinate fasciculi, and the inferior orbitofrontal tract, the latter including the optic tract and Meyer’s loop. In recent years, papers and atlases have been published on white tract anatomy, placement of seed areas, and comparison of DTI with traditional white matter dissection.9,10 Recent advances include intraoperative DTI, in which real-time images of white matter tracts are generated during neurosurgical procedures and shifting of tracts as a result of surgery can be depicted.11 The role of DTI in neurosurgical practice is currently being defined.
Functional Brain Imaging
Magnetic Resonance Spectroscopy
MRS is a noninvasive functional neuroimaging tool that has been especially useful in studying hippocampal pathology. Hippocampal sclerosis is found by pathologic examination in 65% of patients with temporal lobe epilepsy and is characterized by loss of neurons, atrophy, and replacement gliosis.12 It can be seen by visual inspection or volumetric analysis and can be defined by MRI in 70% of cases.13 MRS allows in vivo analysis of neurochemicals and their metabolites. Attention has focused on proton [1H] MRS, which has principally yielded data on N-acetylaspartate (NAA), choline, phosphocreatine, creatine, and lactate; MRS quantifies metabolites from brain regions that have underlying cellular abnormalities. NAA, which is an amino acid synthesized in mitochondria, is a neuronal and axonal marker that decreases with neuronal loss or dysfunction. Decreased levels of NAA can be interpreted as cell loss or neuronal damage. Total creatine, composed of phosphocreatine and its precursor creatine, is a marker of brain energy metabolism. Total choline is a marker for membrane synthesis or repair, inflammation, or demyelination and can reflect astrocytosis. Studies have shown that in comparison to controls, the temporal lobe ipsilateral to the seizure focus shows a reduction in NAA signal intensity and an increase in creatine and choline signal. Reduction of the ratio of NAA to choline, creatine, and phosphocreatine is a marker for neuronal loss and dysfunction. This method has shown promise for localizing epileptic foci with underlying pathology that is not visible with other imaging modalities. However, routine use of MRS for epilepsy is declining in many centers as a result of the increased application and improvement of other imaging modalities.
Functional Mapping
Human brain mapping has produced new data that have added considerable information on the anatomy of specific cerebral functions. As already noted, there are two basic types of brain mapping methods for measuring brain function: first, techniques that detect electromagnetic activity (EEG and MEG) measure the electromagnetic fields generated by neural activity, and second, techniques that are based on hemodynamic or metabolic signals (PET and fMRI) measure signs of neural activity. These two methodologies differ, including their temporal and spatial resolution. fPET and fMRI produce data from most of the brain with a spatial resolution of a few millimeters and a temporal resolution of minutes (fPET) or seconds (fMRI). The electromagnetic techniques, in contrast, produce data with limited spatial resolution but with a temporal resolution of milliseconds. High temporal resolution is important to resolve rapidly the changing patterns of brain activity that underlie cerebral function. However, traditionally, EEG and MEG have provided insufficient spatial detail to identify relationships between electrical events, structures, and functions, as visualized by MRI, PET, or fMRI. It is hoped that combining the two technologies will provide increasing information on processing in the human brain.14 The rationale behind fPET and fMRI is to determine the spatial relationship between active eloquent brain areas and to identify the least traumatic neurosurgical approach. In the case of fPET, structural MRI images are required for coregistration.
Functional Magnetic Resonance Imaging
Applications of fMRI include mapping of eloquent cortex, particularly sensorimotor function and language. Baseline studies are carried out, followed by presentation of relevant tasks to the patient. It is hoped that in the future fMRI will replace the Wada test for memory and language and mitigate the need for intraoperative cortical mapping in certain cases.15 However, caution is necessary in comparing the localization of functions based on areas of brain activated, as with the use of fMRI, with areas inactivated by the Wada test or intraoperative stimulation mapping. There are also concerns of the accuracy of fMRI localization, which can be impaired by the low SNR (in comparison to fPET) and susceptibility to various artifacts, including movement during speech. Thus far, studies comparing fPET and fMRI in the same patient are rare.16
Positron Emission Tomography
PET records the accumulation of radioactively labeled compounds in regions of the brain. The radioactive compounds (tracers) follow the biochemical pathways of native molecules without altering the velocity of the reactions in these pathways. Although fMRI appears to be superseding fPET in terms of clinical use because of cost and availability, FDG-PET and fPET can assist in lateralization and localization of epileptogenic cortical areas (Fig. 55-6).
Functional Positron Emission Tomography
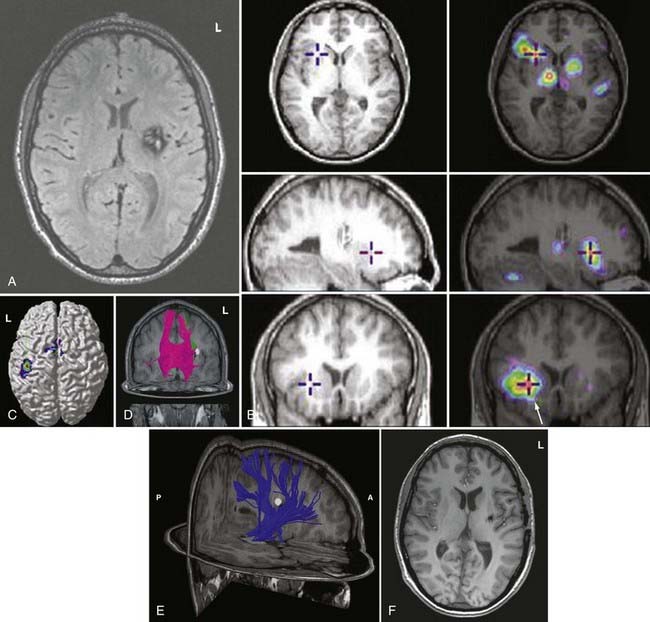
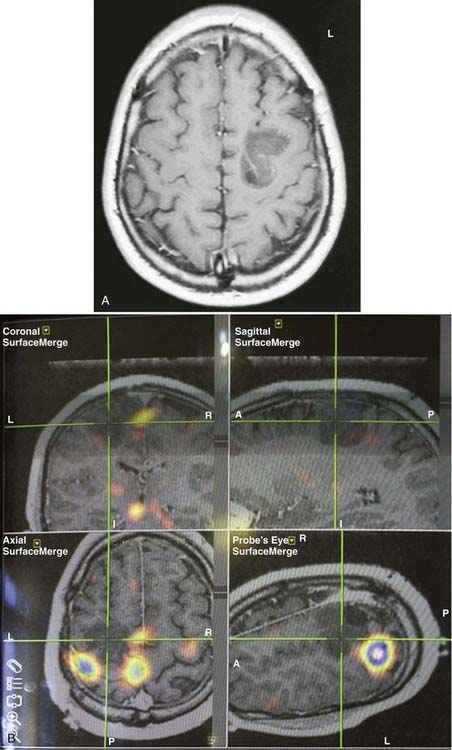
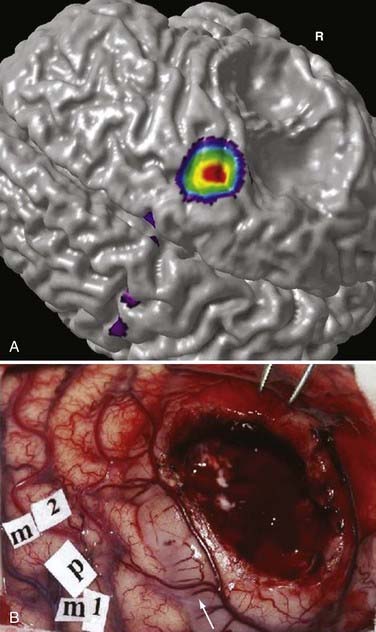
During functional activity, fPET shows significantly altered signals in comparison to a reference or baseline state. Functional activity results in altered signals in the region of interest, and fPET highlights the neuroanatomic correlates of changes in these processes by comparing the active state with the reference or baseline state. As in fMRI, activation typically involves sequential tasks contralateral to the lesion, such as thumb opposition, flexion-extension of the foot, or language tasks (Fig. 55-7). fPET is generally believed to be an accurate localization method that has demonstrated good correspondence with intraoperative cortical mapping methods and a high SNR. In fPET, uptake of radioactive water into the brain is proportional to blood flow during the first few minutes after the intravenous injection of [15O]H2O, and blood flow is assumed to change in proportion to functional activity.
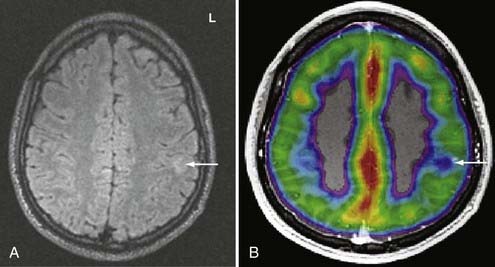
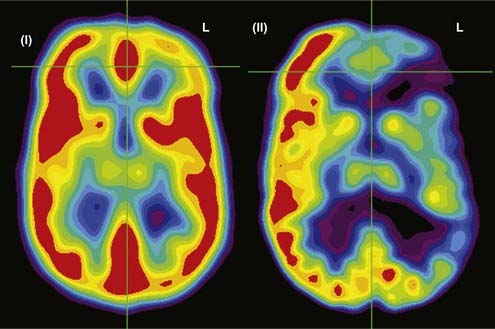
FDG-PET has been found to be useful in nonlesional epilepsy by interictally locating areas of reduced glucose consumption (Fig. 55-8). This has been found to enhance the treatment of patients with cortical dysplasia.17 Others have found that FDG-PET asymmetry such as left temporal lobe hypometabolism can predict verbal memory after temporal lobectomy.18 Recent studies have indicated that FDG-PET can detect interictal hypometabolism in areas of cortical dysplasia in 81% of cases and has been found to be useful in identifying epileptogenic regions in patients with tuberous sclerosis.19,20 PET remains of value in the diagnostic work-up of patients with epilepsy because of its simplicity, speed of performance, accuracy, and comfort in patients. There are usually no concerns for claustrophobic or overweight patients or those who have metal implants. Radioactivity is not commonly an issue because of its low concentration and the short half-life of positron-emitting isotopes.
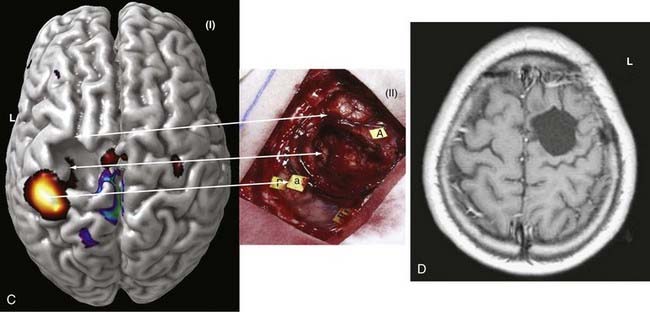
In summary, functional brain-imaging techniques can support the presurgical diagnosis, especially in patients with nonlesional MRI findings or nonlateralizing or localizing scalp EEG recordings. Intraoperative cortical mapping is facilitated because eloquent areas are mapped preoperatively and coregistered to the surgical navigational system. They aid in planning surgery and can serve as a basis for discussion with patients and families (Fig. 55-9).
Magnetoencephalography and Magnetic Source Imaging in the Presurgical Evaluation for Epilepsy
Fundamentals of Neuromagnetism
MEG measures the extracranial magnetic field activity arising from the electric currents produced in the brain. This activity arises largely from intracellular neuronal currents in the dendrites of tangentially oriented cortical pyramidal cells. MEG represents the magnetic signals corresponding to the brain’s electrical activity recorded with standard EEG.21–25 MEG is based on a fundamental principle of electromagnetism, namely, that for every electric current, there is a corresponding magnetic field. Applying the “right-hand rule” of electromagnetism, for every electric dipole, the corresponding magnetic field wraps around the dipole with the field flowing toward or away from the MEG detector in a counterclockwise fashion.26 Much like its EEG counterpart, the majority of the magnetic signal produced by the brain arises from aligned groups of pyramidal cells in the six-layered cerebral cortex.27 Because the detectors that measure the MEG signals are usually aligned perpendicular to the skull, MEG best detects the fields that arise from tangentially oriented current dipoles perpendicular to the cortical surface.25,26,28,29
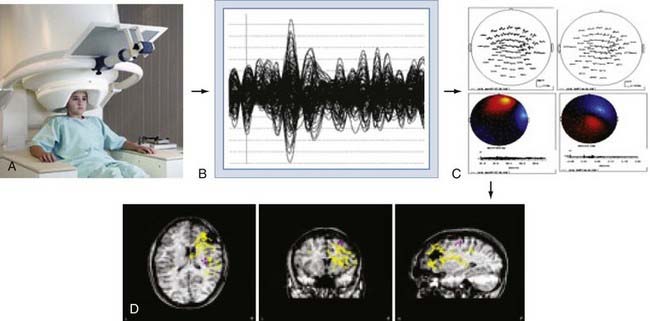
The brain’s magnetic fields are incredibly small, typically in the pico-tesla (10−12) range. In contrast, the magnetic field activity of the earth itself is approximately 1 billion times (109) larger, ambient environmental sources such as room lighting and electric power lines are 105 to 106 times larger, and even those of the human heart are 102 times larger. SQUID detectors2 must be used to measure these tiny magnetic fields (see elsewhere for further details25,27). These detectors are kept at very cold temperatures by bathing them in liquid helium in a magnetically shielded Dewar flask. Early MEG systems consisted of a single SQUID detector or small arrays of 3 to 7 detectors that were moved about the head to different positions during a recording session lasting several hours.30 This would be equivalent to recording scalp EEG signals by moving a single EEG electrode from site to site on the scalp. Modern systems (Fig. 55-10A) consist of a whole-head helmet containing 36 to 240 or more detectors that simultaneously record MEG signals, again much the way that an EEG electrode montage records EEG signals from multiple brain sites simultaneously. These large sensor arrays allow recording of whole-brain activity, thereby providing excellent temporal and spatial resolution of brain activity.
Magnetic Source Imaging
MEG signals are collected as traces of data much the way that EEG traces are collected. The majority of MEG data represent background brain activity and are of little clinical interest. However, MEG activity that is either provoked by a stimulus (evoked potential)31–34 or arises from epileptiform spike activity is of primary interest. Identification of these evoked or spontaneous potentials is performed by off-line review of the individual MEG tracings. This requires manual review by an experienced technician or physician, or it can be done with automated spike detection algorithms.35–37 Manual review with selection of spikes is the most reliable and commonly used method. Automated detection programs often identify more artifactual spikes, so automatically detected spikes must be interpreted with some caution. Once a spike has been detected, the MEG tracings from all channels for the time period of that spike are displayed in the anatomic location of the sensor from which it was detected, thereby creating a “spike map.” This map is then subjected to a process of dipole modeling in which various mathematical solutions are tested to identify the single best location for the current dipole that matches the pattern of MEG traces recorded around the brain. The most commonly used method is the “single equivalent dipole” (SED) model, in which it is assumed that any given pattern arises from a single brain area and that simultaneous spikes in distinct regions do not occur. More complex models involving other estimation methods, such as local minima, known anatomic features, and consideration of the skull as a multilayered structure with varying conductivities,38–41 have been used more recently, although none have proved clearly superior in a clinical setting, and the SED model is the only Food and Drug Administration–approved algorithm for routine clinical use.
Once the MEG dipoles have been localized, they are superimposed on a brain MRI scan that has been coregistered to the MEG channels based on a set of fiducial markers to create a visual dipole map of the brain. This process is commonly referred to as magnetic source imaging (MSI) and represents the primary method by which MEG data are used in clinical and research settings. For most applications, the terms MEG and MSI are functionally interchangeable, although MSI is the preferred term for the complete process of data processing and display. An overview of this process is shown in Figure 55-10.
Magnetic fields are not significantly altered by passing in and out of the skull, whereas electric fields are “smeared” by conduction through the volume of the multilayered skull, analogous to the diffraction or bending of light going from air to water. Thus, localization with MSI is generally thought to be more spatially accurate and reliable than EEG source localization.42 Recent investigations using more complex modeling methods are challenging this assumption, however.43–45
Uses of Magnetic Source Imaging
Early investigators saw that the clinical utility of MEG, for instance in comparison to EEG, would depend on the specific situation. Because MSI depends on the identification of event-specific spike activity, it is primarily useful for identifying the location of evoked brain activity or interictal epileptiform discharges. MSI has proved to be a highly reliable and reproducible method to identify and map the primary sensory cortex.30,46–49 It can map the sensory homunculus with extreme precision and is superior to fMRI in this regard.30,46,50–52 Similarly, MSI has been used to identify regions of receptive and expressive language.53–57 These studies rely on the later component of the MEG signal in response to an evoked stimulus because the early component (100 msec) represents activation of primary auditory cortex whereas the late component (150 to 700 msec) is specific to brain regions involved in language processing. Several language paradigms have been developed that primarily identify receptive language areas, and some groups have confirmed the results with intraoperative or intracranial EEG (ICEEG) language stimulation mapping. MSI has been proposed as an alternative to the intracarotid sodium amobarbital test for determining hemispheric language dominance.57,58 Reliable reproduction of these methods has proved challenging, with significant patient-to-patient variability, although this method is promising. Because of the relative lack of availability of MSI and the inability to test for memory preservation, it is unlikely that MSI will supplant the intracarotid sodium amobarbital (Wada) test completely in the near future.
MSI has also been used as a method to identify brain regions involved in higher cortical functions such as visual and thought processing.47,56 This application closely parallels work that has been carried out with fMRI- or EEG-based event-related potentials. Because MSI provides temporal resolution superior to that achieved with fMRI and measures neural activity rather than blood flow–related changes, it may be superior to fMRI for source localization. MSI has also been used in the study of psychiatric disorders.59,60
Epilepsy
Since its earliest introduction, a principal application of MSI has been to identify seizure foci.33,61 In approximately 30% of patients, anticonvulsant medications cannot control their epilepsy, and about half of these patients are probably good candidates for seizure surgery. Focal excisional surgery has the highest chance of curing patients with intractable epilepsy, but it depends on accurate identification of the zone of seizure origin. The use of ICEEG monitoring with depth electrodes and subdural or epidural grid electrodes has resulted in a 36% increase in the number of patient who can benefit from seizure surgery. However, ICEEG monitoring is invasive, carries major surgical risks, and is time-consuming. The principal advantage of prolonged ICEEG monitoring is capture of stereotypic seizures on EEG and localization of the zone of origin with great precision. Although MSI can record true ictal events,49,61–64 this is relatively rare because of the practical limitations of prolonged recording in an MEG unit. MSI does routinely capture interictal epileptiform discharges (“spikes”), which represent spontaneous brain irritability and often originate near the zone of seizure origin.36,58,65–68 Thus, MSI has been used to identify the ictal zone indirectly and to help guide the placement of ICEEG electrodes for definitive identification of the ictal onset region.36,45,51,58,65–68
The accuracy of MEG localization has best been validated by studies comparing MEG spikes with simultaneously recorded ICEEG. These studies have demonstrated that a 2- to 4-cm2 region (two to three EEG contacts on a standard grid) on the cortical surface must be activated to detect an MEG spike69 and greater than a 6-cm2 region for spikes in the basal temporal lobe.70 Controlled studies with implanted dipoles have demonstrated that MEG-identified localizations were within about 1 to 2 cm of the true location, with greater errors for deeper sources.71 For afterdischarge spikes recorded simultaneously on ICEEG with implanted subdural grids, MEG localization was within 12 mm72 for lateral temporal spikes but up to 4 cm away for mesial temporal source spikes.73 The large amount of tissue that must be activated on the medial temporal lobe indicates that few MSI spikes will reflect activation of the mesial temporal lobe or other deep structures, and therefore the MSI results are limited to regions that can be accurately sampled, namely, detection and localization of spikes close to the dorsolateral cortical surface. This does not mean that MEG has no predictive value for mesial frontal or temporal lobe epilepsy but simply that the source localizations cannot be relied on to identify the ictal zone with the same confidence that can be applied in dorsolateral neocortical cases.
Mesial Temporal Lobe Epilepsy
Mesial temporal lobe epilepsy originates from deep structures such as the amygdala and hippocampus, which are situated at least 3 to 4 cm below the cortical surface. Because of the intrinsic limitation of MEG for detecting such deep sources, MEG/MSI has not proved to be particularly useful for accurately identifying these deep sources.74 However, correlative studies have implicated the orientation of the MEG dipoles as a potential predictor of outcome after temporal lobe surgery. In one study, correlation with ICEEG demonstrated that patients with vertically oriented anterior temporal dipoles tended to have mesial temporal seizure onsets whereas those with horizontally oriented dipoles had more basal or temporal polar origins.65,75 Posterior vertically oriented dipoles were strongly correlated with lateral temporal lobe (neocortical) onset. This study suggests that dipole orientations are of greater value than actual dipole localization for temporal lobe epilepsy. Other studies have suggested that patients with more than 70% of the MEG spikes localized to the anterior temporal lobe are much more likely to become seizure free after lobectomy than are patients with spikes in the posterior temporal lobe.76


Stay updated, free articles. Join our Telegram channel

Full access? Get Clinical Tree


