NATURAL HISTORY OF PRIMARY HYPERTENSION
The natural history of hypertension, simplistically depicted in Figure 4-1, starts when some combination of hereditary and environmental factors sets into motion transient but repetitive perturbations of cardiovascular homeostasis (prehypertension), not enough to raise the blood pressure (BP) to levels defined as abnormal but enough to begin the cascade that, over many years, leads to BPs that usually are elevated (early hypertension). Some people, abetted by lifestyle changes, may abort the process and return to normotension. The majority, however, progress into established hypertension, which, as it persists, may induce a variety of complications identifiable as target organ damage and disease.
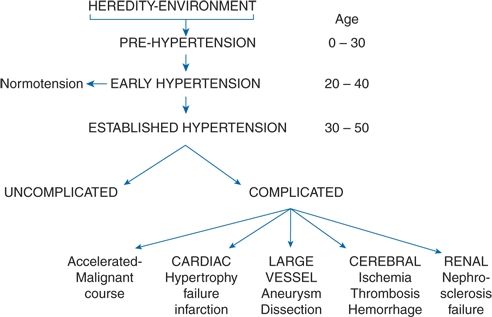
FIGURE 4-1 Representation of the natural history of untreated essential hypertension.
As was noted in Chapter 1, the higher the BP and the longer it remains elevated, the greater the morbidity and mortality. Although some patients with markedly elevated, untreated BP never have trouble, we have no way of accurately identifying in advance those who will have an uncomplicated course, the few who will enter a rapidly progressing, accelerated-malignant phase, and the many who will more slowly but progressively develop cardiovascular complications. Even without such foreknowledge, as BP and other risk factors are increasingly being treated, rates of morbidity and mortality related to hypertension have fallen (Go et al., 2013). Evidence for these changes is provided in Chapter 5 and the methods to achieve them in Chapters 6 and 7.
It should be noted that the role of hypertension probably is underestimated from morbidity and mortality statistics, which are largely based on death certificates. When a patient dies from a stroke, a heart attack, or renal failure—all directly attributable to uncontrolled hypertension—the stroke, the heart attack, or the renal failure, but not the hypertension, usually is listed as the cause of death.
PREHYPERTENSION
The natural history of hypertension starts with normal BP, i.e., below 120/80 mm Hg, that typically slowly rises until middle age when hypertension, i.e., 140/90 mm Hg or higher, appears. In many people, only the systolic rises with further aging, inducing ISH, which is the most common form of hypertension in people over age 50 (Cheng et al., 2012).
As perhaps best seen in data from the Framingham cohort shown in Figure 4-2, the BP tends to track over many years, remaining in the same relative position over time (Franklin et al., 1997). Subjects in each BP segment tend to remain in that segment, with a slow, gradual rise over the 30 years of follow-up. In a later survey of the Framingham population, hypertension developed over a 4-year interval in only 5% of men and women with BP less than 120/80 mm Hg, in 18% with a BP less than 130/85 mm Hg, and in 37% with a BP 130 to 139/85 to 89 mm Hg (Vasan et al., 2001).
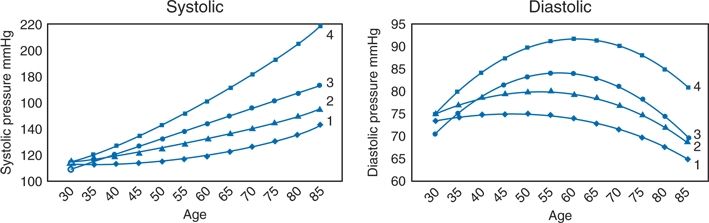
FIGURE 4-2 Tracking systolic and diastolic BPs by age for up to 30 years in the Framingham Heart Study. Subjects who were stratified by their systolic BP in middle age: less than 120, 120 to 139, 140 to 159, and less than 160 mm Hg. The curves are derived from averaged individual regression analysis. (Modified from Franklin SS, Gustin W IV, Wong ND, et al. Hemodynamic patterns of age-related changes in blood pressure: The Framingham Heart Study. Circulation 1997;96:308–315.)
Naturally, the progressive rise in pressure proceeds from 120/80 to 140/90 mm Hg through levels that were traditionally labeled “high–normal.” However, more and more evidence shows the appearance of cardiovascular risk factors and even target organ damage among these people (Shen et al., 2013). Therefore, the 2003 Joint National Committee (JNC-7) report introduced the term “prehypertension” to cover those with sustained BP levels from 120/80 to 139/89 mm Hg (Chobanian et al., 2003). Although “prehypertension” was not accepted in the 2013 European guidelines (Mancia et al., 2013), the term should be recognized for the rationale stated in JNC-7:
Prehypertension is not a disease category. Rather it is a designation chosen to identify individuals at high risk of developing hypertension, so that both patients and clinicians are alerted to this risk and encouraged to intervene and prevent or delay the disease from developing. The goal for individuals with prehypertension and no compelling indications is to lower BP to normal with lifestyle changes and prevent the progressive rise in BP.
Prevalence
As many or more people are prehypertensive as are hypertensive, with an average number in surveys of the United States (U.S.) population of 60 million (Elliott & Black, 2007).
Predictors
Since prehypertension is one step toward hypertension, the same factors are involved in the development of both. Obesity is foremost, with male gender and black race also involved (Franklin et al., 2005; Toprak et al., 2009). In addition, these factors are associated with more prehypertension: diabetes, impaired glucose tolerance, the metabolic syndrome, dyslipidemia, and smoking (Elliott & Black, 2007; Parikh et al., 2008).
Associations
As best portrayed in the Prospective Studies Collaboration (Lewington et al., 2002), an increase in BP from 115/75 to 135/85 mm Hg doubles the mortality rate for both ischemic heart disease and stroke (see Fig. 1-1 in Chapter 1). The evidences for target organ damage in prehypertension include these:
- Left ventricular hypertrophy (LVH) (Kokkinos et al., 2007)
- Coronary calcification (Pletcher et al., 2008)
- Reduced coronary flow reserve (Erdogan et al., 2007)
- Progression of coronary atherosclerosis (Sipahi et al., 2006)
- Increases in ischemic coronary disease and stroke (Lee et al., 2011)
- Poor cognitive function (Knecht et al., 2008)
- Retinal vascular changes (Nguyen et al., 2007)
- Proteinuria (Konno et al., 2013)
- Renal arteriosclerosis (Ninomiya et al., 2007)
- Elevated serum uric acid (Cicero et al., 2014)
- Increased levels of various markers of cardiovascular risk, including C-reactive protein (Bo et al., 2009)
With all of these indices of impending or existing target organ damage, attempts have been made to prevent prehypertension or at least to slow its progression into hypertension. As described more fully in Chapters 6 and 7, these have focused on lifestyle changes (Bavikati et al., 2008), but the difficulties in achieving lasting effects from lifestyle changes have led to trials of antihypertensive drugs (Julius et al., 2006; Luders et al., 2008; Skov et al., 2007).
EARLY HYPERTENSION: COURSE OF THE BLOOD PRESSURE
In most people who become hypertensive, the hypertension persists, but in some, the BP returns to normal, perhaps not to rise again. As emphasized in Chapter 2, hypertension should be confirmed by multiple readings, preferably taken out of the office, before the diagnosis is made and therapy is begun. If subsequent readings are considerably lower and the patient is free of obvious vascular complications, the patient should be advised to adhere to a healthy lifestyle and either to return every few months for repeat BP measurement or to self-monitor the BP at home.
The wisdom of this course is shown by data from an Australian therapeutic trial (Management Committee, 1982); 12.8% of the patients whose diastolic BPs averaged more than 95 mm Hg on two sets of initial readings obtained 2 weeks apart had a subsequent fall to less than 95 mm Hg that persisted over the next year, such that the patients could not be entered into the trial. An even larger portion (47.5%) of those who entered the trial with a diastolic BP above 95 mm Hg and who received only placebo tablets for the next 3 years maintained their average diastolic BP at less than 95 mm Hg. A significant portion remained below 90 mm Hg while on placebo, including 11% of those whose initial diastolic BP was as high as 105 to 109 mm Hg. On the other hand, 12.2% of the placebo-treated patients experienced a progressive rise in diastolic BP to more than 110 mm Hg.
From these data and others that will be described, a number of implications can be made:
- Multiple BP readings, preferably out of the office, over at least 6 weeks may be needed to establish the diagnosis of hypertension.
- Many patients who are not given antihypertensive drugs will have a significant decline in their BP, often to levels considered safe and not requiring therapy.
- Patients who are at low overall cardiovascular risk and free of target organ damage and whose diastolic BPs are lower than 90 mm Hg can safely be left off active drug therapy.
- If not treated, patients must be kept under close observation since a significant number will have a rise in pressure to levels requiring active therapy.
ESTABLISHED HYPERTENSION
As delineated in Chapter 1 and shown in Figure 1-1, the long-term effects of progressively higher levels of BP on the incidence of stroke and coronary heart disease (CHD) are clear: In 61 prospective observational studies involving almost 1 million people with BP starting as low as 115/75 mm Hg who were followed for up to 25 years, the associations were “positive, continuous, and apparently independent” (Lewington et al., 2002).
Untreated Patients in Clinical Trials
The best data on the course of untreated hypertension are derived from those patients who served as the control populations in the trials of the therapy of hypertension up to the mid-1990s, at which time placebo-controlled trials were no longer considered ethical, with the exception of one in the very elderly wherein no data were available, the HYVET trial (Beckett et al., 2008). Although these trials were not designed to observe the natural history of hypertension, their data can help to define further the course of untreated disease (Table 4-2). The trials involving elderly patients are considered separately.
TABLE 4-2 Complications Among Control Groups in Trials of Nonelderly Hypertensives
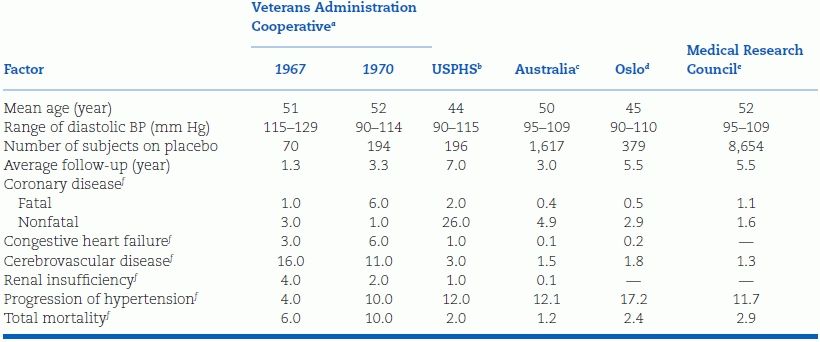
USPHS, U.S. Public Health Service.
aData from Veterans Administration Cooperative Study Group on Antihypertensive Agents. Effects of treatment on morbidity in hypertension. JAMA 1967;202:116–122;1970;213:1143–1152.
bData from Smith WM. Treatment of mild hypertension. Circ Res 1977;40(Suppl 1):98–115.
cData from Management Committee. The Australian therapeutic trial in mild hypertension. Lancet 1980;1:1261–1267.
dData from Helgeland A. Treatment of mild hypertension. Am J Med 1980;69:725–732.
eData from Medical Research Council Working Party. Medical Research Council trial of treatment of mild hypertension. Br Med J 1985;291:97–104.
fData reported as rate per 100 patients for the entire trial.
The types of patients included in these randomized, controlled trials (RCTs) and the manner in which they were followed up differ considerably, so comparisons between them are largely inappropriate. Moreover, the patients enrolled in these RCTs were, in general, much healthier than the general population. In most, they had to be free of major debilities and, often, any coexisting diseases, such as diabetes. For example, only 1.1% of those screened were eligible for enrollment in the Systolic Hypertension in the Elderly Program (SHEP) trial (SHEP Cooperative Research Group, 1991). Therefore, the rate of complications seen during the few years of follow-up on no therapy can be considered the minimum. In the overall population, much higher rates of cardiovascular diseases (CVDs) would be expected, and the dangers of untreated hypertension would obviously expand over a longer time. More about these trials is covered in Chapter 5.
Untreated Elderly Patients in Trials
Table 4-3 summarizes data from eight RCTs of elderly hypertensives, two of them (SHEP Cooperative Research Group [1991] and the Systolic Hypertension in Europe Trial [Staessen et al., 1997]) including only patients with ISH, the others including a portion with ISH. The control patients in these trials had much higher rates of the various end points than were seen in the trials of younger hypertensives listed in Table 4-2.
TABLE 4-3 Complications Among Control Groups in Trials of Elderly Hypertensives
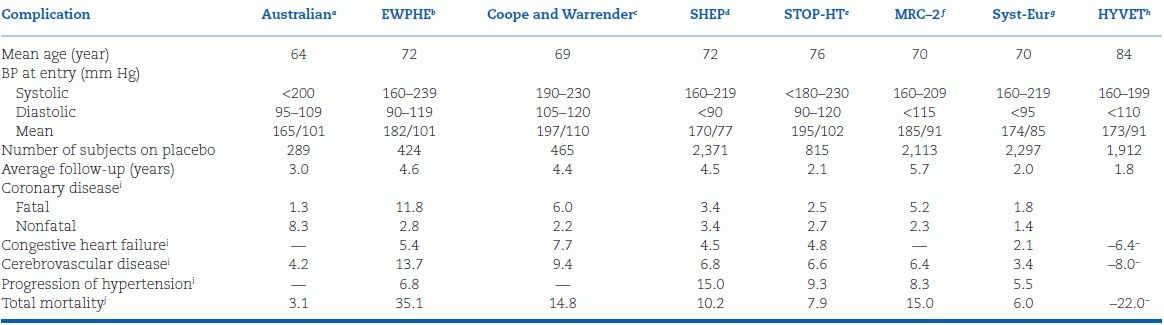
EWPHE, European Working Party on Hypertension in the Elderly; MRC, Medical Research Council; SHEP, Systolic Hypertension in the Elderly Program; STOP-HT, Swedish Trial in Old Patients with Hypertension; Syst-Eur, Systolic Hypertension in Europe Trial.
aData from Management Committee. Treatment of mild hypertension in the elderly. Med J Aust 1981;2:398–402.
bData from Amery A, Birkenäger W, Brixko P, et al. Mortality and morbidity results from the European Working Party on High Blood Pressure in the Elderly Trial. Lancet 1985;1:1349–1354.
cData from Coope J, Warrender TS. Randomized trial of treatment of hypertension in elderly patients in primary care. Br Med J 1986;293:1145–1151.
dData from SHEP Cooperative Research Group. Prevention of stroke by antihypertensive drug treatment in older persons with isolated systolic hypertension. JAMA 1991;266:3255–3264.
eData from Dahlöf B, Lindholm LH, Hansson L, et al. Morbidity and mortality in the Swedish Trial in older patients with hypertension. Lancet 1991;338:1281–1285.
fData from Medical Research Council Working Party. Medical Research Council trial of treatment in older adults. Br Med J 1992;304:405–412.
gData from Staessen JA, Fagard R, Thijs L, et al. Randomized double-blind comparison of placebo and active treatment for older patients with isolated systolic hypertension. Lancet 1997;350:757–764.
hData from Beckett NS, Peters R, Fletcher AE, et al. Treatment of hypertension in patients 80 years of age or older. N Engl J Med 2008;358: 1887–1898.
iData reported as rate per 100 patients for the entire trial.
jData in HYVET are rates per 100 patient-years.
Systolic Versus Diastolic Pressure
A meta-analysis of all published trials of elderly patients until 2000 (Staessen et al., 2000) reconfirmed what has been repeatedly shown in multiple observational studies: Rises in systolic levels and falls in diastolic levels, with the resultant widening of pulse pressure, are typical changes that occur with aging and all predict risk (Gu et al., 2014). As shown in Figure 4-3, risk of death rises steeply for every increment of systolic BP, but, at every level of systolic BP, the risk increases further the lower the diastolic BP.
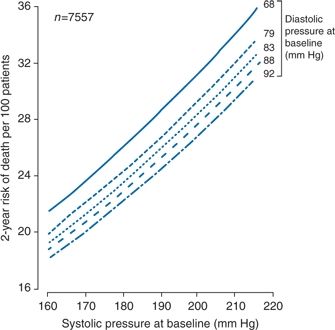
FIGURE 4-3 The 2-year probability of death associated with systolic BP at different levels of diastolic pressure at baseline in untreated elderly women with ISH but no prior cardiovascular complications enrolled in eight RCTs. (Modified from Staessen JA, Gasowski J, Wang JG, et al. Risks of untreated and treated isolated systolic hypertension in the elderly. Lancet 2000;355:865–872.)
From these multiple sources, the picture of the natural history of hypertension shown in Figure 4-1 is derived. We now will examine the various complications shown at the bottom of that figure.
COMPLICATIONS OF HYPERTENSION
The end of the natural history of untreated hypertension is an increased likelihood of premature disability or death from CVD. Before considering the specific types of organ damage and the causes of death related to hypertension, the underlying basis for the arterial pathology caused by hypertension and the manner in which this pathology is expressed clinically will be examined.
Types of Vascular Lesions
As described in Chapter 3, the pathogenesis of combined systolic and diastolic hypertension involves structural changes in the resistance arterioles subsumed under the terms remodeling and hypertrophy. As people age, large artery atherosclerosis becomes an increasing factor, aggravated by the high shear stress of hypertension (Lakatta & Levy, 2003). Small-vessel arterial and arteriolar sclerosis may be considered secondary consequences of combined systolic–diastolic hypertension, whereas large-vessel atherosclerosis is primarily responsible for the predominantly systolic hypertension so common among the elderly.
Most of the premature morbidity and mortality associated with hypertension is related to atherosclerosis. Although usually only one of the multiple risk factors involved, hypertension has an independent role (Vernooij et al., 2013). There are variable rates of atherosclerotic stiffness between genders (Waddell et al., 2001) and ethnic groups (Chaturvedi et al., 2004), which may explain the variability in vascular damage between them (Daugherty et al., 2013).
Causes of Death
Death may result when these arterial lesions either rupture or become occluded enough to cause ischemia or infarction of the tissues they supply. The causes of death in hypertensives, mostly from series published before the availability of effective therapy, can be summarized thusly:
- CVDs are responsible for a higher proportion of deaths as the severity of the hypertension worsens.
- Heart disease remains the leading cause of death overall, but strokes become increasingly more common in populations over age 65 (Kjeldsen et al., 2001).
- Heart failure becomes increasingly common in the elderly (Rodeheffer, 2011).
TARGET ORGAN INVOLVEMENT
We will now examine in more detail the pathophysiology and consequences of these various complications. Thereafter, the clinical and laboratory manifestations of the target organ damage will be incorporated into guidelines for evaluating the hypertensive patient.
Hypertensive Heart Disease
Hypertension more than doubles the risk for symptomatic coronary disease, including acute myocardial infarction (MI) and sudden death, and more than triples the risk for congestive heart failure (CHF) (Kannel, 1996). As shown in Figure 4-4, hypertension, usually in concert with a number of other risk factors, often leads to LVH and/or myocardial ischemia and/or infarction. These processes, in turn, precipitate systolic and diastolic dysfunction, which often progresses to overt CHF (Drazner, 2011).
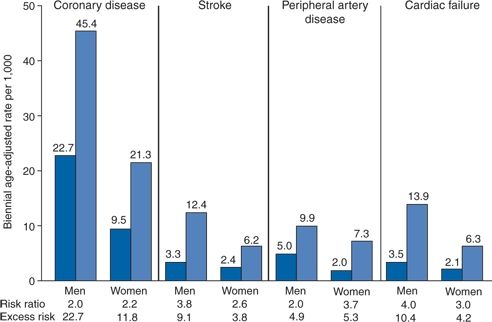
FIGURE 4-4 Risk of cardiovascular events by hypertensive status in subjects aged 35 to 64 years from the Framingham study at 36-year follow-up. Coronary disease includes clinical manifestations such as Ml, angina pectoris, sudden death, other coronary deaths, and coronary insufficiency syndrome; peripheral artery disease is manifested as intermittent claudication. Left bars in each set of columns represent normotensives; right bars represent hypertensives. (Modified from Kannel WB. Blood pressure as a cardiovascular risk factor. JAMA 1996;275:1571–1576.)
Left Ventricular Hypertrophy
Prevalence
Whereas LVH is identified by electrocardiography in only 5% to 18% of hypertensives, dependent on the criteria used (Ang & Lang, 2008), when present by ECG, LVH predicts strokes (Ishikawa et al., 2009) and accompanies renal damage (Peterson et al., 2013). LVH is found by echocardiography in many more hypertensive adults, in as many as 30% of unselected hypertensives, and in up to 90% of persons with severe hypertension (Schmieder & Messerli, 2000). More LVH is seen with obesity, high dietary sodium intake, anemia of end-stage renal disease (ESRD), alcohol abuse, diabetes, and hypercholesterolemia (de Simone et al., 2001). Despite its cost, echocardiography is recommended in the 2013 European guidelines as part of the initial evaluation of all hypertensives (Mancia et al., 2013).
Associations
The association between LVH and hypertension is stronger for systolic levels, which contribute most of the relation between pulse pressure and LVH (Mule et al., 2003). Increased pulse pressure is related to LV mass independent of other pressure components (de Simone et al., 2005). In addition to the stress and strain invoked by increased BP per se, other factors contribute, including the following:
- Genotype, which is a likely mechanism for the higher prevalence of LVH in black than in white hypertensives (Kizer et al., 2004).
- A polymorphism of the angiotensin type 2 receptor gene (-332G/A) (Alfakih et al., 2004).
- An important role of the renin–angiotensin system is supported by the impressive effect of ACEIs and ARBs in causing regression of LVH and preventing remodeling after an MI (Kenchaiah et al., 2004).
- In women, but not in men, an association between serum aldosterone and cardiac remodeling (Vasan et al., 2004) that could reflect increased renin–angiotensin activity.
- In view of the profibrotic effects of aldosterone described in Chapter 3, this may be involved in the increased collagen type 1 synthesis noted in patients with hypertensive heart failure (Querejeta et al., 2004).
- Increased cardiac sympathetic nervous activity (Schlaich et al., 2003).
- Higher nighttime BP level (Cuspidi et al., 2013).
Patterns
The patterns of LVH differ by the type of hemodynamic load: Volume overload leads to eccentric hypertrophy, whereas pure BP overload leads to an increase in LV wall thickness without concomitant increase in cavity volume, i.e., concentric hypertrophy (Fig. 4-5).
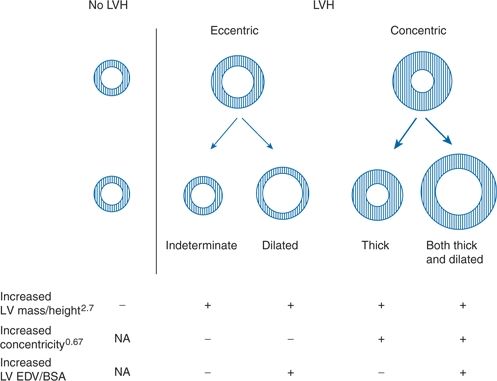
FIGURE 4-5 Diagrammatic representation of the conventional two-tiered classification and the newly proposed four-tiered classification of LVH. Outer circle represents mean LV mass; inner circle, mean end-diastolic volume. (Adapted from Khouri MG, Peshock RM, Ayers CR, et al. A 4-tiered classification of left ventricular hypertrophy based on left ventricular geometry: The Dallas Heart Study. Circ Cardiovasc Imaging 2010;3:164–171.)
In Bang et al.’s 2013 study of 939 patients with varying stages of hypertension, these percentages of various patterns were found by echocardiography: Normal geometry in 25%; concentric hypertrophy, nondilated in 29%, dilated in 14%; eccentric hypertrophy, nondilated in 12%, dilated in 20%.
Consequences
Even without LVH, hypertensives may have a significantly reduced coronary flow reserve from an impaired capacity for coronary vasodilation (Kawecka-Jaszcz et al., 2008). The presence of LVH is consistently and strongly related to subsequent cardiovascular morbidity and mortality (Krakoff, 2013). The increased risk for sudden death in hypertensives is likely connected to alterations in ventricular conduction and repolarization associated with LVH (Oikarinen et al., 2004).
Regression
Regression of LVH was noted in 52% of the 937 hypertensives treated for 4.8 years in the LIFE study (Gerdts et al., 2008). Regression reduces the risk of stroke (Verdecchia et al., 2006). The effects of various antihypertensive agents are covered in Chapter 7.
Systolic and Diastolic Dysfunction
de Simone et al. (2004) use the term “inappropriate” left ventricular mass (LVM) when the LVM exceeds the theoretical value predicted by gender, body size, and stroke work. Such excessive LVM translates into concentric LV geometry and both systolic and diastolic dysfunction that, in turn, are the predecessors for systolic and diastolic heart failure. Patients with asymptomatic LV systolic dysfunction are at increased risk of heart failure and death, even with only mildly reduced ejection fractions (Verdecchia et al., 2005). Similarly, diastolic dysfunction, defined as an echocardiographic normal ejection fraction but abnormal LV filling in an asymptomatic hypertensive with LVH, is a precursor to diastolic heart failure (Aurigemma & Gaasch, 2004).
Congestive Heart Failure
Hypertension is present in over two-thirds of patients who develop CHF (Yancy et al., 2006). Hypertension remains the major preventable factor in the disease that is now the leading cause of hospitalization in the U.S. for adults over age 65 (Hall et al., 2012). It is likely that antihypertensive drugs used in treatment do not completely prevent CHF but postpone its development by several decades and are responsible for the improved survival in CHF (Roger et al., 2004).
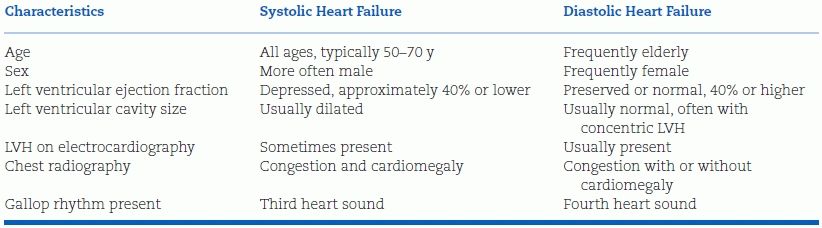
Most episodes of CHF in hypertensive patients are associated with diastolic dysfunction, as reflected in a preserved ejection fraction (Bursi et al., 2006) (Table 4-4). Vasan and Benjamin (2001) explain the susceptibility of hypertensives, particularly those with LVH, to diastolic heart failure in this manner:
When hemodynamically challenged by stress (such as exercise, tachycardia, increased afterload, or excessive preload), persons with hypertension are unable to increase their end-diastolic volume (i.e., they have limited preload reserve), because of decreased LV relaxation and compliance. Consequently, a cascade begins, in which the LV end-diastolic BP rises, left atrial pressure increases, and pulmonary edema develops.
TABLE 4-4 Characteristics of Patients with Systolic or Diastolic Heart Failure
Management of CHF in hypertensive patients is covered in Chapter 7.
Coronary Heart Disease
As described in Chapter 1, hypertension is quantitatively the largest risk factor for CHD. The development of myocardial ischemia reflects an imbalance between myocardial oxygen supply and demand. Hypertension, by reducing the supply and increasing the demand, can easily tip the balance.
Clinical Manifestations
Hypertension may play an even greater role in the pathogenesis of CHD than is commonly realized for two reasons. First, hypertensives suffer more silent ischemia (Boon et al., 2003) and painless MI (Kannel et al., 1985) than do normotensives. Second, preexisting hypertension may go unrecognized in patients first seen after an MI. Although acute rises in BP may follow the onset of ischemic pain, the BP often falls immediately after the infarct if pump function is impaired.
Once an MI occurs, the prognosis is worsened in the presence of both preexisting and subsequent hypertension (Thune et al., 2008). On the other hand, an increase in post-MI mortality has been noted among those with acute coronary syndrome and systolic pressure below 120 mm Hg on admission (Lee et al., 2013).
Atrial Fibrillation
In the presence of atrial fibrillation, more BP measurements are needed to ascertain the level of BP (Pagonas et al., 2013). The likelihood of atrial fibrillation increases with increasing age, levels of BP, LVM, and left atrial diameter. When present, atrial fibrillation increases the risk of intracranial bleeding during antithrombotic therapy (Manolis et al., 2013). The risk of atrial fibrillation was reduced by over 60% in hypertensives who were adequately treated (Young-Xu & Ravid, 2004).
Aortic Stenosis
Among 193 patients with symptomatic aortic stenosis, hypertension was present in 32% and the additional workload was likely responsible for symptoms developing at larger valve areas and lower stroke work loss (Antonini-Canterin et al., 2003). On the other hand, the severity of aortic stenosis may be masked by the presence of coexisting hypertension (Kaden & Haghi, 2008). In those with systemic hypertension and low gradient severe aortic stenosis with preserved ejection fraction, vasodilating antihypertensive therapy provided significant improvement (Eleid et al., 2013).
Large-Vessel Disease
Abdominal Aortic Aneurysm
The incidence of abdominal aortic aneurysms is increasing, likely as a consequence of the increasing number of elderly people who carry cardiovascular risks from middle age (Rodin et al., 2003). Since hypertension is one of these risk factors, onetime ultrasonographic screening is recommended for men over age 65 who have ever smoked (Earnshaw et al., 2004).
Aortic Dissection
As many as 80% of patients with aortic dissection have hypertension (Golledge & Eagle, 2008). The mechanism of dissection likely involves the combination of high pulsatile wave stress and accelerated atherosclerosis. The higher the pressure, the greater the likelihood of dissection.
Aortic dissection may occur either in the ascending aorta (proximal, or type A), which usually requires surgery, or in the descending aorta (distal, or type B), which usually can be treated medically (Golledge & Eagle, 2008). Hypertension is more frequently a factor with distal dissections, whereas Marfan syndrome, Ehlers-Danlos syndrome, and cystic medial necrosis are seen more frequently with the proximal lesion (Patel & Deeb, 2008).
Peripheral Vascular Disease
The presence of symptomatic PVD, usually manifested by intermittent claudication, poses a high risk of subsequent cardiovascular mortality (Arain & Cooper, 2008). By measurement of the ankle–brachial BP index (ABI) with a Doppler device, PVD was identified in 4.3% of U.S. adults over age 40, more frequently in those who were older, black, diabetic, smoker, or hypertensive (Selvin & Erlinger, 2004). Computerized tomographic angiography is the best procedure to establish the presence of PVD (Wennberg, 2013).
Takayasu Arteritis
Hypertension is present in nearly half of patients with Takayasu disease, an idiopathic, chronic inflammatory disease of large arteries that is reported most frequently in Japan and India (Weaver et al., 2004).
Carotid Artery Disease
The presence of a bruit over the carotid artery is indicative of twice the risk of MI and cardiovascular mortality compared with people who do not have a bruit (Pickett et al., 2008).
Increased carotid intima–media thickness is commonly used as a surrogate for hypertensive vascular disease and predicts the occurrence of ischemic strokes (Prati et al., 2008).
Cerebrovascular Disease
Stroke is the second leading cause of death worldwide, the leading cause of permanent neurologic disability in adults, and the most common indication for use of hospital and chronic care home beds (Donnan et al., 2008). The stroke death rate is even higher among blacks who live in the southeastern U.S., a rate similar to that noted in numerous other groups with inadequate health care worldwide (Donnan et al., 2008). Mortality rates from stroke have fallen markedly from the 1950s to the present in most industrialized countries, attributable to improved control of risk factors including hypertension (Towfighi & Saver, 2011). However, the incidence of stroke will likely continue to increase largely related to the increasing number of elderly people (Ovbiagele et al., 2013).
Role of Hypertension
Even more than with heart disease, hypertension is the major cause of stroke. About 50% of strokes are attributable to hypertension, the risk rising in tandem with increasing BP (Beauchet et al., 2013). Hypertensives are at three to four times greater risk for stroke and those with BP above 130/85 at 1.5 times greater risk than are normotensives. Beyond stroke, hypertension is associated with an increase in the incidence of dementia, both vascular and Alzheimer’s (Faraco & Iadecola, 2013).
In hypertensives, nearly 80% of strokes are ischemic, caused by either arterial thrombosis or embolism, 15% are caused by intraparenchymal hemorrhage, and another 5% are caused by subarachnoid hemorrhage (Donnan et al., 2008). Transient ischemic attacks—acute episodes of focal loss of cerebral or visual function lasting less than 24 hours and attributed to inadequate blood supply—may arise from emboli from atherosclerotic plaques in the carotids or thrombi in the heart (Flemming et al., 2004) and are followed by a high risk of stroke (Daffertshofer et al., 2004).
ISH in the elderly is associated with a 2.7 times greater incidence of strokes than is seen in normotensive people of the same age (Qureshi et al., 2002). Elderly hypertensives more often have silent cerebrovascular disease (Vermeer et al., 2002) and cerebral white matter lesions on MRI (Verhaaren et al., 2013), which eventually may lead to brain atrophy and vascular dementia.
Brain microbleeds have been found in 15% of hypertensive patients, particularly in those with nocturnal hypertension detected by ambulatory monitors (Henskens et al., 2008). A widening pulse pressure during sleep is associated with a significantly increased risk of stroke (Kario et al., 2004), presumably reflecting the role of arterial stiffness (Laurent et al., 2003).
Whether hypertensive or normotensive before their stroke, the majority of stroke patients at the time they are first seen will have a transient elevation of BP that spontaneously falls within a few days (Venimos et al., 2004). Therefore, caution is advised in lowering the BP in the immediate poststroke period, as noted further in Chapter 7. On the other hand, as will be noted, long-term reduction of BP is the most effective protection against both initial and recurrent strokes (Donnan et al., 2008).
Cognitive Impairment and Dementia
Both high and low BPs are associated with impaired cognition even in the absence of clinically evident cerebrovascular disease (Birns & Kalra, 2009). A similar nonlinear relation has been noted with pulse pressure: Both excessively wide pulse pressure (reflecting arterial stiffness) and narrow pulse pressure (reflecting reduced cerebral perfusion) are associated with increased risk for Alzheimer disease and dementia (Qiu et al., 2003).
Renal Disease
Hypertension plays an important role in renal damage, whether manifested as proteinuria, reduced glomerular filtration rate (GFR), or progression to ESRD (Cozzolino et al., 2013).
Assessment
Microalbuminuria is widely recognized to be an early manifestation of renal damage from any cause (Cirillo et al., 2008). Even albumin levels below 30 mg/L or an albumin-to-creatinine ratio below 20 mg/g have been found to accompany and predict hypertension and CVDs (Danziger, 2008). The presence of microalbuminuria likely reflects the presence of hypertension since it has been noted even in prehypertensives without diabetes or atherosclerotic vascular disease (Hsu et al., 2009).
Estimated glomerular filtration rate (eGFR) based on formulas including serum creatinine is increasingly being used as an indicator of renal damage, independent of microalbuminuria but additive to its presence as predictors of cardiovascular risk (Hallan et al., 2007). Serum cystatin C levels, both in absolute terms and as a replacement for serum creatinine to estimate GFR may be used to assess renal function. Cystatin C is a protein that is freely filtered by the glomerulus but largely reabsorbed or catabolized by the tubular epithelial cells. Since its level is not dependent on muscle mass, it may be a better maker of renal function than serum creatinine (Bloomfield et al., 2013).
Consequences
As more extensively described in Chapter 9, conventional beliefs have linked hypertension and chronic kidney disease (CKD) as a two-way street: Hypertension causes CKD and CKD causes hypertension. A commonly accepted sequence for hypertension causing CKD is a loss of renal autoregulation, which normally attenuates the transmission of increased systemic pressure to the glomeruli (Bidani & Griffin, 2004). As a consequence, patients with renal damage have an increased risk of both progressive renal dysfunction and CVDs (Färbom et al., 2008). Moreover, reduction of BP can slow if not stop the progression of renal diseases and accompanying cardiovascular events (Blood Pressure Lowering Treatment Trialists’ Collaboration, 2013).
In the past, the progress of hypertension into CKD has been termed “hypertensive nephrosclerosis,” and this diagnosis was considered the second most common cause of CKD, below diabetic nephropathy. However, a common missense mutation in the APOL1 gene, originally attributed to the nearby MYH9 gene (Kao et al., 2008; Kopp et al., 2008), has been found in blacks from either south or west Africa (Skorecki & Wasser, 2013) and closely correlated with progression of renal disease (Parsa et al., 2013).
These findings have important clinical applications. In the African American Study of Kidney Disease and Hypertension (AASK) and Chronic Renal Insufficiency Cohort (CRIC) studies, intensive lowering of BP did not slow the progression of renal damage (Parsa et al., 2013). Renal risk variants in APOL1 were associated with the higher rates of ESRD and progression of CKD in the black patients in these two studies. The manner by which these genetic mutations contribute to hypertension and CRD remains unknown.
NATURAL HISTORY OF SPECIAL POPULATIONS
Before turning to evaluation, we describe groups of people whose hypertension, for various reasons, may follow a different course from that seen in the predominantly male, white, middle-aged populations observed in most clinical trials and long-term observational studies. These special groups include a major part of the hypertensive population: The elderly, women, blacks and other ethnic groups, diabetics, and the obese.
Elderly
Two patterns of hypertension are seen in the elderly: Combined systolic and diastolic—the carryover of primary (essential) hypertension common to middle age and ISH—the more frequent form in those over age 60. However, because the major consequences and, as is noted in Chapter 7, the therapy for both are quite similar, most of this discussion will not make a distinction between the two.
Prevalence of Hypertension
As noted in Chapter 1, whereas diastolic BPs tend to plateau before age 60 and drop thereafter, systolic BPs rise progressively. Therefore, the incidence of ISH—defined as systolic pressure of 140 mm Hg or more and diastolic pressure of 90 mm Hg or less—progressively rises with age. In the National Health and Nutrition Examination Survey III, the proportion of various types of hypertension seen with advancing age progressively shifted from diastolic and combined hypertension to ISH (Franklin et al., 2001). In those older than 60 years, ISH was the pattern of hypertension in 87% of those who were untreated. In Framingham, nearly half of those who developed ISH did not have antecedent diastolic hypertension and only 29% had a prior diastolic level of 95 mm Hg or higher (Franklin et al., 2005). Almost 90% of Framingham subjects who were normotensive at age 55 or 65 developed hypertension 20 years later (Vasan et al., 2002).
Risks of Hypertension
As seen in Table 4-3 in the data from the placebo-treated half of the elderly patients enrolled in eight RCTs over the last 20 years, mortality in elderly hypertensives is significant, particularly from strokes, even in the brief 2- to 5-year interval of these trials. As noted, the patients enrolled tend to be healthier than the general population, so the risks of both combined systolic–diastolic and ISH are even greater than shown in Table 4-3.
A different pattern appears in the very elderly who have more chronic debility. In the subjects aged 75 to 94 years followed up in the Framingham study, risks for all-cause and cardiovascular mortality increased at the lower levels of systolic BP (<120 mm Hg) (Kannel et al., 1997).
In addition to increased mortality seen with either low or high systolic BP in the very elderly, both are associated with the development of cognitive impairment (Waldstein et al., 2005).
Pathophysiology of Isolated Systolic Hypertension
The basic mechanism for the usual progressive rise in systolic BP with age is the loss of distensibility and elasticity in the large capacitance arteries, a process that was nicely demonstrated more than 75 years ago (Hallock & Benson, 1937) (Fig. 4-6). Increasing volumes of saline were infused into the tied-off aortas taken from patients at death whose ages ranged from the 20s to the 70s. The pressure within the aortas from the elderly subjects rose much higher with small increases in volume as compared to that in aortas from the younger subjects, reflecting the rigidity of the vessels.
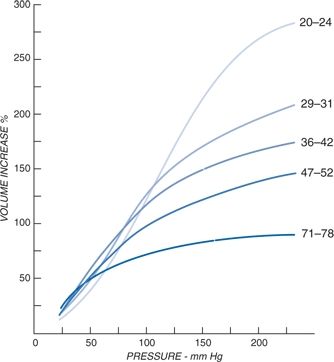
FIGURE 4-6 Curves showing the relation of the percentage of increase in pressure to the increase in volume infused into aortas excised at autopsy from people in five different age groups. The curves were constructed from the mean values obtained from a number of aortas. (Reprinted from Hailock P, Benson IC. Studies of the elastic properties of human isolated aorta. J Clin Invest 1937;16:595–602.)
Subsequently, the progressive rise in systolic pressure with age has been found to reflect a reduced cross-sectional area of the peripheral vascular bed and stiffer aorta and large arteries, producing an increased pulse wave velocity and an early return of pulse wave reflection in systole (Safar & Benetos, 2003). The early return of the reflected pressure wave augments aortic pressure throughout systole, increasing both systolic and pulse pressures, further increasing the work of the left ventricle while decreasing the diastolic aortic pressure that supports coronary blood flow (Pierini et al., 2000).
Postural Hypotension
As is covered in Chapter 7, therapy of hypertension in the elderly is vital but oftentimes must be tempered by the need first to overcome coexisting postural hypotension, defined as a fall in systolic pressure of 20 mm Hg or more after 1 minute of quiet standing.
Although there are multiple, mainly neurologic, causes for this problem (Ejaz et al., 2004), the only predisposing factor for postural hypotension found in an unselected elderly population was hypertension (Räihä et al., 1995). As seen in Figure 4-7, the higher the basal supine systolic BP, the greater was the tendency for a postural fall (Lipsitz et al., 1985).
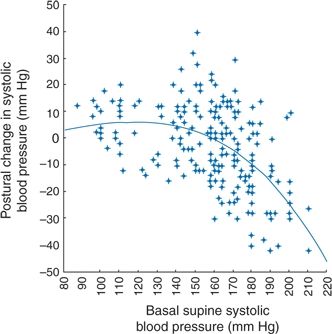
FIGURE 4-7 Relationship between basal supine systolic blood pressure and postural change in systolic blood pressure for aggregate data from older subjects. (Modified from Lipsitz LA, Storch HA, Minaker KL, et al. Intra-individual variability in postural BP in the elderly. Clin Sci 1985;69:337–341.)
Mechanism
Normal aging is associated with various changes that may lead to postural hypotension. The two most common changes are venous pooling in the legs and reduced baroreceptor sensitivity (Jones et al., 2003). Even though elderly hypertensives have intact baroreceptor modulation of sympathetic nerve traffic, they have marked impairment of baroreceptor control of heart rate and of cardiopulmonary reflex control of the peripheral circulation (Grassi et al., 2000). In addition, splanchnic pooling of blood after eating may lead to profound postprandial hypotension (Puisieux et al., 2000).
Women
Before age 50, women have a lower prevalence of hypertension than do men, but, after age 55, women have a greater age-related increase in proximal aortic stiffness, which leads to a higher incidence of systolic hypertension in older women (Pemu & Ofili, 2008). In addition, women have two other features that tend to lower diastolic BP and widen pulse pressure: First, shorter stature that causes a more rapid return of the pulse wave to augment the peak systolic pressure; second, a faster heart rate that induces a shorter diastolic period (Safar & Smulyan, 2004).
Although women at all ages have a lower incidence of heart attacks and strokes than do men, they maintain a strong, continuous, and linear association between systolic BP and cardiovascular events (Mason et al., 2004).
Blacks
Death from hypertension is the single most common reason for the higher mortality rate for blacks than for nonblacks in the U.S. (Minor et al., 2008). Blacks have more hypertension and suffer more from it, at least in part because of their lower socioeconomic status that results in reduced access to health care (Jha et al., 2003) and poorer nutrition (Stamler et al., 2013) along with a common genetic missense mutation (Parsa et al., 2013). If appropriate therapy is provided, much of their excessive morbidity and mortality related to hypertension can be relieved.
Prevalence of Hypertension
The higher BP levels in U.S. blacks begin during childhood and adolescence and are established by early adulthood (Berenson et al., 2011). Most of the higher BPs in young blacks are attributed to a larger body weight and size (Toprak et al., 2009). In middle age, blacks and whites have similar incidences of hypertension given the same baseline BP and BMI (He et al., 1998). However, hypertension in blacks is a greater risk factor for coronary disease, strokes, and in particular, ESRD than in whites (Minor et al., 2008). In most studies, blacks have higher sleeping BPs, as recorded by ambulatory monitoring (Harshfield et al., 2002a,b).
Pathophysiology of Hypertension
There are numerous genotypic and phenotypic features found in black hypertensives that may explain their higher prevalence and greater degree of target organ damage. In particular, a common missense mutation in the APOL1 gene, originally attributed to the nearby MYH9 gene, has been found in a large percentage of blacks from southern and western Africa (Skorecki & Wasser, 2013). The APOL1 alleles provided a past survival advantage by their association with protection from trypanosis. Those blacks with two alleles have been shown to have a high prevalence of hypertension and progression of CKD (Parsa et al., 2013).
Whatever else is responsible, poverty, racial discrimination, and barriers to health care obviously are involved in the higher hypertension-related morbidity and mortality seen among U.S. blacks (Jha et al., 2003). Stress and nutrition are involved.
Stress
As described in Chapter 3, there is an association between the stresses of low socioeconomic status and hypertension. A good example of the likely interaction between low socioeconomic status and a genetic trait is the finding that BP levels were significantly associated with darker skin color but only in those blacks in the lower levels of socioeconomic status (Klag et al., 1991).
Diet
Particularly among older black women, the higher prevalence of hypertension is clearly correlated with obesity (Minor et al., 2008). Although they have greater pressure sensitivity to sodium (Palacios et al., 2004), blacks do not appear to ingest more sodium than do nonblacks (Ganguli et al., 1999). However, their intake of both potassium and calcium is lower (Langford & Watson, 1990), they have more unprovoked hypokalemia (Andrew et al., 2002), and lower urinary potassium excretion apparently more than attributable to their lower intake of potassium (Turban et al., 2008).
Complications of Hypertension
Related posts:

Stay updated, free articles. Join our Telegram channel

Full access? Get Clinical Tree


