FIGURE 3-1 Interaction among genetic and environmental factors in the development of hypertension. The left side of the figure shows that genes and environment interact to affect multiple hypertensive mechanisms. The right side of the figure depicts schematically the cumulative effects of genetic and environmental factors on population-level BP, which is normally distributed. The solid line shows the theoretic BP distribution caused by genetic susceptibility alone; the shaded area indicates systolic BP in the hypertensive range. Broken lines and dotted lines indicate populations in which one (obesity) or two (obesity plus high alcohol intake) environmental factors have been added. (Modified from Carretero OA, Oparil S. Essential hypertension. Circulation 2000;101:329–335.)
HEMODYNAMIC SUBTYPES
Mounting evidence from the Framingham Heart Study investigators and others indicates that human hypertension can be divided into at least three separate hemodynamic subtypes that vary by age.
Systolic Hypertension in Teenagers and Young Adults
Typically associated with hypertension in the elderly (see below), Isolated Systolic Hypertension in Older Adults also is the main type in young adults (17 to 25 years of age). The key hemodynamic abnormalities are increased cardiac output and a stiff aorta, both presumably reflecting an overactive sympathetic nervous system. The prevalence may reach as high as 25% in young men (particularly tall athletes), but only affects 2% of young women. Several recent studies show that young persons with ISH have elevated central systolic BP (by the SphygmoCor method) as well as brachial systolic BP, indicating significantly increased hemodynamic burden (Franklin et al., 2012). Thus, ISH in youth may predispose to diastolic hypertension in middle age.
Diastolic Hypertension in Middle Age
When hypertension is diagnosed in middle age, the most common BP pattern is elevated diastolic pressure with systolic pressure being either normal (isolated diastolic hypertension) or elevated (combined systolic/diastolic hypertension) (Franklin et al., 2005). This is classic “essential hypertension.” Isolated diastolic hypertension is more common in men and often associated with middle-age weight gain and the metabolic syndrome (Franklin et al., 2006). Without treatment, isolated diastolic hypertension often progresses to combined systolic/ diastolic hypertension.
The fundamental hemodynamic fault is an elevated systemic vascular resistance coupled with an inappropriately “normal” cardiac output. Vasoconstriction at the level of the resistance arterioles (100 to 200 μm in diameter) results from increased neurohormonal drive and an autoregulatory reaction of vascular smooth muscle to an expanded plasma volume, the latter due to impairment in the kidneys’ ability to excrete sodium (Stolarz-Skrzypek et al., 2013).
Isolated Systolic Hypertension in Older Adults
After age 55, ISH (systolic BP > 140 mm Hg and diastolic BP < 90 mm Hg) is the most common form (Franklin, 2012). In developed countries, systolic pressure rises steadily with age; in contrast, diastolic pressure rises until about age 55 and then falls progressively thereafter (Burt et al., 1995). The resultant widening of pulse pressure indicates stiffening of the central aorta, reduced aortic diameter, and a more rapid return of reflected pulse waves from the periphery, causing an augmentation of systolic aortic pressure (McEniery et al., 2014). Accumulation of collagen (which is poorly distensible) adversely increases its ratio to elastin in the aortic wall.
ISH may represent an acceleration of this age-dependent stiffening process (Franklin, 2012), although systolic BP and pulse pressure do not rise with age in the absence of urbanization (e.g., cloistered nuns) (Timio et al., 1999). ISH is more common in women and is a major risk factor for diastolic heart failure, which also is more common in women (Franklin et al., 2006). Most cases of ISH arise de novo after age 60 and are not the result of “burned out” middle-age diastolic hypertension (Franklin, 2012). Compared with young or middle-aged adults with optimal BP, those with BP in the prehypertensive range are more likely to develop ISH after age 60 (Franklin et al., 2005).
Many neurohormonal, renal, and vascular mechanisms interact to varying degrees in driving these different hemodynamic patterns of hypertension.
NEURAL MECHANISMS AND PERCUTANEOUS INTERVENTION: CAROTID BARORECEPTOR PACING AND RENAL DENERVATION
Two types of percutaneous intervention—a surgically implanted carotid baroreceptor pacemaker and catheter-based renal renal denervation (RDN) (see Chapter 7)—have rekindled great interest in neural mechanisms of clinical hypertension. Figure 3-2 shows the major central and reflex mechanisms thought to drive sympathetic overactivity in human hypertension (Martin & Victor, 2011). These include, among others, resetting of the baroreceptors and activation of renal sensory nerves termed “renal afferents.” Figure 3-2 also specifies the mechanisms targeted by the device-based therapies. Despite impressive results in unblinded Phase 2A and Phase 2B trials, in blinded pivotal Phase 3 RCTs thus far primary efficacy end points were not met with either device (Bhatt et al., 2014; Bisognano et al., 2011; Medtronic, 2014).
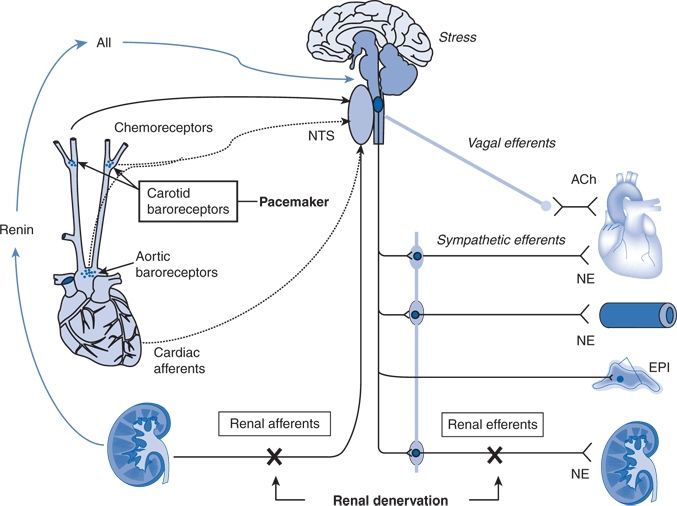
FIGURE 3-2 Sympathetic neural mechanisms of BP regulation and treatment targets of carotid baroreceptor pacing and RDN. Note that aortic baroreceptors, which also influence BP, are not paced. Also note that RDN affects afferent and efferent renal nerves. Dotted arrows represent inhibitory neural influences, and solid arrows represent excitatory neural influences on sympathetic outflow to the heart, peripheral vasculature, and kidneys. A II, angiotensin II; ACh, acetylcholine; EPI, epinephrine; NE, norepinephrine; NTS, nucleus tractus solitarius. (Modified from Martin EA, Victor RG. Premise, promise, and potential limitations of invasive devices to treat hypertension. Curr Cardiol Rep 2011;13:86–92.)
Carotid Baroreceptor Pacemaker
The Rheos system (CVRx, Inc., Minneapolis, MN) is a surgically implanted carotid baroreceptor pacemaker. Under general anesthesia, electrode wires are implanted around the carotid sinus nerves in the neck and connected to the pacemaker generator placed in a subcutaneous pocket in the chest. Electrical stimulation of the carotid sinus nerves sends afferent neural signals that the brainstem interprets as a rise in BP, evoking a reflex reduction in BP. The efferent arm of this reflex arc involves decreased efferent sympathetic nerve activity (SNA) to the heart, which slows heart rate; to the peripheral circulation, which lowers systemic vascular resistance; and to the kidney, which reduces renin release and increases renal sodium excretion. Activation of the Rheos device acutely decreases SNA, BP, and heart rate and may avert acute hypertensive crisis (Fig. 3-3) (Mohaupt et al., 2007). While the carotid sinus and aortic arch baroreceptors buffer acute increases in BP, we lack data regarding the durability of the antihypertensive action of continuous carotid baroreceptor stimulation. This question was addressed by the Rheos Pivotal Trial, a randomized, double-blind, placebo-controlled study of carotid baroreceptor pacing in patients with drug-resistant hypertension (Bisognano et al., 2011).
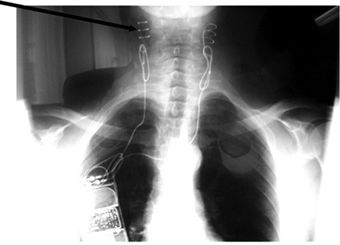
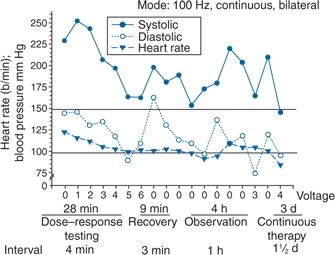
FIGURE 3-3 Management of a hypertensive crisis with a carotid baroreceptor pacemaker. Left panel, chest roentgenogram after implantation showing the electrodes placed around both carotid sinuses and the stimulator that is somewhat larger than a conventional pacemaker. Right panel, BP measurements of the patient during a hypertensive crisis are shown. Systolic BP decreased >45 mm Hg, and diastolic BP decreased 50 mm Hg. Thereafter, the device was shut off, and BP increased over 4 hours. Continuation of the stimulus resulted in BP decreases to the previous stimulation values. Voltage is indicated on the x axis. The stimulation was bilateral with a continuous square-wave pattern at a frequency of 100 Hz and a pulse width of 480 μs. (Modified from Mohaupt MG, Schmidli J, Luft FC. Management of uncontrollable hypertension with a carotid sinus stimulation device. Hypertension 2007;50:825–828.)
In the Rheos trial, 265 patients with resistant hypertension and baseline BP averaging 169/101 mm Hg (despite treatment of most patients with five or more BP medications) underwent implantation of the Rheos device and subsequently randomization (2:1) 1 month after implantation to immediate initiation of bilateral carotid baroreceptor pacing (Group A) or delayed initiation until the 6-month visit (Group B); all patients received open-label baroreceptor pacing for another 6 months. The results were largely negative, but mixed. There were no group differences at 6 or 12 months in the coprimary end points of percentage of subjects in whom systolic BP decreased by at least 10 mm Hg (54% for Group A and 46% for Group B; p = NS); and 9% of patients developed transient or permanent facial nerve injury. Yet, a post hoc analysis showed that 42% of Group A patients and 24% of Group B patients achieved systolic BP control (systolic BP ≤ 140 mm Hg) at 6 months (p = 0.005), with just over 50% of both groups achieving systolic BP control at 12 months (at which point Group B had received baroreceptor pacing for 6 months). The reduction in BP was associated with a small initial decrease in estimated glomerular filtration rate (eGFR) (Alnima et al., 2013). More research should determine if efficacy and safety can be improved by additional technical refinements or if offsetting responses from aortic baroreceptors, which are not paced, inherently limits this approach. A second-generation minimally invasive unilateral carotid nerve pacing system (Barostim neo) has yielded encouraging preliminary results for safety and efficacy (Alnima et al., 2013; Hoppe et al., 2012). A United States (U.S.) pivotal trial of Barostim neo is underway (ClinicalTrials.gov Identifier NCT01679132).
Catheter-Based Renal Denervation
Rodent studies implicate a major role for the renal sympathetic nerves in the development of hypertension (Guyenet, 2006), but the importance of the renal nerves in causing human hypertension previously had not been studied directly. As shown by Dibona (2005), in rats, renal sympathetic nerves cause renal vasoconstriction and vascular hypertrophy via α1 receptors, stimulate renin release via β1 receptors, and enhance renal sodium and water reabsorption via α1 receptors (Fig. 3-4). Thus, catheter-based RDN is an exciting novel intervention for hypertension. The renal nerves, which are located on the adventitial surface of the renal arteries, are destroyed by radiofrequency current via an intraluminal catheter. Under conscious sedation, the Symplicity catheter is advanced into each renal artery, and four to six discrete low-power radiofrequency treatments are applied along the length of each artery.
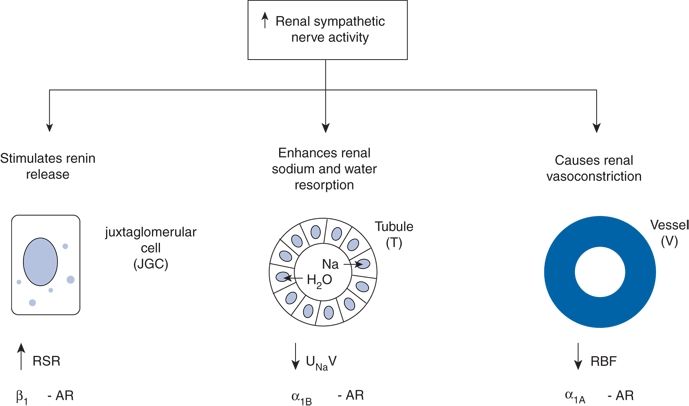
FIGURE 3-4 Effects of increased RSNA on the three renal neuroeffectors: the juxtaglomerular cell (JGC) with increased renin secretion rate (RSR) via stimulation of the β1 adrenoceptors (AR), the renal tubular epithelial cells (T) with increased renal tubular sodium reabsorption and decreased urinary sodium excretion (UNaV) via stimulation of α1B AR, and the renal vasculature (V) with decreased renal blood flow (RBF) via stimulation of α1A AR. (From DiBona GF. Physiology in perspective: The Wisdom of the Body. Neural control of the kidney. Am J Physiol Regul Integr Comp Physiol 2005;289:R633–R641.)
The final 3-year follow-up data from the open-label uncontrolled Symplicity HTN-1 trial in 88 patients with severe drug-resistant hypertension show impressive sustained reductions in office BP averaging −36/−14 mm Hg, but ambulatory BP was not assessed (Krum et al., 2014). In that study, RDN did not prevent a decline in eGFR, but, without a control group, this decline may be less than or greater than that caused by hypertension alone without RDN.
In the unblinded Symplicity HTN-2 trial (Renal Denervation in Patients With Uncontrolled Hypertension) (Esler et al., 2010), 106 non-U.S. patients with drug-resistant hypertension and baseline BP 178/97 mm Hg despite treatment with an average of 5 or more BP medications randomly underwent RDN while continuing prior drug therapy or continued prior drug therapy alone. Patients who met initial screening criteria were excluded if systolic BP fell below 160 mm Hg on a second screening or if they had unfavorable renal anatomy. The primary end point was the change from baseline in seated office-based measurement of systolic BP at 6 months. Office-based BP fell dramatically: by −32/−12 mm Hg in the active treatment group, versus no change in the control group. The 24-hour ambulatory BP, measured in less than half of patients, fell less dramatically: by −11/−7 mm Hg in the active treatment group, versus no change in the control group. No major adverse events occurred.
Subsequently, post hoc analyses of the Symplicity HTN-1 and HTN-2 data and smaller studies have suggested multiple ancillary benefits of RDN. These include improvement in glycemic control (Mahfoud et al., 2011), sleep apnea (Witkowski et al., 2011), and quality of life (Lambert et al., 2012); regression of left ventricular hypertrophy (LVH) (Brandt et al., 2012a); reduction in central aortic stiffness (Brandt et al., 2012b); and reduced ventricular rate in patients with atrial fibrillation (Linz et al., 2013). Presumably, these diverse benefits derive not from destruction of efferent renal sympathetic nerve fibers but rather from destruction of renal afferent (sensory) nerves—thereby causing a global reflex decrease in sympathetic outflow to multiple tissues and vascular beds (Thompson et al., 2011) (Fig. 3-5).
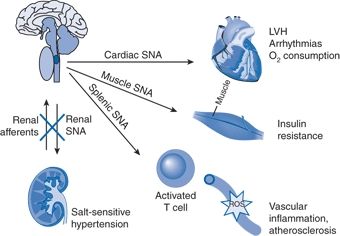
FIGURE 3-5 Conceptual framework by which denervation of renal afferents explains ancillary benefits of catheter-based RDN. In patients with drug-resistant hypertension, overactivity of efferent RSNA contributes to salt-sensitive hypertension, whereas overactivity of excitatory renal sensory (afferent) nerves triggers sustained reflex increases in cardiac SNA (leading to LVH, arrhythmias, and increased oxygen consumption), in skeletal muscle SNA (leading to insulin resistance), and in splenic SNA (activating T cells, which are honed to vascular smooth muscle, stimulating ROS that promote vascular inflammation and atherosclerosis).
Based on these unblinded data, RDN already has been approved for clinical use in Europe, Australia, and Asia (see Chapter 7) with published clinical practice guidelines (Schmieder et al., 2012). However, the blinded pivotal U.S. Symplicity HTN-3 trial did not show a significant reduction of systolic BP in patients with resistant hypertension 6 months after renal artery denervation as compared with a sham control (Bhatt et al., 2014).
In Symplicity HTN-3, 535 patients with Stage 2 drug-resistant hypertension with baseline office systolic BP 179 mm Hg and 24-hour ambulatory systolic BP 159 mm Hg despite treatment with 5 BP medications all underwent renal angiography under conscious sedation and were randomized (2:1) in the catheterization lab to either actual or sham RDN with both the patient and the research staff being blinded to condition assignment. The primary end point was the change in office systolic BP after 6 months. The priority secondary end point was the reduction in 24-hour systolic BP assessed by ambulatory BP monitoring in all patients. After 6 months, office systolic BP fell by −14 ± 24 mm Hg (mean ± SD) in the RDN group versus −12 ± 26 mm Hg in the sham group (p = 0.26); 24-hour ambulatory systolic BP fell by −7 ± 15 mm Hg in the RDN group versus −5 ± 17 mm Hg in the sham group (Bhatt et al., 2014).
Potential explanations for the negative Symplicity HTN-3 trial and the difficulty showing an overall treatment benefit of RDN with 24-hour ambulatory BP monitoring include the following:
- Patient selection. The large standard deviations around the mean reductions in BP in Symplicity HTN-1, 2, and 3 show large interindividual variability in the response (Messerli & Bangalore, 2014). The sympathetics will not be overactive in all patients with resistant hypertension. Indeed, subgroup analyses showed statistically significant but small intervention effects in patients younger but not those older than 65 and in nonblack but not black patients. Renal norepinephrine (NE) spillover is most consistently elevated in young hypertensives (ages 20 to 39) but is indistinguishable from normotensive levels in older hypertensives aged 60 to 79 years (Parati & Esler, 2012). Also, 25% of the study population comprised black patients, in whom renal and vascular mechanisms could be more important than neurogenic mechanisms. RDN would have little effect if the sympathetics are not overactive.
- Incomplete denervation. There is no point-of-care verification procedure to prove the completeness of RDN before the patient leaves the catheterization laboratory. Because the catheter is in the lumen of the renal artery, the thermal energy produced has to cross the arterial wall to reach the nerves located in the adventitia and perivascular fat. Incomplete denervation is of particular concern with renal afferents; in animal studies, 100% destruction of afferents is needed to attenuate a BP-raising reflex but near-complete deafferentation has almost no effect because of redundancy in afferent inputs into the central nervous system (CNS).
- Trial design issues. Protocol violation on medication compliance by participating physicians and patients is a likely confounder because the patients in these trials were on an average of 5 BP medications, including adrenergic blockers and central sympatholytics as well as mineralocorticoid receptor (MR) antagonists, which also seem to have central sympatholytic effects. That BP showed zero decline in the unblinded control group of Symplicity HTN-2 is a red flag, because BPs always improve in patients randomized to blinded control groups in hypertension trials—including Symplicity HTN-3—because of the Hawthorne effect and regression to the mean. These nonspecific factors explain why patients with the highest baseline BP show the greatest reduction in BP after RDN, a finding that provides no mechanistic insight. Also, a recent small pilot study suggests that intensive medication management can be more effective than RDN and thus is the appropriate active comparator for future outcome trials (Fadl Elmula et al., 2014).
- White-coat hypertension. White-coat hypertension is common and invalidates office BP as a primary outcome measure when evaluating any therapy based on a neural mechanism. Six-month registry data from 47 patients who had RDN for clinical indications in Europe show that office BP fell by −18/−7 mm Hg (from 175/98 to 158/91 mm Hg, p = 0.01) but 24-hour BP showed a much smaller and statistically nonsignificant change of −6/−4 mm Hg (from 157/92 to 151/88, p = 0.3) with much interindividual variation (Fig. 3-6) (Persu et al., 2013). Clearly, ambulatory BP—both awake and sleeping BPs—must replace office BP as the primary outcome in future studies of RDN, carotid pacing, and related intervention.
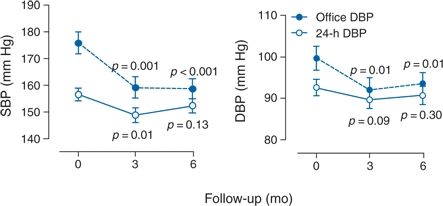
FIGURE 3-6 European registry data on conventional office and 24-h ambulatory BP values at baseline and at 3 and 6 months after RDN in 47 patients. SBP and DBP indicate systolic and diastolic BP, respectively. p-Values denote the significance compared with baseline in unadjusted analyses. (Data from Persu A, Jin Y, Azizi M, et al. Blood pressure changes after renal denervation at 10 European expert centers. J Hum Hypertens 2013;28:150–156.)
Thus, future RDN trials are likely to focus on younger hypertensives. Much more work is needed to create a point-of-care end point, to better understand the relative contributions of renal efferent versus afferent nerves to the mechanism of action of RDN, and, most importantly, to identify which patients will most likely benefit from RDN and which will not. In this regard, it is worth recalling that, in the 1940s, less than one-third of severely hypertensive patients showed a substantial improvement in BP with total surgical thoracic/lumbar/splanchnic sympathectomy plus celiac ganglionectomy (Fig. 3-7) (Grimson et al., 1949).
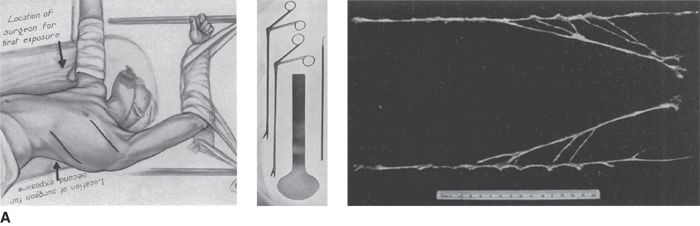
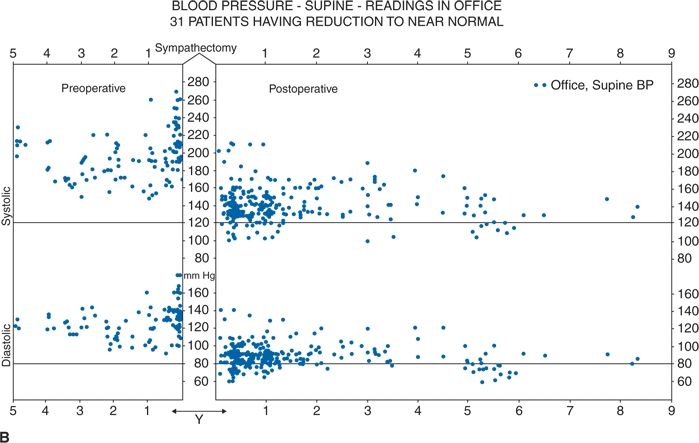
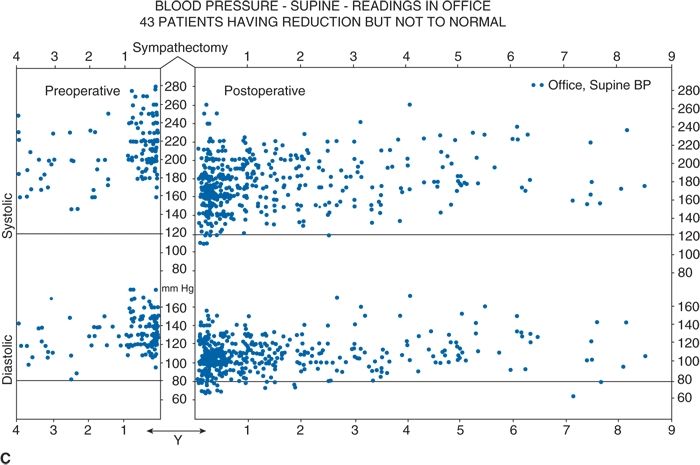
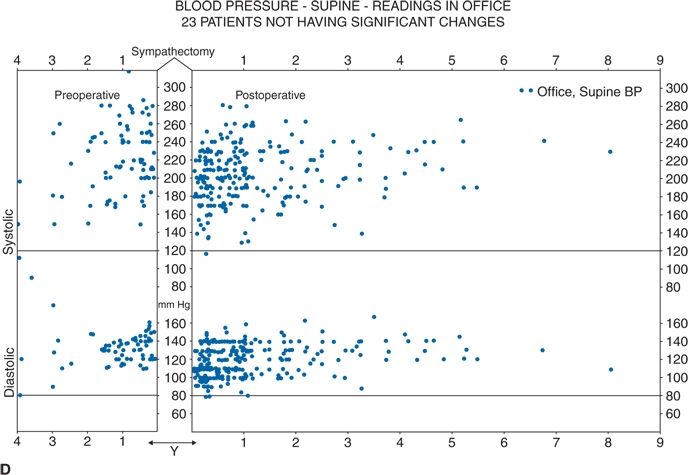
FIGURE 3.7 A classical study from the 1940s showing total lumbar sympathectomy (A) and office BPs readings in patients whose BPs improved markedly (B), those in whom BP improved somewhat (C), and those in whom BP did not improve at all (D). (From Grimson KS, Orgain ES, Anderson B, et al. Results of treatment of patients with hypertension by total thoracic and partial to total lumbar sympathectomy, splanchnicectomy and celiac ganglionectomy. Ann Surg 1949;129:850–871.)
In the meantime, the recent RDN studies certainly have refocused much attention on neural mechanisms of hypertension. Previously, the sympathetic nervous system was implicated mainly in the initiation of hypertension, but not in its maintenance. These studies also implicate a greatly expanded role for renal afferents, formerly thought to contribute mainly to renal parenchymal hypertension and cyclosporine-induced hypertension (Converse et al., 1992; Zhang et al., 2000). To put this rapidly growing and now perplexing field in perspective, the following is a detailed discussion of neural mechanisms of hypertension.
Overview of the Sympathetic Nervous System
Pioneering work by Julius and coworkers and others indicate that hypertension is often initiated by adrenergically driven increases in cardiac output (a “hyperdynamic” circulation) but sustained by subsequent vasoconstriction, vascular remodeling, and autoregulation—leading to increased vasoconstriction with an inappropriately normal cardiac output (Julius et al., 1991). In young adults, primary hypertension consistently associates with increased heart rate and cardiac output, plasma and urinary NE levels, regional NE spillover, peripheral postganglionic sympathetic nerve firing (determined by microelectrode recordings), and alpha-adrenergic receptor–mediated vasoconstrictor tone in the peripheral circulation (Martin & Victor, 2011). Sympathetic overactivity occurs in early primary hypertension and in several other forms of established human hypertension, including hypertension associated with obesity, sleep apnea, early type 2 diabetes mellitus and prediabetes, chronic kidney disease (CKD), heart failure, and immunosuppressive therapy with calcineurin inhibitors such as cyclosporine. In these conditions, central sympathetic outflow can result from deactivation of inhibitory neural inputs (e.g., baroreceptors), activation of excitatory neural inputs (e.g., carotid body chemoreceptors, renal afferents), or circulating angiotensin II (Ang II), which activates pools of excitatory brainstem neurons with a poorly formed blood–brain barrier.
As shown in Figure 3-2, multiple central and reflex mechanisms are involved in the neural control of BP.
Baroreceptors
The major inhibitory reflexes arise in the (1) high-pressure arterial baroreceptors of the carotid sinus and aortic arch and (2) low-pressure cardiopulmonary baroreceptors of the heart and great veins. The activation of these baroreceptors, by increased BP or increased cardiac filling pressure, respectively, sends inhibitory signals to the CNS via the nucleus tractus solitarius (NTS) and evokes reflex increases in efferent parasympathetic and decreases in efferent sympathetic activity, causing bradycardia and peripheral vasodilation that buffer the increases in BP (Guyenet, 2006).
In hypertension, the baroreceptors reset to defend a higher level of BP. Baroreflex control of sinus node function is abnormal even in mild hypertension, but baroreflex control of systemic vascular resistance and BP is well preserved until diastolic function is impaired (Grassi et al., 2009). Complete baroreflex failure causes labile hypertension, most often seen in throat cancer survivors as a late complication of radiation therapy, which causes a gradual destruction of the baroreceptor nerves (Huang et al., 2013). Partial baroreceptor dysfunction is common in elderly hypertensive patients and typically manifests with a triad of orthostatic hypotension, supine hypertension, and symptomatic postprandial hypotension—the last initiated by splanchnic pooling after carbohydrate-rich meals (Barochiner et al., 2013).
Excitatory Neural Reflexes
The major excitatory reflexes are those arising in carotid body chemoreceptors, the kidneys, and skeletal muscles. Activation of carotid body chemoreceptors by hypoxia evokes reflex sympathetic activation. Repeated activation of this excitatory chemoreflex has been implicated in the pathogenesis of hypertension with sleep apnea. Thus, carotid body denervation is being explored as another form of percutaneous intervention for hypertension (McBryde et al., 2013). As mentioned earlier, the kidneys are richly innervated with sensory afferents that project centrally to the NTS and can evoke reflex sympathetic excitation. Activation of excitatory renal afferents by ischemic metabolites (e.g., adenosine) has been implicated in the pathogenesis of renovascular hypertension. Activation of these afferents by ischemic or uremic metabolites (e.g., urea) has been implicated in the pathogenesis of hypertension in CKD (Converse et al., 1992); sympathetic overactivity increases with increasing severity of CKD (Grassi et al., 2011). The skeletal muscles also are innervated with sensory afferents that signal the brain of local mechanical and chemical changes occurring during muscle contraction. During exercise, muscle afferents evoke reflex increases in BP and cardiac output that increase muscle perfusion. This reflex mechanism may be augmented in hypertension and lead to an exaggerated rise in BP during exercise (Vongpatanasin et al., 2011).
Central Sympathetic Outflow
Excitatory and inhibitory synaptic inputs from the NTS project centrally to neurons in the rostral ventrolateral medulla (RVLM), the site of origin of sympathetic outflow from the brainstem (Guyenet, 2006). From there, preganglionic sympathetic fibers synapse in the adrenal medulla (to release epinephrine, EPI) and in the paravertebral sympathetic chain ganglia. The postganglionic fibers, which release NE, innervate the heart, blood vessels, and kidney.
Adrenergic Receptors
Catecholamines induce their effects via G-protein–coupled α- and β-adrenergic receptors. The α1 adrenoreceptors are most abundant on resistance vessels and mediate most of the vasoconstriction caused by neurally released NE. There are three subtypes of α2 adrenoreceptors that vary in location and function (Knaus et al., 2007). Studies in genetically engineered mice indicate that α2A are located in the RVLM and tonically suppress sympathetic outflow. They mediate the hypotensive effect of clonidine and related central sympatholytics. Both α2A and α2C subtypes are located on sympathetic nerve terminals and cause feedback inhibition of NE release. In contrast, α2B subtypes are located on resistance vessels. But, unlike α1 receptors, they are not part of the neuroeffector junction but rather mediate vasoconstriction from circulating catecholamines. Their response also explains the paradoxical hypertension seen when patients with autonomic failure are treated with clonidine, which stimulates all three α2-adrenergic receptor subtypes.
β-Adrenergic stimulation of the heart increases ventricular contractility and heart rate, thereby increasing cardiac output. α-Adrenergic stimulation of the peripheral vasculature causes vasoconstriction and, over time, promotes vascular remodeling and hypertrophy (Bleeke et al., 2004).
Cortical Influences
Cortical influences are particularly evident in the normal nocturnal dip in BP, the morning surge in BP, during physical and emotional stress (especially panic disorder), and with the white-coat reaction (see Chapter 2).
Long-Term Sympathetic Regulation of BP
As noted above, the sympathetic nervous system is well known to regulate short-term changes in BP such as transient pressor responses during physical and emotional stress. In addition, sustained activation of the renal sympathetic nerves may contribute to long-term BP regulation by promoting sodium retention (DiBona, 2005). Moreover, NE’s action on α-1 adrenoreceptors constitutes a trophic stimulus to cardiac and vascular smooth muscle hypertrophy (Bleeke et al., 2004). In patients with hypertension and LVH, SNA is increased and may predispose to the hypertrophy and sudden cardiac death (Grassi et al., 2009; Schlaich et al., 2003).
Sustained sympathetic overactivity has been demonstrated not only in early primary hypertension but also in several other forms of established human hypertension. These include hypertension associated with obesity, sleep apnea, early type 2 diabetes mellitus and prediabetes, CKD, heart failure, and immunosuppressive therapy with calcineurin inhibitors such as cyclosporine A (Martin & Victor, 2011). In these conditions, central sympathetic outflow can be driven by deactivation of inhibitory neural inputs (e.g., baroreceptors), activation of excitatory neural inputs (e.g., carotid body chemoreceptors, renal afferents), or by circulating angiotensin II (Ang II), which activates pools of excitatory brainstem neurons that are devoid of a blood–brain barrier (see Fig. 3-2). Apparently, circulating aldosterone also can act centrally to increase SNA, leading to reversibly sympathetic overactivity in patients with primary aldosteronism (Kontak et al., 2010).
With this background in mind, we now review the evidence for a neurogenic component to primary hypertension.
Detection of Sympathetic Overactivity in Primary Hypertension
In its early stages, primary hypertension consistently associates with increased heart rate and cardiac output, plasma and urinary NE, regional NE spillover, decreased NE reuptake, peripheral postganglionic sympathetic nerve firing, and α-adrenergic receptor–mediated vasoconstrictor tone in the peripheral circulation (Martin & Victor, 2011).
These effects are difficult to demonstrate, in part because sympathetic activity is difficult to measure especially in the clinical setting. Plasma NE levels are an insensitive measure. Although easily performed and noninvasive, frequency analysis of heart rate variability simply is not a valid measure of sympathetic activity (Taylor & Studinger, 2006). The two state-of-the-art techniques to quantify sympathetic activity in humans are radiotracer measurements of regional NE spillover (Esler, 2014) and microneurography—microelectrode measurements of SNA (Manolis et al., 2013). The former is invasive and requires arterial cannulation. The latter is minimally invasive but requires specialized training.
Regional NE Spillover
Pioneering work by Esler, Lambert, and coworkers shows that Stage 1 primary hypertension is characterized by sympathetic activation targeted to the kidney, heart, and skeletal muscle vasculature (Esler, 2014).
Direct Measurements of Sympathetic Nerve Activity
As shown in Figure 3-8, microneurography provides direct measurements of postganglionic SNA—the proximate neural stimulus to NE release (Guyenet, 2006). This is a powerful clinical research tool (Guyenet, 2006; Manolis et al., 2013) but too technically demanding for routine diagnostic testing.
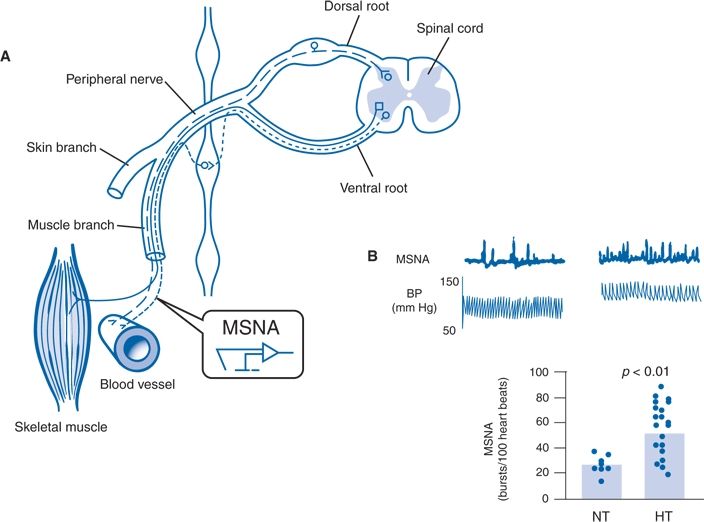
FIGURE 3-8 Microneurographic measurements of MSNA in normotensive and hypertensive humans. A: Schematic diagram showing site of insertion of the recording microelectrode into a peripheral sympathetic nerve bundle innervating blood vessels in human skeletal muscle. B: Multiunit recordings of MSNA and BP from two illustrative human subjects (top panel) and summary data (bottom panel) showing higher mean levels of nerve firing in hypertensive (HT) than normotensive (NT) humans. (A modified from Guyenet PG. The sympathetic control of blood pressure. Nat Rev Neurosci 2006;7:335–346. B adapted from Schlaich MP, Lambert E, Kaye DM, et al. Sympathetic augmentation in hypertension: Role of nerve firing, norepinephrine reuptake, and Angiotensin neuromodulation. Hypertension 2004;43:169–175.)
Muscle sympathetic nerve activity (muscle SNA or MSNA) refers to spontaneous bursts of postganglionic sympathetic discharge targeted to the skeletal muscle vasculature. The activity is tightly regulated by carotid sinus and aortic arch baroreceptors, accompanied by parallel changes in regional vasomotor tone, and eliminated by ganglionic blockade (Guyenet, 2006; Wallin & Charkoudian, 2007). These are vasoconstrictor impulses that release NE. Basal levels of MSNA provide a valid measure of resting sympathetic activity—at least to one major vascular bed that contributes to total peripheral resistance and BP.
Figure 3-8 also shows an example of one of many studies showing higher levels of MSNA in hypertensive than normotensive individuals, but with overlap between groups (Guyenet, 2006). The overlap is largely eliminated when the normotensive control group was more carefully defined using 24-hour ambulatory BP monitoring (Grassi et al., 2007). When those with white-coat (office-only) hypertension and masked hypertension (elevated BP only outside the physician’s office) were eliminated from the normotensive control group, mean values of MSNA were 70% higher in the persistent hypertensives compared to true normotensives. When measured under experimental circumstances, the MSNA was higher than normal in individuals with either white-coat or masked hypertension.
Potential Mechanisms
Several mechanisms have been implicated in driving the sympathetic nervous system in hypertension.
Emotional and Physical Stress
Sympathoadrenal activation increases BP and heart rate transiently during episodes of physical and emotional stress, but the issue remains: Can it cause chronic hypertension?
Guyton viewed the nervous system as only a short-term controller, adjusting beat-to-beat and minute- to-minute changes in BP but playing a trivial role in chronic hypertension (Guyton, 1991). In contrast, the Swedish physiologist Bjorn Folkow hypothesized that repeated adrenergic spikes in BP eventually will damage the blood vessels producing sustained hypertension (Folkow, 2004).
Despite a vast literature, there still is no conclusive proof for Folkow’s hypothesis (Thijssen et al., 2011). Psychological stress is hard to quantify, and standard semiquantitative laboratory stressors are often weak sympathetic stimuli that do not mirror real-life stress. The acute rise in BP during the cold pressor test (hand in ice water) is an indirect index of increased MSNA and α-adrenergic vasoreactivity (Lambert et al., 2014; Victor et al., 1987).
The pattern of hemodynamic response to more realistic stresses in a laboratory setting may predict real-life BP measured by ambulatory monitoring (Ottaviani et al., 2011). Rumination—preservation about past stressful or anger-provoking events (i.e., anger recall)—may produce repetitive sympathetic activation leading to chronic hypertension (Gerin et al., 2012). In a study of 60 lean normotensive young adults, daytime ambulatory systolic BP averaged 133 mm Hg when they were ruminating versus 114 mm Hg when they were not (Ottaviani et al., 2011). Rumination triggers decreased heart rate variability, peripheral vasoconstriction, and increased blood levels of inflammatory markers such as soluble intercellular adhesion molecule-1 (Ottaviani et al., 2007; Ottaviani et al., 2013) and is associated with blunted nocturnal dipping of BP (Johnson et al., 2014).
Job stress and sleep deprivation seem to be a cause of hypertension (Magnavita & Fileni, 2013; Pickering, 2006). Among African Americans, perceived racism is associated with nocturnal hypertension (Brondolo et al., 2011). NE spillover is increased in the brains of patients with primary hypertension and in those with panic disorder (Esler, 2014).
Baroreceptor Resetting
Although the baroreceptors are reset to defend a higher BP, this does not explain sympathetic overactivity in human hypertension (Schlaich et al., 2004). Baroreflex control of heart rate is impaired even in mild hypertension, but baroreflex control of SNA, vascular resistance, and BP is well preserved (Guo et al., 1983). Even baroreflex failure after bilateral carotid body tumor resection does not cause sustained hypertension (Timmers et al., 2004).
Central Effects of Angiotensin II
In rodent models, Ang II can enter the brainstem via unique neuronal pools that are highly vascularized and have a poorly formed blood–brain barrier—the circumventricular organs—and increase central sympathetic outflow via AT1 receptor–mediated activation of brain NADPH oxidases that produce ROS (Lob et al., 2013). In the spontaneously hypertensive rat—a common model of genetically programmed hypertension—inhibition of the brain renin–angiotensin–aldosterone system (RAAS) in the pregnant mother will eliminate hypertension in her offspring (Wu & Berecek, 1993). If the RAAS blocker is given systemically to the rat pups after delivery, the hypertension will be delayed and attenuated but not entirely eliminated. Chronic renin inhibition with aliskiren lowers upright (but not seated) MSNA in adult patients with uncomplicated primary hypertension (Okada et al., 2013).
Brainstem Compression
Jannetta and coworkers, neurosurgeons at the University of Pittsburgh, hold that pulsatile compression of the left RVLM by a looping posterior inferior cerebellar artery can cause neurogenic hypertension (Levy et al., 2001). After developing an animal model, they have performed microvascular decompression surgery on hundreds of hypertensive patients. However, uncertainty persists due to inconsistent results from uncontrolled observations in small samples with short follow-up (Legrady et al., 2013) and the inability of brain MRI to accurately detect neurovascular compression in prospective studies (Boogaarts et al., 2012).
In an independent study from Germany, 14 patients with primary hypertension were followed sequentially for 24 months after surgery with repeated ABPM and microneurography (Frank et al., 2009). Neurovascular decompression provided only temporary relief from hypertension, as BP and MSNA fell for the first 6 months after surgery but then returned steadily toward preoperative levels thereafter. Larger long-term studies are needed. Hypertension may be the cause rather than the result of vascular tortuosity.
When Does Increased MSNA Cause Hypertension?
Increased MSNA alone does not cause hypertension when it is accompanied by compensatory decreases in cardiac output and α-adrenergic receptor sensitivity to NE (Hart et al., 2014). In young people, the influence of high MSNA on BP is balanced by lower cardiac output and less adrenergic vasoconstrictor responsiveness. Tonic MSNA may restrain vasodilator responses in young men, whereas in older men, a lack of such restraint may be protective against the pressor effects of higher SNA. Presumably, sympathetic overactivity leads to hypertension only when these compensations fail.
Increased MSNA may cause HTN only when accompanied by one or more of the following additional mechanisms:
- Inappropriately “normal” cardiac output (Charkoudian et al., 2005). This may be less of a factor in women than men (Hart et al., 2009).
- Increased α-adrenoreceptor sensitivity to NE (Charkoudian et al., 2005)
- Impaired NE reuptake by sympathetic nerve terminals (Esler, 2014)
- Corelease of EPI from sympathetic nerve terminals (Berecek & Brody, 1982; Floras et al., 1988; Rumantir et al., 2000)
Summary
Despite abundant documentation of sympathetic overactivity in primary hypertension, we still cannot quantify this neurogenic contribution. More work is needed to define the role of baroreceptor pacing and RDN in hypertension therapeutics and, in so doing, improve our fundamental understanding of neurogenic mechanisms. With that caveat, we now turn to renal mechanisms.
RENAL MECHANISMS
The kidneys are both the culprit and the victim in hypertension. Renal parenchymal hypertension is discussed in Chapter 9 and renovascular hypertension in Chapter 10.
In the mid-19th century, Richard Bright linked hypertensive heart disease with small shrunken kidneys. In the 1930s, seminal work by Harry Goldblatt proved that the kidneys can cause hypertension (Goldblatt et al., 1934). Beginning with the work of Guyton and his trainees in the 1960s, many believe that renal dysfunction is the sine qua non for hypertension.
According to this view, the fundamental defect in all hypertension is the kidneys’ inability to excrete the excessive sodium load imposed by a high-salt diet (Kotchen et al., 2013).
Excess Sodium Intake as a Major Cause of Hypertension
The basis for the generally accepted—but not in itself sufficient—role of dietary sodium excess is as follows. Because our prehistoric ancestors consumed less than 0.25 g of NaCl (<10 mmol of Na) per day, our kidneys evolved efficient transport mechanisms to retain filtered sodium, which benefits survival during salt and water deprivation but contributes to hypertension when dietary salt is plentiful (He & MacGregor, 2010). For only the past few hundred years—a very short period in human evolution—daily NaCl consumption in developed countries has increased by orders of magnitude to 10 to 12 g/day, which overwhelms the capacity of the human kidney to maintain Na balance (He & MacGregor, 2010; Kotchen et al., 2013). The residual excess total body Na—the main extracellular cation—expands plasma volume, increases cardiac output, and triggers autoregulatory responses that increase systemic vascular resistance. The sodium ion also augments the smooth muscle contraction evoked by multiple endogenous vasoconstrictor substances.
Most of the excess sodium in our diets does not come from the salt shaker but from modern food processing, which both adds sodium and removes potassium. Table 3-1 shows that our herbivorous ancestors probably consumed less than 10 mmol of sodium per day, whereas our carnivorous ancestors might have eaten 30 mmol/day (Eaton et al., 1996). Human physiology evolved in a low-sodium/high-potassium environment, and we seem ill equipped to handle the current exposure to high sodium and low potassium (He & MacGregor, 2010). Our current preference for salt likely is an acquired taste, developing early in childhood.
TABLE 3-1 Estimated Diet of Late Paleolithic Humans Versus That of Contemporary Americans
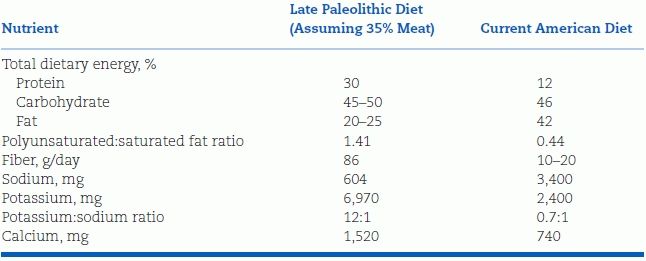
Data from Eaton SB, Eaton SB III, Konner MJ. An evolutionary perspective enhances understanding of human nutritional requirements. J Nutr 1996;126:1732–1740.
Dietary salt is 40% sodium and 60% chloride. Thus,
- 1 g sodium = 2.5 g salt
- 1 mmol sodium = 23 mg sodium
- 1 g salt = 0.4 g sodium = 17 mmol sodium.
The evidence linking dietary salt to hypertension is overwhelming and comes from multiple lines of investigation:
Epidemiologic Studies
- In undeveloped countries, people who eat little sodium have little or no hypertension, and their BP does not rise with age, as it does in all developed and developing countries (Denton et al., 1995; Page et al., 1981). For example, the Yanomamo Indians of northern Brazil, who excrete only 1 mmol of sodium per day, have an average BP of 107/67 mm Hg among men and 98/62 mm Hg among women aged 40 to 49 years (Oliver et al., 1975).
- The lack of hypertension may be attributable to other differences in lifestyle, but comparisons made in groups living under similar conditions relate the BP most directly to the level of dietary sodium intake (Page et al., 1981). In developing countries, urbanization—which includes increased salt consumption—brings hypertension (Lawes et al., 2008). Even without urbanization, hypertension occurs in undeveloped tribes who consume a high salt diet (Page et al., 1981).
- Significant correlations between salt intake and hypertension development have been found in most large populations (Chen et al., 2008a; Khaw et al., 2004; Zhou et al., 2003) but not in all (Smith et al., 1988). The seminal data come from the Intersalt study, which measured 24-hour urine electrolytes and BP in 10,079 men and women aged 20 to 59 years in 52 places around the world (Elliott et al., 1996; Intersalt Cooperative Research Group, 1988). For all 52 centers, there was a positive correlation between urine sodium excretion and both systolic and diastolic BP but an even more significant association between sodium excretion and the changes in BP with age (Fig. 3-9). Few populations were found whose levels of sodium intake were in the 50- to 100-mmol/day range (3 g NaCl), wherein the threshold for the sodium effect on BP likely resides (Fig. 3-10) (He et al., 1991; Poulter et al., 1990).
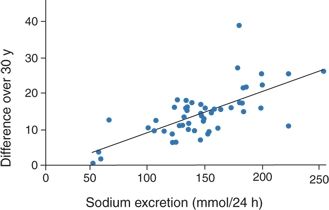
FIGURE 3-9 Plot of the difference in systolic BP over 30 years (BP at age 55 minus BP at age 25) in relation to median urinary sodium excretion across 52 populations. (Modified from Stamler J, Elliott P, Dyer AR, et al. Commentary: Sodium and blood pressure in the Intersalt study and other studies. BMJ 1996;312:1285–1287.)
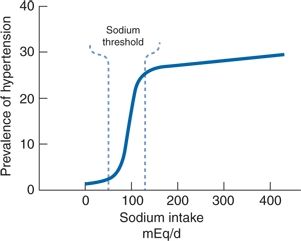
FIGURE 3-10 Probable association between usual dietary sodium intake and the prevalence of hypertension in large populations. (Modified from Kaplan NM. Dietary salt intake and blood pressure. JAMA 1984;251:1429–1430.)
Migration Studies
Migration of people from a low-salt rural environment to a high-salt urban environment is accompanied by increased BP (He et al., 1991; Poulter et al., 1990).
Population-Level Dietary Interventions
It is generally ineffective to try to reduce a person’s salt intake with individual dietary counseling alone. Larger effects will require societal and governmental regulation of the food industry, as 75% to 80% of dietary salt comes from food processing. When this has occurred, population-level BPs have fallen.
- Over the past 30 years in Finland, a successful comprehensive nationwide campaign to lower salt intake by one-third has been accompanied by a 10-mm Hg fall in population average systolic and diastolic BP as well as a 75% to 80% fall in stroke and coronary heart disease (CHD) mortality (Karppanen & Mervaala, 2006).
- Canada has followed suit (Campbell & Spence, 2008).
- A 2-year interventional study in two similar Portuguese villages led to a 13/6 reduction in BP in the village with a 50% greater reduction in salt intake (Forte et al., 1989).
- From 2003 to 2011 in England, a reduction in salt intake of 15% (1.4 g/day) was accompanied by a population level reduction in BP of 3/1 mm Hg and a 42% reduction in mortality from stroke (He et al., 2014; Stamler et al., 1989).
- Modest reductions in dietary salt content of processed foods in the U.S. by only 3 g/day are projected to reduce population-level systolic BP by 2 to 3 mm Hg and prevent 54,000 to 99,000 myocardial infarctions (MIs) and 32,000 to 66,000 strokes every year, with the greatest project benefit occurring in African Americans (Bibbins-Domingo et al., 2010).
Feeding Trials
When hypertensives are sodium restricted, their BP falls. Dramatic falls in BP may follow rigid sodium restriction (Kempner, 1948), whereas less rigid restriction to a level of approximately 100 mEq/day (5 to 6 of NaCl) has been found to lower BP modestly—by 5/3 mm Hg on average (He & MacGregor, 2010)—as described further in Chapter 6.
- When prehypertensive individuals moderately restrict their sodium intake, progression to full-blown hypertension is reduced (Stamler et al., 1989; Whelton et al., 1998).
- Long-term intervention studies that start with infants and children to confirm that sodium restriction can prevent hypertension or that sodium excess can cause it are not feasible, but meta-analysis showed short-term benefits (He & MacGregor, 2006; Stamler et al., 1989). In 10 trials involving 966 children and adolescents, BP fell by an average of 1.1/1.2 mm Hg after salt intake had been reduced by 42% for an average of 4 weeks. In 3 trials involving 551 infants, systolic BP fell by 2.5 mm Hg after salt intake had been reduced by 54% for an average of 8 weeks.
Animal Studies
As seen in Figure 3-11, the most impressive evidence for salt-induced hypertension comes from a study on free-living chimpanzees, half of whom were given progressively increasing amounts of sodium in their food, while the other half remained on their usual low-sodium diet (Denton et al., 1995; Stamler et al., 1989). During the 89 weeks in which the chimps received extra sodium, the BP rose an average of 33/10 mm Hg, returning to baseline after 20 weeks without added sodium. In keeping with varying sodium sensitivity, the BP rose in only seven of ten chimpanzees on the added sodium. An important point is that the chimpanzees’ salt intake varied from 0.5 g/day (equivalent to that of our predecessors) to 10 to 15 g/day (equivalent to our modern high-salt diet).
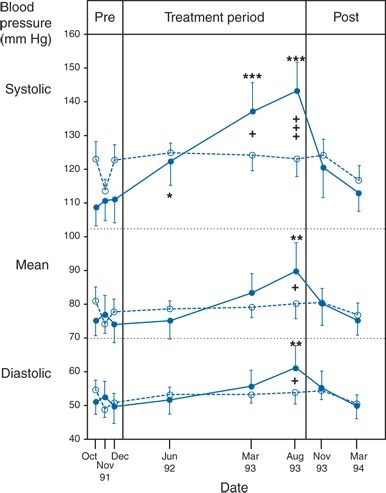
FIGURE 3-11 A group of 22 chimpanzees maintained in small, long-term, stable social groups and fed a vegetable–fruit diet with the addition of infant formula were studied. The 12 control animals (open circles, dotted line) experienced no change in conditions over 2.4 years and no significant change of systolic, diastolic, or mean BP (mean ± standard error of the mean). For the ten experimental animals (solid circles, solid line), 5 g/day NaCl was added to the infant formula for 19 weeks, 10 g/day for 3 weeks, and 15 g/day for 67 weeks. A 20-week period without salt addition followed. Significance values of the increase in BP relative to the mean of the three baseline determinations were as follows: *p < 0.05, **p < 0.0021; significance values of the difference between the experimental and control groups: *p < 0.05, ***p < 0.001. (Modified from Denton D, Weisinger R, Mundy NI, et al. The effect of increased salt intake on blood pressure of chimpanzees. Nat Med 1995;1:1009–1016.)
Human Genetic Studies
Impaired renal sodium excretion is the final common pathway mediating almost all of the rare monogenic causes of human hypertension (Lifton et al., 2001), as discussed later in this section.
Is There a J-Curve Between Salt Restriction and CV Risk?
Whereas He, MacGregor, and coworkers have argued that dietary salt restriction overwhelmingly reduces the risk of CV events (He & MacGregor, 2010), and a 2011 American Heart Association (AHA) report recommended strict population-wide salt restriction (sodium intake <1,500 mg/24 hours) (Appel et al., 2011), a 2013 Institute of Medicine report (IOM, 2013) concluded that the quality of the evidence was insufficient to support the AHA recommendation while Alderman and coworkers have argued that both very-high- and very-low-salt diets (the latter being recommended by the AHA) increase CV risk—a “sodium J-curve” (Graudal et al., 2014). The latter has been attributed to hypovolemia-induced reflex activation of the sympathetic nervous system and the renin–angiotensin system.
Evidence in favor of the sodium J-curve includes the following:
- In the ONTARGET and TRANSCEND trials, the observed relation between estimated sodium intake and CV events was J-shaped (O’Donnell et al., 2011). The study has been criticized because it was a post hoc observational analysis, and sodium intake was estimated from a single spot urine sodium that is a questionable surrogate (He & MacGregor, 2012).
- In a subset of 3,681 subjects without CVD at baseline in the prospective Flemish and European studies of genes and health outcomes, baseline 24-hour urinary sodium excretion showed a positive association with systolic BP both at baseline and at 6-year follow-up but a weakly inverse association with CV outcomes (Stolarz-Skrzypek et al., 2011).
- In a meta-analysis of 23 cohort studies and 2 follow-up studies of RCTs, both low sodium intakes and high sodium intakes were found to be associated with increased mortality (Graudal et al., 2014). No RCTs in healthy population samples were identified for inclusion in this meta-analysis.
The evidence against a sodium J-curve includes the following:
- The above meta-analysis by Graudal et al. has been criticized for including ultra short-term studies (4 to 5 days) of severe salt restriction (from 20 to 1 g/day) with thus limited public health implications (He et al., 2013). In contrast, a Cochrane systemic review and meta-analysis of 34 randomized trials of modest reduction in 24-hour urinary sodium excretion ranging from 40 to 120 mmol (equivalent to a reduction of 2.3 to 7 g of salt intake per day) for at least 4 weeks showed significant mean reductions in BP of −4/−2 mm Hg with minimal increases in plasma renin activity (PRA), serum aldosterone, and plasma NE and no change in plasma lipids (He et al., 2013). However, in the latter meta-analysis, CV outcomes were not assessed.
- A recent systemic review of observational studies supports a direct relation between sodium intake—starting with values as low as recommended by the AHA—and stroke (Whelton et al., 2012).
- The best evidence against a sodium J-curve comes from new 10–15 year follow-up data from the Trials of Hypertension Prevention (TOHP) showing a continuous decrease in CV events in prehypertensive subjects with decreased sodium intake as low as 1,500 mg/day (Fig. 3-12) (Cook et al., 2014). In contrast to meta-analyses that have included studies using dietary recall, spot urine sodium, or even a single 24-hour urine sodium, each subject in TOHP had three to seven 24-hour urine collections to obtain highly accurate measures of mean dietary salt exposure. This study overcomes other shortcomings of many previous studies on this topic such as short-term follow-up, confounding by potent diuretics, and reverse causality in observational studies with the sickest patients (i.e., with heart failure) receiving the most severely restricted sodium diets.
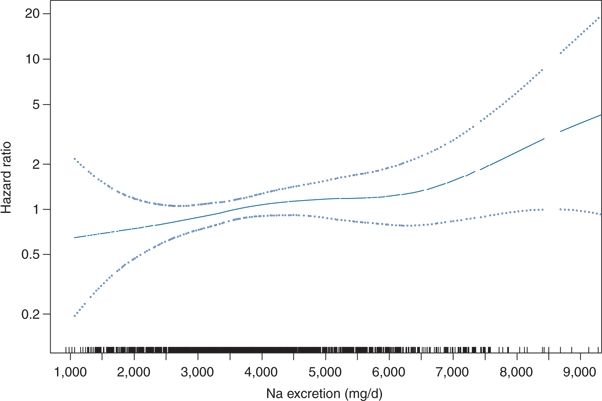
FIGURE 3-12 Long-term follow-up data from the TOHP. Spline plot of the hazard ratio for CV disease by mean sodium excretion expressed as milligrams per day, adjusted for covariables. These data show no evidence of a sodium J-curve in CV events. p-Value for linearity = 0.044; p value for nonlinearity = 0.76. Rug plot indicates distribution of sodium excretion. (From Cook NR, Appel LJ, Whelton PK. Lower levels of sodium intake and reduced cardiovascular risk. Circulation 2014;129:981–989.)
How Does Salt Raise BP?
There is no one simple explanation of how salt gluttony raises BP. There are multiple possibilities: Salt promotes vasoconstriction, vascular remodeling, and hypertension by both volume-dependent and volume-independent mechanisms (Rodriguez-Iturbe et al., 2007) (Table 3-2).
TABLE 3-2 How Sodium Retention Can Elevate BP
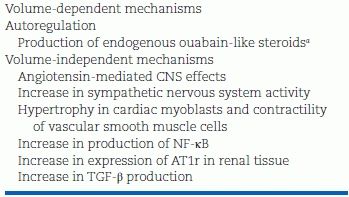
aExtracellular volume expansion induces the production of ouabain-like steroids with impairment of the sodium–potassium adenosine triphosphatase pump and increase in intracellular sodium. Sodium/calcium exchanger activity causes an increment in cytosolic calcium, which results in vasoconstriction and increased peripheral vascular resistance.
AT1r, angiotensin II type 1 receptor.
Adapted from Rodriguez-Iturbe B, Romero F, Johnson RJ. Pathophysiological mechanisms of salt-dependent hypertension. Am J Kidney Dis 2007;50:655–672.
Volume-Dependent Mechanisms
Sodium, the principal extracellular cation, is the primary determinant of extracellular fluid volume, which in turn drives cardiac preload and cardiac output. Increased cardiac output may initiate hypertension, but either small vessel vasoconstriction or large vessel stiffness seems needed to sustain it.
Two theories—autoregulation and endogenous ouabain-like compounds—have been at the heart of the volume-dependent mechanism.
Autoregulation
The process of autoregulation was first described by Borst and BorstDe (1963) and demonstrated experimentally by Guyton and Coleman (1969). According to this view, net renal sodium retention is the inciting event in all hypertensive states. The expanded blood volume increases cardiac preload and thus cardiac output, which increases perfusion of peripheral tissues. As tissue perfusion exceeds metabolic demands, the resistance arteries constrict, thereby stopping overperfusion but at the “expense” of increases in systemic vascular resistance and BP. The resultant increase in cardiac afterload returns cardiac output to normal. The term autoregulation implies that the vasoconstrictor response is an intrinsic property of vascular smooth muscle and does not require hormonal or neural inputs.
Guyton first showed conversion from high cardiac output to high systemic vascular resistance with inappropriately normal cardiac output during several days of volume infusion in dogs with reduced renal mass (Guyton, 1992) (Fig. 3-13). His concept has been supported by human studies indicating conversion over one or two decades from an initially high cardiac output to a later increased systemic vascular resistance (Julius et al., 1991).
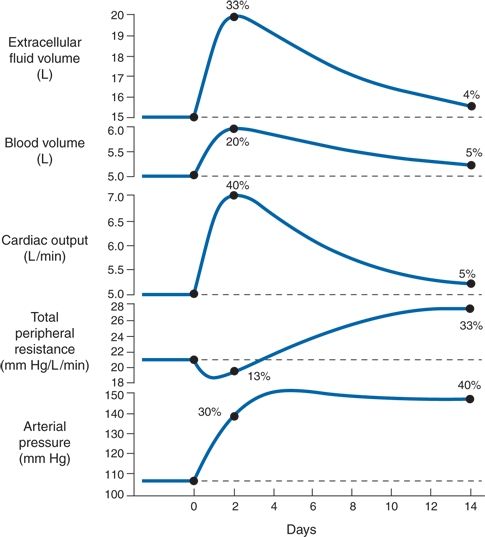
FIGURE 3-13 Progressive changes in important circulatory system variables during the first weeks in volume-loading hypertension. The initial rise in cardiac output is the basic cause of the hypertension. Subsequently, the autoregulation mechanism returns the cardiac output to almost normal and at the same time causes a secondary increase in total peripheral resistance. (Modified from Guyton AC. Kidneys and fluids in pressure regulation: Small volume but large pressure changes. Hypertension 1992;19:12–18.)
Autoregulation is a property of small arteries and thus may have little to do with ISH in the elderly, which involves mainly large conduit arteries (Franklin, 2012). It may play a larger role in the volume dependence of diastolic hypertension and of renal parenchymal hypertension, which is discussed in Chapter 9.
Endogenous Ouabain-Like Compounds
Haddy and Overbeck (1976) and Blaustein (1977) pioneered the theory that endogenous ouabain-like inhibitors (EOs) of Na-K-ATPase mediate peripheral vasoconstriction in salt hypertension. According to this theory, which has evolved over 40 years (Fig. 3-14), salt retention can stimulate the adrenal glomerulosa cells to release EOs (cardiac glycosides) that inhibit Na/K-ATPase in vascular smooth muscle and cardiac muscle; the resultant increase in Na flux drives the Na–Ca exchanger (NCX) to increase cytosolic Ca2+, enhancing vasoconstriction and cardiac contractility as well as Ca2+-dependent cardiac and vascular hypertrophy (Iwamoto, 2007). Also increased NaCl concentration in the CSF causes hypertension in mice mediated by an ouabain-like substance in the brain, specifically by its binding to an isoform of the Na, K-ATPase (Van Huysse et al., 2011).
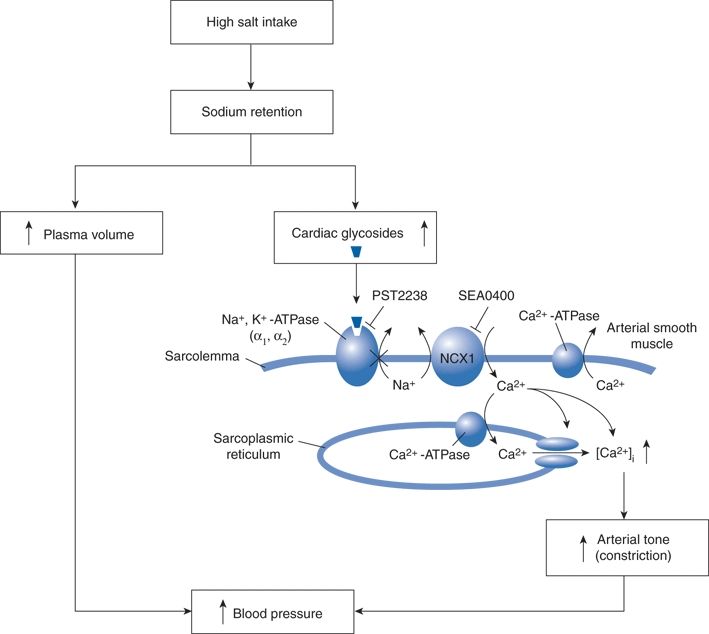
FIGURE 3-14 Proposed pathway by which Na+/Ca2+ exchange mediates salt-sensitive hypertension. High salt intake increases plasma levels of endogenous cardiac glycosides that inhibit Na+, K+−ATPase. This increases subplasma membrane [Na+] in arterial smooth muscle, which elevates cytosolic [Ca2+] via the Na+/Ca2+ exchanger (NCX1) and thus enhances arterial tone and contributes to hypertension. SEA0400, an inhibitor of NCX1, and PST2238, a ouabain antagonist, block Ca2+ entry and lower BP in experimental models of salt-sensitive hypertension. RyR, ryanodine receptor. (Modified from Iwamoto T. Na+/Ca2+ exchange as a drug target—insights from molecular pharmacology and genetic engineering. Ann N Y Acad Sci 2007;1099:516–528.)
Specific NCX inhibitors steeply reduce BP in multiple rat models of salt-sensitive hypertension but have no effect on BP in normotensive rats or those with hypertension that is not salt sensitive (Iwamoto, 2007). Thus, these and ouabain inhibitors may hold promise as new drugs specifically for salt-sensitive hypertension in patients.
Volume-Independent Mechanisms
Recent work has stressed several of the volume- independent mechanisms of salt-induced hypertension listed in Table 3-2:
- Small increases in serum Na may increase central sympathetic outflow (de Wardener et al., 2004). Small increases in Na in the CSF are sensed by Na channels in the subfornical organs (Orlov & Mongin, 2007).
- Extracellular sodium stimulates renal release of NF-κB and other proinflammatory cytokines that produce a chronic state of renal inflammation (Rodriguez-Iturbe et al., 2007).
- Extracellular sodium stimulates production of TGF-β, a profibrotic cytokine that promotes vascular remodeling and hypertension. Mice lacking Emilin-1, the endogenous inhibitor of TGF-β, develop salt-sensitive hypertension (Zacchigna et al., 2006).
- Extracellular sodium increases expression of the angiotensin II type 1 receptors in the kidney (Gu et al., 1998).
- Aldosterone does not cause trouble when dietary sodium is restricted but becomes a cardiac, vascular, and renal toxin—promoting inflammation and fibrosis—when dietary sodium is plentiful (Pimenta & Calhoun, 2006).
Salt Sensitivity and Salt Resistance
Most adults have eaten a high-sodium diet since childhood, but only a portion will have developed hypertension by age 55, suggesting a variable degree of BP sensitivity to sodium (Rodriguez-Iturbe et al., 2007).
In the rat model developed by Lewis K. Dahl, inbred salt-sensitive rats remain normotensive on a low-salt diet but develop hypertension on a high-salt diet, whereas salt-resistant rats remain normotensive even on high salt (Dahl & Heine, 1975). Thus, salt-sensitive hypertension is often viewed as a classic example of a gene–environment interaction. But, in humans, salt sensitivity also can be acquired—e.g., from weight gain, from low dietary potassium, from nonspecific renal injury, or from progressive renal injury caused by uncontrolled hypertension.
Salt sensitivity—and salt resistance—may be caused by mechanisms that are both intrinsic and extrinsic to the kidney (Table 3-3).
TABLE 3-3 Pathophysiologic Mechanisms Resulting in a Sustained Tendency to Sodium Retention by the Kidneys
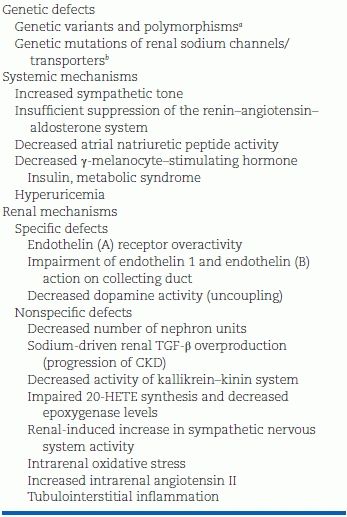
aGlucocorticoid-remediable aldosteronism, the p.Gly460Trp variant of the α-adducin gene, the p.Gly40Ser variant of the glucagon gene, mutations of glucocorticoid-regulated kinase, gene families involved in the metabolism of arachidonic acid (SS [homozygous for a small number of repeats] genotype of the human prostacyclin synthase gene), angiotensinogen polymorphisms.
bMutations in the β and γ subunits of amiloride-sensitive ENaC (Liddle syndrome), sodium-chloride cotransport (Gitelman syndrome), sodium–potassium–chloride cotransport, potassium and chloride channels (Bartter syndrome), WNK1 and WNK4 kinases (Gordon syndrome), aldosterone synthase/11β hydroxylase (glucocorticoid-remediable aldosteronism), 11β hydroxylase/11α hydroxylase (adrenal hyperplasia), mineralocorticoid receptor, 11β hydroxysteroid dehydrogenase (apparent mineralocorticoid excess), MR (progesterone-induced hypertension), pseudohypoaldosteronism.
TGF-β, transforming growth factor-β; CKD, chronic kidney disease; 20-HETE, 20-hydroxyarachidonic acid.
Monogenic Human Hypertension and Hypotension
The study of rare Mendelian traits by Richard Lifton’s group and others has identified 20 genes in which homozygous mutations cause severe familial forms of hypotension or hypertension (Lifton et al., 2001). Remarkably, every one of these different mutations affects BP mainly by altering the kidney’s ability to excrete sodium as illustrated in Figure 3-15.
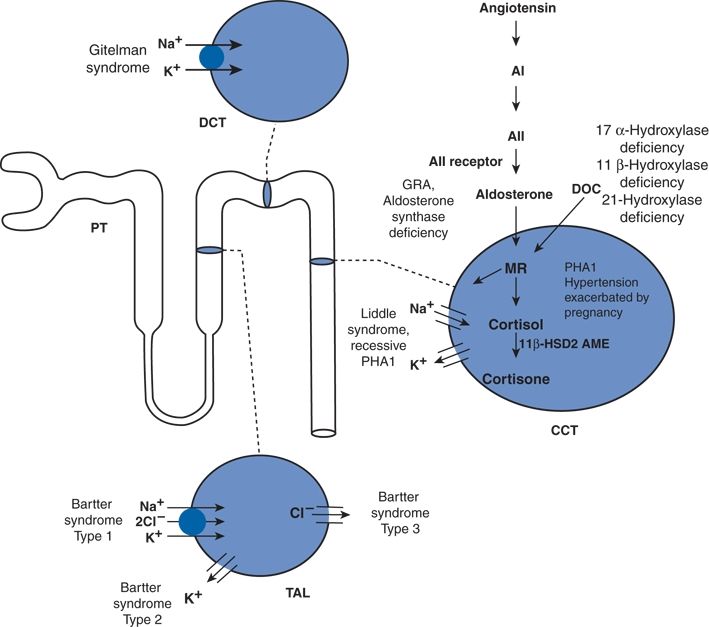
FIGURE 3-15 Mutations altering BP in humans—a diagram of nephron, the filtering unit of the kidney, is shown. The molecular pathways mediating NaCl reabsorption in individual renal cells in the thick ascending limb of the loop of Henle (TAL), distal convoluted tubule (DCT), and the cortical collecting tubule (CCT) are indicated, along with the pathway of the renin–angiotensin system, the major regulator of renal salt reabsorption. Inherited diseases affecting these pathways are indicated, with hypertensive disorders underlined. AI, angiotensin I; ACE, angiotensin-converting enzyme; A II, angiotensin II; MR, mineralocorticoid receptor; GRA, glucocorticoid-remediable aldosteronism; PHA1, pseudohypoaldosteronism, type-1; AME, apparent mineralocorticoid excess; 11 βHSD2, 11β-hydroxysteriod dehydrogenase-2; DOC, deoxycorticosterone; and PT, proximal tubule. (Adapted from Lifton RP, Gharavi AG, Geller DS. Molecular mechanisms of human hypertension. Cell 2001;104:545–556.)
To maintain salt and water balance, the kidneys normally reabsorb greater than 99% of the filtered sodium load as follows: 60% of the filtered sodium is reabsorbed in the proximal tubule by Na+/H+ exchange, the target of acetazolamide; 30% in the thick ascending limb of the loop of Henle by the Na–K–2Cl transporter, the target of the “loop” diuretics; 7% in the distal convoluted tubule by the Na–Cl cotransporter, the target of the thiazide diuretics; and 2% in the cortical collecting duct by the epithelial sodium channel (ENaC), which is activated by aldosterone (as part of the effector arm of the RAAS) and the target of the aldosterone antagonists.
In the familial hypotensive disorders, exemplified by Bartter and Gitelman syndromes, the disease-causing mutations impair the diuretic-sensitive transporters, leading to salt wasting and hypovolemic hypotension (Lifton et al., 2001). They typically present in the neonatal period or early childhood.
In the familial hypertensive disorders, the disease-causing mutations all increase ENaC activity either directly as in Liddle syndrome or indirectly due to overproduction of mineralocorticoids as in glucocorticoid-remediable aldosteronism or dysregulation of the MR as pregnancy-exacerbated hypertension (Lifton et al., 2001). The net result is severe salt-sensitive hypertension typically presenting in the first two decades of life. Targeted diuretic therapy is the cornerstone of treatment.
Whether these or other mutations are involved in common primary hypertension in the general population is discussed later in this chapter. Here, suffice it to say that these are extreme experiments of nature, proving that altered renal sodium handling can have dramatic effects on human BP.
However, as described next, defining more moderate degrees of sodium resistance and sodium sensitivity in human subjects requires strict clinical research methodology, which is generally too cumbersome for routine clinical use.
Clinical Research Methodology
Since Luft and Weinberger (1997) and Kawasaki et al. (1978) described varying responses of BP to short periods of low and high sodium intake, numerous protocols have been used to determine sodium sensitivity with variable results (de la Sierra et al., 2002).
Weinberger et al. (1986) defined sodium sensitivity as a 10-mm Hg or greater decrease in mean BP from the level measured after a 4-hour infusion of 2 L normal saline as compared to the level measured the morning after 1 day of a 10-mmol sodium diet, during which three oral doses of furosemide were given at 10 a.m., 2 p.m., and 6 p.m. Using this criterion, these researchers found that 51% of hypertensives and 26% of normotensives were sodium sensitive. Most studies find BP to be more salt sensitive among persons who are older, overweight, hypertensive, or of African descent (Luft & Weinberger, 1997).
Heightened BP reactivity to cold pressor testing may be an easier way to identify individuals with sodium-sensitive BP (Chen et al., 2008a). A high dietary intake of sodium (relative to potassium) may act both centrally to augment the sympathetic reactivity to many stimuli such as cold stress and peripherally to augment vascular reactivity to neurally released NE.
23Na MRI holds promise as a powerful new research tool to improve the mechanistic understanding of how sodium is stored in the body and contributes to hypertension (Kopp et al., 2012, 2013). Na+ is bound to negatively charged proteoglycans that are plentiful in skin and skeletal muscle; when this storage is perturbed, salt-sensitive hypertension may result. This in vivo noninvasive MRI technique has been validated against chemical analysis in tissue extracts and by showing increased tissue deposition of Na+ in patients with primary aldosteronism that normalized after successful therapy (Kopp et al., 2012). In a cross-sectional study of 57 men and women with primary hypertension and 56 healthy controls, Na+ concentration in skin and skeletal muscle was found to increase with age and to be higher in patients with refractory hypertension (Fig. 3-16) (Kopp et al., 2013). Further work will be needed to determine if differences can be detected between patients with salt-sensitive versus salt-resistant hypertension and if tissue Na+ predicts the BP response to diuretic therapy.
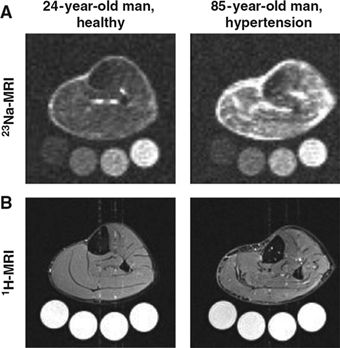
FIGURE 3-16 23Na magnetic resonance imaging (23Na-MRI) of tissue Na+. A: Representative 23Na-MRI image of the lower leg of a young normotensive man and, for comparison, an elderly man with hypertension in whom skin and muscle sodium concentration is clearly increased. Tubes with solutions containing 10, 20, 30, and 40 mmol/L of NaCl are arranged below the extremity for calibration. B: Tissue water in the same two subjects detected with conventional 1H-MRI, which shows no visible difference in muscle water content. (From Kopp C, Linz P, Dahlmann A, et al. 23Na magnetic resonance imaging-determined tissue sodium in healthy subjects and hypertensive patients. Hypertension 2013;61:635–640.)
Importance of Pressure–Natriuresis
In normotensive people, when BP rises, renal excretion of sodium and water increases, shrinking fluid volume and returning the BP to normal—the phenomenon of pressure–natriuresis. On the basis of animal experiments and computer models, Guyton (1961, 1992) considered the regulation of body fluid volume by the kidneys to be the dominant mechanism for the long-term control of BP—the only one of many regulatory controls to have sustained and infinite power. Therefore, if hypertension develops, he reasoned that something must be amiss with pressure–natriuresis; otherwise, the BP would return to normal.
Experimental Support
The concept has a solid foundation: When BP is raised, the normal kidney excretes more salt and water—i.e., pressure–natriuresis occurs (Selkurt, 1951). The curve relating BP to sodium excretion is steep (Fig. 3-17). A small change in renal perfusion pressure causes a large change in the rate of sodium and water excretion, acting as a powerful negative feedback stabilizer of BP. As BP rises, increased renal perfusion pressure leads to a decrease in sodium reabsorption—particularly in the medulla in the thick ascending limb of the loop of Henle (Cowley, 2008; Dickhout et al., 2002). As a result, body fluid volumes shrink enough to lower BP back to its previous normal level.
Related posts:

Stay updated, free articles. Join our Telegram channel

Full access? Get Clinical Tree


