CHAPTER 109 Radiologic Features of Central Nervous System Tumors
Principles of Diagnosis by Neuroradiology
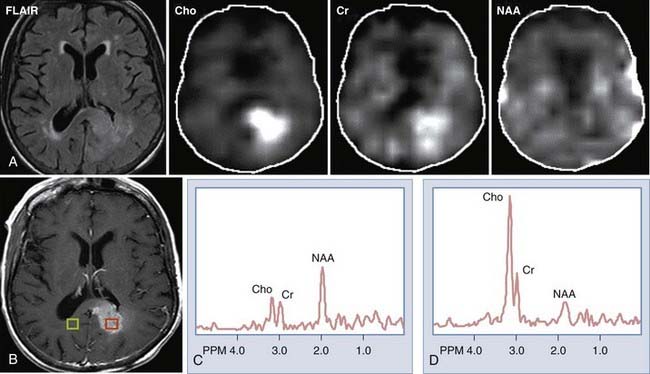
Advanced Imaging Techniques
Determining where an intracranial lesion is located is fundamentally important to both the neuroradiologist and the neurosurgeon because it is often the case that the histologic category of the lesion can be accurately predicted on the basis of its location. In recent years, however, it has also become possible to localize the regions of likely maximal malignancy within the lesion as well as to depict with increasing accuracy the relationship of the lesion to surrounding structures. These efforts are typically undertaken to optimize the surgical path to the mass and to reduce or at least to predict surgically related morbidity.
The fundamentals of lesion localization have not changed very much over the years, although the tools for doing so have made the task easier. The fundamental determination to be made remains whether the lesion is within the brain parenchyma or is extra-axial.
Beyond standard computed tomography (CT) and magnetic resonance imaging (MRI), techniques for characterizing the nature of the lesion include magnetic resonance spectroscopy (MRS) and regional cerebral blood flow and blood volume estimates. Functional MRI (fMRI) and more recently developed diffusion tensor imaging (DTI)-based techniques such as magnetic resonance tractography have been shown to be helpful for depiction of functionally important cortical regions and white matter tracts in the vicinity of either the lesion itself or the surgical path toward the lesion.
Spectroscopy
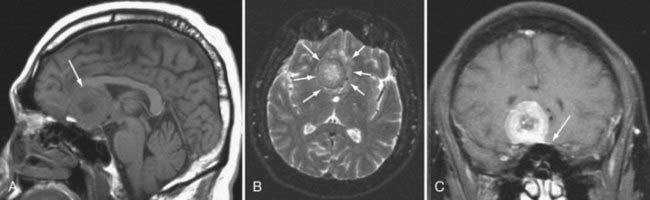
MRS provides information regarding the biochemical milieu within a relatively small volume of interest. Although it began, and is often still used, as a single voxel technique—gathering data from a usually cubic volume measuring between 1 and 2 cm—more modern implementations of MRS allow for acquisition of MRS data from arrays of smaller voxels (usually about 1 cm3 depending on the technical attributes of the imaging system) localized in multiple coplanar sections. These MRS imaging techniques can provide information on spatial variation in biochemical markers that can be used to distinguish among different types of tumors, and that can roughly index a lesion’s degree of malignancy (Fig. 109-1). Among the major markers are N-acetyl aspartate (NAA), choline, creatine, myoinositol, lactate, and lipid. Relevant spectroscopic features of different lesions are discussed throughout this chapter, but a general rule of thumb is that the more malignant the lesion, the lower the NAA and the higher the choline concentrations.

FIGURE 109-1 Spectroscopic analysis of a left periatrial glioblastoma multiforme (GBM). A, Axial fluid-attenuated inversion recovery (FLAIR) images demonstrate elevated signal in the left periatrial region. The choline (Cho) and creatine (Cr) maps show hyperintensity in this region, corresponding to elevated levels of these metabolites, whereas the N-acetyl aspartate (NAA) map shows collocated signal hypointensity, reflecting reduced NAA. B, Individual voxels from the spectroscopic imaging maps, with one voxel over the region of abnormality on the left and the other over the contralateral, normal, right periatrial white matter. C, A normal spectrum. D, Characteristic spectrum from a high-grade tumor, with marked elevation of choline, lesser elevation of creatine, and marked reduction in NAA.
(Spectroscopic data courtesy of Dr. Peter Barker, Johns Hopkins University.)
Cerebral Blood Flow and Volume Estimates
Measures of cerebral blood flow (CBF) and cerebral blood volume (CBV) within tumors using MRI1–4 or, more recently, CT5,6 provide quantitative correlates of what has been known since cerebral angiography as one of the mainstays for brain tumor localization and characterization, that is, that tumors frequently contain dysplastic blood vessels that exhibit blood (contrast) transit time that is markedly slower than is that within the surrounding parenchyma. In the case of many tumors, catheter angiography would demonstrate a tumor blush, indicative of an abnormally enlarged blood pool. MRI or CT perfusion data correlate reasonably well with tumor grade, with higher grade tumors exhibiting greater CBV.1,7–9 There is also some evidence that blood volume measurements have prognostic value, with low-grade tumors that have higher blood volumes advancing in grade more rapidly than tumors with similar histology but lower blood volumes.10
Functional Magnetic Resonance Imaging
The early 1990s saw the development of imaging techniques which could assay dynamic changes in blood flow and blood oxygen extraction as a proxy for regional brain neural activity.11,12 These techniques became known as fMRI and were based on the observations that the concentration of deoxyhemoglobin in blood affected the nuclear magnetic resonance parameter known as T2*—with a higher concentration being associated with a shorter T2*13—and that with brain activation, there is an increase in regional cerebral blood flow out of proportion to the increase in oxygen extraction.14 With regional brain activation, the disproportionate increase in blood flow compared with oxygen extraction leads to a higher concentration of oxyhemoglobin in the venous efflux and thus a reduced concentration of venous deoxyhemoglobin. The reduced concentration of deoxyhemoglobin and concomitant prolongation of T2* leads to a regional task-related increase in signal.
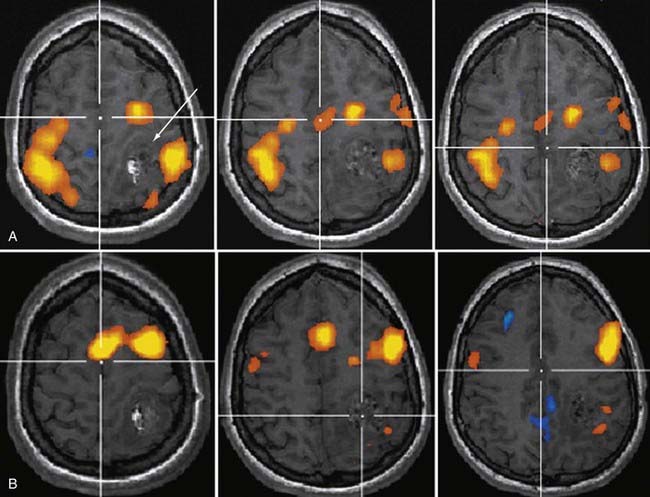
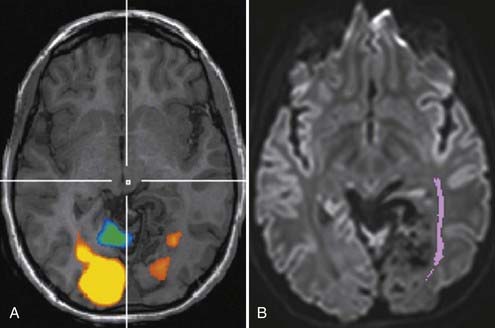
Soon after its introduction, investigators proposed fMRI as a tool in preneurosurgical planning15 and established that its ability to localize primary sensorimotor cortex compared reasonably well with electrophysiologic techniques.16–19 In the neurosurgical setting, the earliest and probably still most common applications of fMRI have been in localizing the hand-arm representation in the primary sensorimotor regions, although with the development of a broad array of paradigms, interrogation of language-related brain regions has become virtually as common (Fig. 109-2). fMRI has been shown useful in demonstrating the degree to which regions of eloquent cortex have been displaced by tumors or have undergone reorganization because of regional cortical dysplasia or dysfunction.20,21 In 1999, Lee and colleagues at the Mayo Clinic published a summary of their experience using fMRI in the setting of presurgical evaluation of tumor and seizure patients.21 They found that they were able to use fMRI to identify the primary sensorimotor region in 70% of patients; their success rate was close to 90% when they considered only the patients they evaluated using more recently developed data acquisition techniques.

FIGURE 109-2 Functional MRI results obtained with cued bilateral finger movements (A) and verb generation (B) in a 22-year-old patient with a left parietal giant cell ependymoma (white arrow in left upper image).
Like any technique, fMRI does not always work; the patients who are being evaluated frequently move more than healthy volunteers, which will almost certainly have an adverse effect on the quality of the data,22 as will reduced vasoreactivity in the vicinity of tumors or vascular malformations. As techniques have improved over time, especially for rapid data acquisition and for patient motion correction, the applicability of fMRI as a neurosurgical planning tool has increased.
Diffusion Tensor Imaging and Tractography
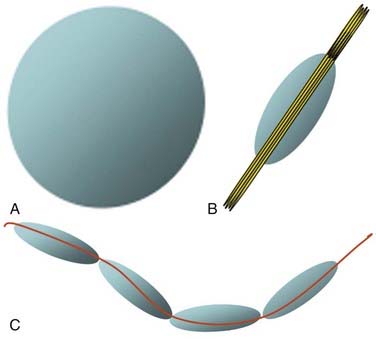
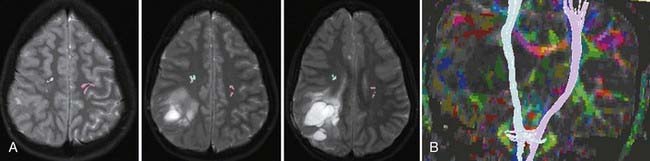
Although fMRI to estimate the proximity of functional cortex to a tumor has been available since the mid-1990s, techniques for estimating the proximity of major white matter tracts have developed much more recently, and as of this writing (mid-2008) remain under active development. These techniques are based on the biophysical observation that water molecules within axons move in a relatively unconstrained manner longitudinally along the length of the axon, whereas those molecules can move only a short distance radially before they encounter either microtubules or the axonal membrane.23–26 Thus, if one were to measure and plot within any given imaging voxel the ability of water molecules to move in a relatively unconstrained way, one would end up with a blimp or cigar-shaped plot, oriented roughly along the axes of the axons that run through that voxel. This plot represents graphically what is known mathematically as the diffusion tensor. Conceptually, by assessing the directionality of water diffusivity in each small imaging voxel and then linking the measures of maximal diffusivity end to end, one can begin to discern the trajectories of white matter tracts as they run through the brain (Fig. 109-3, and Fig. 109-4 for a clinical example). Ongoing technical developments include improvements in tracking white matter bundles through edema surrounding tumors (and even through tumors) and in separating white matter tracts that closely approximate one another, or that cross one another within a group of voxels.27–31

FIGURE 109-3 Diffusion tensor imaging (DTI) and tractography. A, Spherical representation of the diffusion tensor that one would find without the directionality imposed by a white matter tract. B, Elongated diffusion tensor representation, with the long axis of the ellipse corresponding to the dominant direction of the axons (thin tubes) within the voxel. C, Approximate trajectory of a white matter tract (red line) estimated by linking end to end a series of elongated diffusion tensor representations such as depicted in B.

FIGURE 109-4 Tractography in a patient with a right cerebral hemisphere glioblastoma multiforme. A, Axial T2-weighted images showing cross sections of the tractographic representations of the left (pink) and right (blue) corticospinal tracts at the level of the mass. Note the medial and anterior displacement of the right tract due to mass effect from the tumor. B, Reconstruction of the tracts, showing medial displacement of that on the right due to the mass.
Often fMRI and DTI-tractography results can be used complementarily because in the vicinity of brain tumors or vascular malformations, the coupling between neural activity and the reactive changes in blood flow on which fMRI signal changes depend is often impaired. In such cases, the fMRI data may be of reduced utility, whereas the tractographic data may still be quite robust (Fig. 109-5). Conversely, extensive edema may render the tractographic data suboptimal, whereas the fMRI signal changes in the overlying cortex remain relatively unaffected.

FIGURE 109-5 Functional magnetic resonance imaging (fMRI) (A) and DTI-based tractography (B) in a patient with a left occipital arteriovenous malformation. The patient’s visual fields are completely intact bilaterally, yet multiple visual fMRI tasks resulted in markedly asymmetric signal change, presumably because of impaired vasoreactivity in the vicinity of the lesion. The tractographic data, however, show slight lateral displacement of the optic radiations. These data aided in surgical planning for lesion resection.
The additions of advanced neuroimaging techniques notwithstanding, the first decision a neuroradiologist must make when evaluating an intracranial mass is whether the lesion is intraparenchymal or extra-axial. Extra-axial masses frequently exhibit at least some of the following characteristics:
Although each of these findings may also be identified with lesions that are intracranial (especially infiltration of or reaction by the overlying bone and relative absence of vasogenic edema), a combination of these features would suggest an extra-axial process.
Among the extra-axial processes, five are most common: meningioma, schwannoma, lymphoma, metastases, and granulomatous diseases (most notably sarcoidosis). Schwannomas occur in stereotypical locations associated with cranial nerves and rarely have dural tails of enhancing tissue arising from the margins of the lesion. In the case of dural or epidural metastases and dural lymphoma, the clinical picture usually suggests the diagnosis because of prior histories of a primary malignancy, systemic lymphoma, or HIV disease (although intraparenchymal central nervous system [CNS] lymphoma is far more common than dural-based lymphoma in the AIDS setting). Sarcoidosis may affect the pia, dura, or parenchyma and will commonly have pulmonary manifestations. It may elicit more of a parenchymal inflammatory and edematous reaction than the other diagnoses. Other granulomatous diseases such as tuberculosis or fungal infection are differentiated based on systemic symptoms. In the end, meningiomas still predominate in the extra-axial compartment, and unless there are unusual features as described previously, this is the most likely diagnosis to consider. Particularly with a dural tail and fine calcification or bony reaction, meningioma is the top choice.
Features that suggest that masses are intra-axial include the following:
When lesions grow through the margins of the dura, as in some aggressive meningiomas or cases of glioblastoma multiforme (GBM), the analysis of these lesions becomes much more difficult.
These caveats aside, the presence of necrosis, edema, and calcification and the location are the main factors that suggest a specific histologic classification. Most higher grade astrocytomas, primitive neuroectodermal tumors (PNETs), and lymphomas enhance. If a lesion does not enhance, one is likely to be dealing with a low-grade astrocytoma (pilocytic astrocytomas excluded), ganglioglioma, or subependymoma. Absence of enhancement virtually excludes metastases, hemangioblastomas, and GBM.
Necrosis is often evident in high-grade astrocytomas and usually implies a GBM. Although lymphomas in the non-AIDS population rarely show necrosis, such necrosis is much more often seen in AIDS-related CNS lymphomas. Metastases often demonstrate central necrosis. Often one must distinguish among cyst formation (seen frequently in hemangioblastoma, pilocytic astrocytoma, desmoplastic infantile ganglioglioma [DIG], dysembryoplastic neuroectodermal tumor [DNET], and ganglioglioma) and necrosis. The latter is usually much more irregular and elicits more edema in the surrounding tissue.
Edema may be absent with low-grade astrocytomas, gangliogliomas, DIGs, ependymomas, hemangioblastomas, some PNETs, and some DNETs. The lesions with the greatest degree of edema are the lymphomas, glioblastomas, and metastases. A lesion such as gliomatosis cerebri may infiltrate without evoking edema. Most lesions that evoke edema also produce mass effect unless they are merely infiltrating the cortex like gangliogliomas and DNETs.
Calcification occurs frequently with oligodendrogliomas, neurocytomas, and craniopharyngiomas. Nonetheless, by virtue of their higher incidence, astrocytomas still represent the most common calcified tumor. The calcification of an oligodendroglioma tends to be coarser than the more stippled calcification of astrocytomas. The metastases that calcify include mucinous adenocarcinomas, osteosarcomas, and chondrosarcomas.
Finally one must assess location. A lesion confined to or based predominantly in the gray matter likely represents a ganglioglioma, DNET, cortical dysplasia, or pleomorphic xanthoastrocytoma. Lesions that cross the corpus callosum are usually high-grade astrocytomas or lymphoma. Metastases do not as a rule cross the corpus callosum. Hemangioblastomas usually occur in the cerebellum, often bordering on the pia. Neurocytomas are found most commonly along the septum pellucidum. Oligodendrogliomas favor the temporal lobes, as do DNETs, DIGs, and pleomorphic xanthoastrocytoma. Clearly, the differential diagnosis of a pineal region mass differs from one in the suprasellar region (although germinomas and meningiomas may break that rule) or one that is in the ventricle. Location is a critical piece of the analysis.
This initial review offers insight into the framework that is used to diagnose most intracranial masses, with the understanding that radiology rarely preempts a histologic specimen, particularly for the intra-axial masses.
Extra-Axial Masses
Meningioma
By far, the most common extra-axial neoplasm to affect the intracranial compartment is the meningioma. This tumor is characterized by hyperdensity relative to normal brain parenchyma on CT, isointensity on T1-weighted images relative to gray matter, and slight hyperintensity on T2-weighted images (Fig. 109-6). It should be noted, however, that there is a wide variety of signal intensity characteristics associated with meningiomas, and in fact, some reports suggest that syncytial, transitional, and angioimmunoblastic meningiomas may have differing signal intensity characteristics depending on their internal histology. Nearly all meningiomas show strong contrast enhancement on either CT or MRI. Meningiomas may show stippled or confluent calcification. If the meningioma is extensively calcified, enhancement may be less evident.

FIGURE 109-6 Planum sphenoidale meningioma. A, Much of the mass on this unenhanced sagittal T1-weighted image demonstrates signal that is close to isointense to brain parenchyma (arrow) but is sharply demarcated from the immediately overlying rostrum and genu of the corpus callosum. B, On the axial T2-weighted image, the mass is again seen to displace (arrows) rather than invade or arise from the brain parenchyma. Except for the center of the mass, much of it exhibits T2-weighted signal close to that of the surrounding brain. C, Coronal postgadolinium T1-weighted image shows the marked enhancement and a small dural tail (arrow) projecting leftward from the base of the mass.
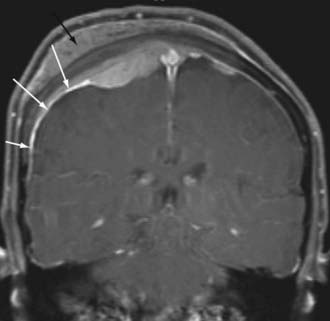
Meningiomas also have a characteristic “dural tail,” which represents contrast enhancement extending along the margins of the tumor affecting the pachymeninges (Fig. 109-7). Some histologic studies have suggested that the entirety of the dural tail represents meningioma tumor, whereas others have suggested that this may represent reactive change adjacent to neoplasm.32

FIGURE 109-7 Convexity meningioma. This lesion, which has extended extracranially (black arrow), as well as intracranially, demonstrates a “dural tail” (white arrows) that extends down over the right hemispheric convexity.
Bony lysis or sclerosis may be seen in about 30% of patients who have meningiomas. Viewing the CT scans using bone windows may be useful in detecting the increased density and overgrowth of the bone and the lytic areas adjacent to the meningioma. Although these areas usually represent a reaction by osteoblasts to the tumor, in some cases the meningioma may permeate the bone.
The spectroscopic features of meningioma on proton spectroscopy include absence of NAA and elevations of choline peaks. The height of the NAA and creatine peaks may be markedly reduced. Alanine has been suggested to be a specific marker for meningiomas, but its presence is variable.33–35 Although this may help differentiate a meningioma from an intra-axial mass, many other extra-axial masses (see later) have a similar spectroscopic signature.
Meningiomas may deviate from the characteristic benign appearance in many different ways and on occasion demonstrate necrosis, fatty degeneration, cystic areas, infiltration into the brain, infiltration into the bone, and marked vasogenic edema.36 The presence of vasogenic edema associated with meningiomas has been correlated with the lesion size as well as the degree of parasitization of dural venous structures.
On dynamic imaging with contrast agents, the meningiomas show slow uptake of the contrast agent in a continuous fashion followed by a lengthy period of stable enhancement and a delayed clearance of the contrast agent. MRI-based estimates of CBV has been shown to help differentiate between meningioma and dural-based metastatic deposits, with the meningiomas typically showing substantially greater CBV.37 Angiographically, dural vessels generally supply the lesions. This usually means that the branches of the external carotid artery, including the middle meningeal artery or stylomastoid branches of the occipital artery, supply the mass. Nonetheless, branches of the tentorial artery from petrous carotid meningeal branches may be responsible for the primary supply of tentorial meningiomas. Similarly, meningiomas around the cavernous sinus may have direct carotid branches supplying the lesion. Meningiomas at the foramen magnum may receive blood supply from branches of the vertebral artery or posterior inferior cerebellar artery.
Schwannoma
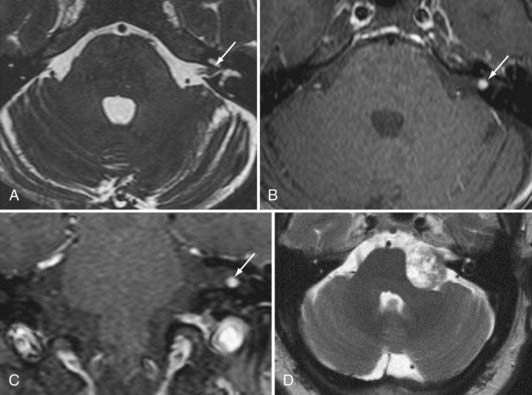
The next most common extra-axial mass is the schwannoma, dominated by those that occur in and around the internal auditory canal. This lesion characteristically resides in the cerebellopontine angle or in the internal auditory canal, arising most often from the vestibular branches of the 8th cranial nerve (Fig. 109-8). Its imaging characteristics are similar to those of a meningioma from the standpoint of being relatively isointense to gray matter, but the absence of a dural tail usually helps to distinguish these two lesions. Vestibular schwannomas, however, may show cystic degeneration as well as hemorrhage and occasionally cause edema in adjacent brain tissue. As opposed to meningiomas, it would be highly unusual for an acoustic schwannoma to cause bony lysis or bony sclerosis. In particular, if a cerebellopontine angle lesion shows enhancing tumor entering the internal auditory canal, one would favor vestibular schwannoma over meningioma.

FIGURE 109-8 Vestibular schwannomas. A, T2-weighted axial image showing small soft tissue intensity mass (arrow) near the fundus of the left internal auditory canal, along with axial (B) and coronal (C) postgadolinium T1-weighted images. D, Axial T2-weighted image of a vestibular schwannoma from another patient, showing the widened cerebrospinal fluid spaces around the lesion, characteristic of an extra-axial mass, as well as the foci of elevated signal within the mass representing cystic degeneration.
Schwannomas of other cranial nerves, particularly of either the 7th or the 5th cranial nerve, are the next most likely extra-axial masses to arise from the cerebellopontine angle region or from the lateral pons. They have imaging characteristics similar to those of vestibular schwannomas, but they may be distinguished by virtue of their location and plane of growth. Schwannomas of the 5th cranial nerve will, as expected, track along this nerve on its trajectory from the lateral aspect of the pons and are oriented toward the Meckel’s cave region inferolateral to the cavernous sinus. Some branches of the 5th cranial nerve may show contrast enhancement within the cavernous sinus or the pterygopalatine fossa. The 7th cranial nerve schwannomas may occur in the cerebellopontine angle cistern, the internal auditory canal, or the temporal bone. They rarely are seen at the stylomastoid foramen region or in the parotid gland.
Schwannomas of the 9th, 10th, and 11th cranial nerves are rarely seen in the intracranial compartment, but when they occur, they usually erode portions of the jugular foramen. Ninth cranial nerve schwannomas, in particular, present more frequently in the intracranial compartment than in the head and neck region. Schwannomas of the 3rd, 4th, and 6th cranial nerves may present in the basal cisterns or within the cavernous sinus. In the cavernous sinus, these are difficult to distinguish from cavernous sinus meningiomas. All schwannomas tend to enhance avidly.
Epidermoid
Epidermoid tumors may arise in the cerebellopontine angle, the suprasellar cistern, the diploic space, the peripineal region, or the middle cranial fossa. These lesions do not as a rule exhibit contrast enhancement. Epidermoids have signal intensity appearances that are pathognomonic: (1) very high signal intensity on T2-weighted images, (2) signal intensity close to that of cerebrospinal fluid (CSF) on T1-weighted images, (3) higher signal intensity than CSF on fluid-attenuated inversion recovery (FLAIR) MRI and diffusion-weighted imaging (DWI), (4) restricted diffusion that typically is depicted as low signal on apparent diffusion coefficient (ADC) images, and (5) absence of enhancement (Fig. 109-9). Epidermoid lesions tend to have a crenated margin and will infiltrate adjacent structures, particularly along the brainstem. The usual differential diagnosis with the epidermoid is the arachnoid cyst. Epidermoids can be distinguished from the latter because arachnoid cysts are as dark as CSF on FLAIR, diffusion, and steady-state free precession imaging. The signal intensity of epidermoids will not simulate CSF on these sequences.38 The arachnoid cyst is also more sharply delineated than is the epidermoid.

FIGURE 109-9 Epidermoid. A, Contrast-enhanced axial T1-weighted image demonstrates right cerebellopontine angle mass (arrow), showing close to cerebrospinal fluid (CSF) intensity signal on this sequence, and no postcontrast enhancement. B, Fluid-attenuated inversion recovery (FLAIR) image, showing the same lesion demonstrating signal intensity somewhat higher than CSF. C, On diffusion-weighted image, the lesion is hyperintense, whereas on the apparent diffusion coefficient map calculated from the diffusion data (D), the lesion (short arrow) is significantly lower in intensity than is the CSF in the fourth ventricle (long arrow).
Proton spectroscopy may help in some instances of cystic masses in the brain. Although cystic astrocytomas show NAA, choline, and creatine peaks (with or without lactate), epidermoid cysts show only lactate signal. There are no identifiable resonances from arachnoid and porencephalic cysts.39
Arachnoid Cyst
Arachnoid cysts tend to occur in a similar location as epidermoid tumors, but they are relatively frequently seen in the anterior aspect of the middle cranial fossa. In this location, they must be distinguished from atrophy-related dilation of the subarachnoid space. In many instances, this can be determined merely by the displacement of the blood vessels associated with an arachnoid cyst, whereas dilation of the subarachnoid space does not displace the vessels, which are seen coursing through the CSF. Additionally, arachnoid cysts may remodel and thin the bone, which would not be seen with atrophy and subarachnoid space dilation (in fact, the bone may become thicker in younger subjects). Its CSF density and intensity on all pulse sequences distinguishes the arachnoid cyst from the epidermoid tumor. It also does not enhance. One may see pulsation artifacts within an arachnoid cyst, which are not seen in an epidermoid tumor.
Pineal Region Tumors
Germinomas and Germ Cell Tumors
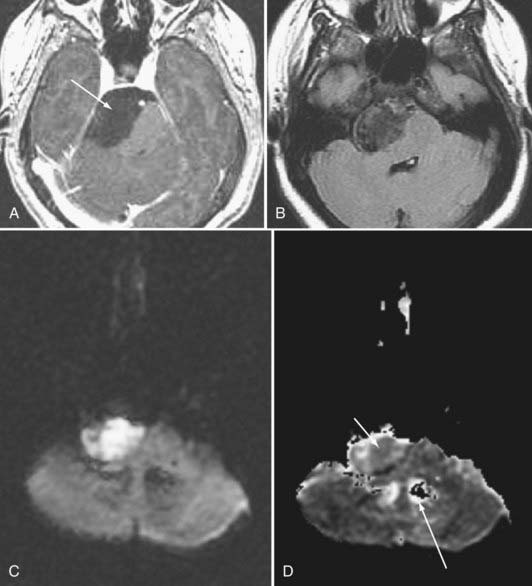
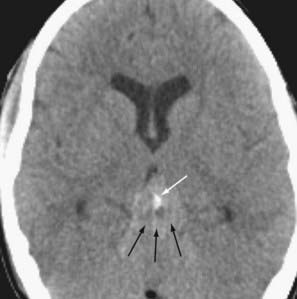
More than half of germinomas are denser than normal brain tissue on CT, and the remainder are isodense. Sometimes, the tumoral tissue surrounds the normal pineal gland, resulting in an engulfed appearance to the calcification (Fig. 109-10). Isointensity to low intensity on T1- and T2-weighted MRI is also the norm. Avid homogeneous enhancement characterizes germinomas. Cystic change occurs in 33% of pineal region, 28% of suprasellar, and 80% of basal ganglionic germinomas.40,41 CSF seeding occurs in 50% of pineal region, 28% of suprasellar, and 30% of basal ganglionic germinoma. Response to radiation therapy may be dramatic, with scans showing no evidence of tumor within 2 weeks after completion of radiation therapy.40 In some instances, complete resolution may not take place for 6 months after radiation. With treatment, the tumor may become hypodense and brighter on T2-weighted and FLAIR images. The presence of cystic change portends a worse response to radiation therapy (33% complete resolution if the mass is cystic, versus 90% without a cyst).

FIGURE 109-10 Germinoma. This CT scan shows a hyperdense mass (black arrows) in the pineal region engulfing the calcified pineal (white arrow). There is mild ventricular prominence, probably on the basis of obstruction of the cerebral aqueduct.

Stay updated, free articles. Join our Telegram channel

Full access? Get Clinical Tree

