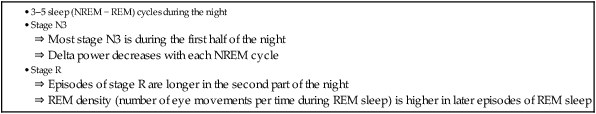
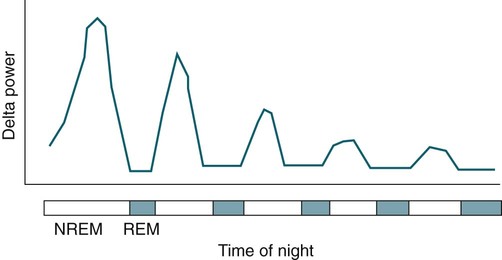
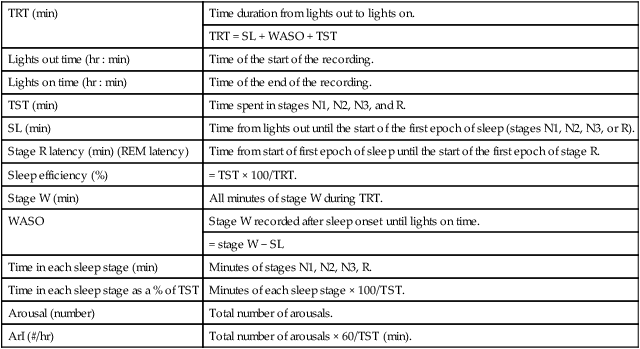
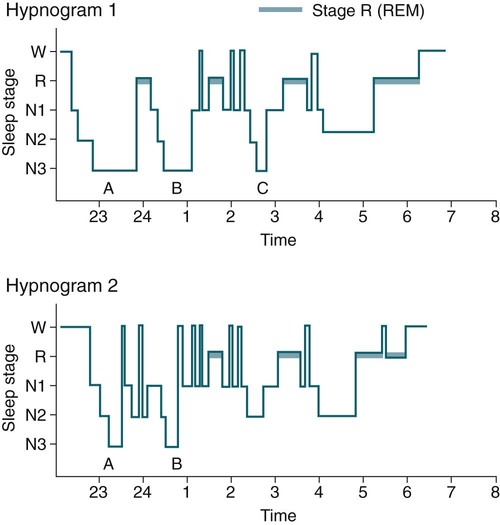
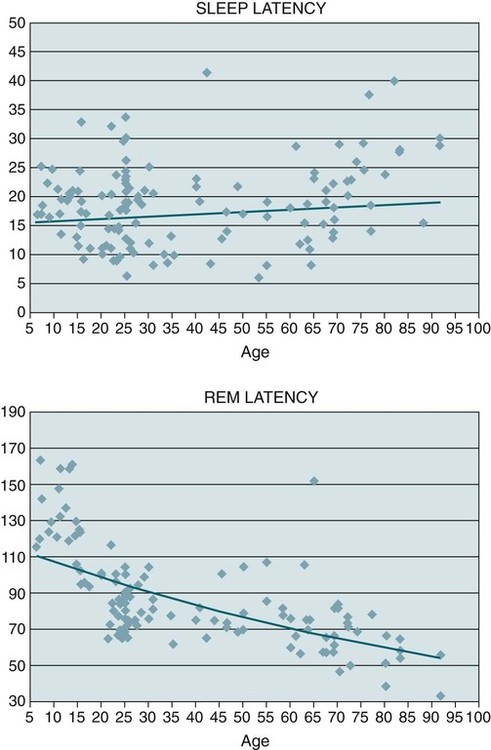
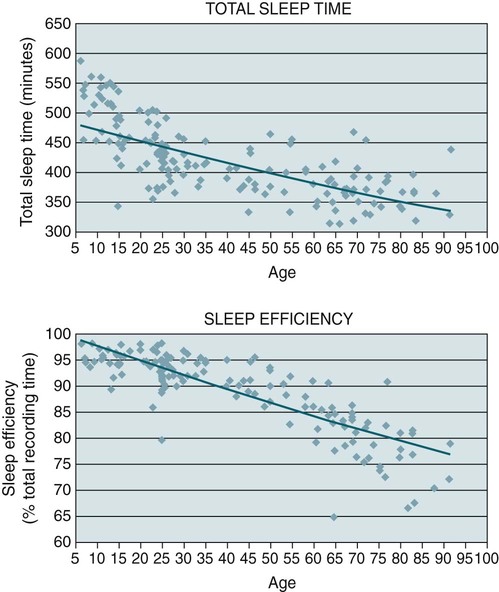
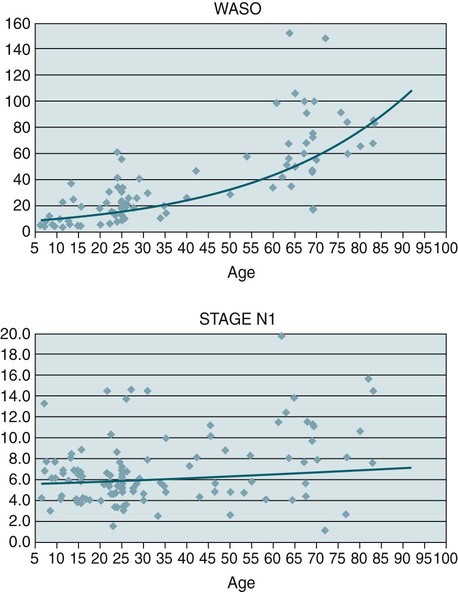
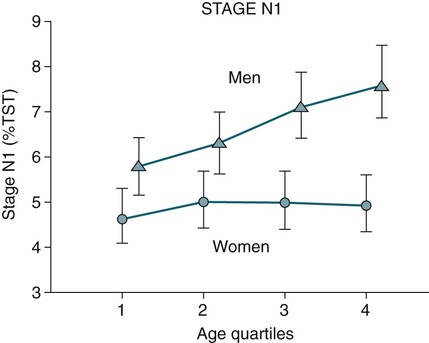
• Sleep in adults is characterized by 3 to 5 cycles of NREM/REM sleep, each lasting about 90 to 100 minutes. • The duration of stage R in each cycle is typically longer in the second part of the night. The individual episodes of REM are also longer. The REM density (eye movements/time) is greater in the second part of the night. • Most stage N3 occurs in the first part of the night. • In adults, the TST and sleep efficiency decrease and the amount of wake increases with age. There is also a modest increase in the sleep latency and a decrease in the REM latency. • In men, the amount of stage N3 decreases with age and the amount of stage N1 increases. In women, the amount of stage N3 does not decrease with age. • In adults, the amount of stage R decreases slightly with age. • The normal ArI increases with age. • A number of medications increase the REM latency including selective serotonin reuptake inhibitors, tricyclic antidepressants, and lithium. • Infants commonly enter sleep via stage R (or active sleep) and have a sleep cycle (45–60 min) that is much shorter than that of adults. • After sleep deprivation, recovery sleep is usually characterized by an increase in stage N3 on the first recovery night with an increase in REM sleep on subsequent nights. • Chronic sleep restriction can have a number of adverse health consequences. These include a reduction in leptin, an increase in ghrelin, and impaired glucose metabolism. A number of parameters concerning the quantity and quality of sleep are usually included in polysomnography (PSG) reports1,2 (Table 6–1). Typically, PSG data recording starts before lights out to verify that the electrodes and monitoring equipment are providing adequate signals. In addition, calibrations and biocalibrations are recorded as described in Chapter 4. Lights out time is the time at which the patient is allowed to fall asleep and marks the start of data that will be staged and analyzed. Lights on is the time that recording of sleep is terminated. Total recording time (TRT) is the time from lights out to lights on. Some sleep centers also record another set of biocalibrations after lights on. The sleep latency is the time from lights out to the start of the first epoch of sleep. Wake after sleep onset (WASO) as defined by the American Academy of Sleep Medicine (AASM) scoring manual includes all stage W after sleep onset (from the start of the first epoch of sleep) until lights on. It also includes out-of-bed wake time during the period from sleep onset until lights on. The total amount of stage W (during TRT) = sleep latency + WASO. TABLE 6–1 After Iber C, Ancoli-Israel S, Chesson A, Quan SF for the American Academy of Sleep Medicine: The AASM Manual for the Scoring of Sleep and Associated Events: Rules, Terminology and Technical Specifications, 1st ed. Westchester, IL: American Academy of Sleep Medicine, 2007. Previously, some clinicians used the term “sleep period time (SPT),” defined as the time from sleep onset to the final awakening. WASO was then defined as the duration of wake during the sleep period time (WASOSPT). That is, WASOSPT = SPT − TST, where TST = total sleep time. The AASM scoring manual has standardized the definition of WASO and does not use the SPT as a standard parameter. However, a considerable number of publications3 previously used SPT and WASOSPT (formerly identified as WASO), so the reader should be familiar with this terminology. The AASM scoring manual also recommends presentation of the durations of the sleep stages both as an absolute duration and as a percentage of TST. Some authors previously presented WASOSPT and the sleep stages as a percentage of SPT. Sleep occurs in cycles, each usually composed of a period of non–rapid eye movement (NREM) sleep followed by stage R rapid eye movement (REM) sleep. There are usually three to five NREM/REM cycles per night (Table 6–2). A useful approach for presentation of sleep cycle data is the hypnogram. This is a plot of sleep stage versus time of night (Fig. 6–1). Although the sleep architecture parameters listed previously are useful, they obviously do not provide details about the pattern of sleep over the night. Hypnograms can be very informative, and many sleep centers include a hypnogram in their sleep report. Sleep architecture is a term used to denote the structure of sleep. In young adults, stage N1 usually occupies approximately 5% to 10% of the TST.3–5 It is a transitional state between wake and the other stages of sleep. Stage N2 occupies the greatest proportion of the TST and accounts for approximately 50% to 60% of sleep. Stage N3 occupies approximately 15% to 20% of the TST and stage R approximately 20% of the TST. The amplitude of the slow waves and amount of stage N3 is greatest in the first sleep cycle (see Fig. 6–1). Using spectral analysis, one can compute the delta power (the contribution of slow wave activity to the total electroencephalogram [EEG] activity) (Fig. 6–2). The delta power is highest during the initial cycle of NREM sleep. The episodes of stage R occur about every 90 to 120 minutes, and they are of longer duration as the night progresses. The REM density is the number of eye movements per time. The REM density tends to be the highest in the later REM periods. In fact, the initial REM period of the night is often difficult to score owing to infrequent REMs. The first REM period also may have K complexes or sleep spindles in epochs with both low chin electromyogram (EMG) and REMs. According to the AASM scoring manual, such epochs are scored as stage R1 (see Chapter 3). During the last half of the night, most sleep is composed of stage N2 and stage R with intervening stage W and stage N1. In Figure 6–1, Hypnogram 1 presents a normal hypnogram. Hypnogram 2 shows a hypnogram with a longer sleep latency, a long REM latency, two episodes of stage N3 sleep, and more stage W. Sleep architecture changes as adults grow older (Table 6–3).4–6 In general, sleep becomes lighter and more fragmented. There is an increase in the sleep latency, WASO, and stages N1 and N2.5 One study found an increase in stages N1 and N2 in men only.6 There is a decrease in stage N3 (men only) and a small decrease in stage R. The REM latency decreases with age. Study of sleep architecture in older adults is complicated by inclusion of individuals with medical or mental disorders in some studies of the effect of aging on sleep architecture. Many early studies did not include a sufficient number of women. Ohayon and coworkers5 performed a large meta-analysis of sleep architecture and attempted to specify normal values with and without exclusion of patients with mental diseases that could alter sleep architecture. Redline and colleagues6 have published another analysis of the effect of age on sleep architecture (Sleep Heart Health Study). They studied a large group of patients using standardized recording and scoring techniques (Table 6–4). This study evaluated information from sleep studies of patients 37 years and older and divided the study group into four age quartiles. The sleep studies were performed at home. Van Cauter and associates3 also published findings concerning the age-related changes in slow wave and REM sleep in healthy men. TABLE 6–3 Stages in Sleep Architecture with Aging (20–60 yr) REM = rapid eye movement; TST = total sleep time; WASO = wake after sleep onset. TABLE 6–4 Change in Sleep Architecture with Age (Sleep Heart Health Study)* *Stage as a % of TST in four age quartiles. From Redline S, Kirchner L, Quan SF, et al: The effects of age, sex, ethnicity, and sleep-disordered breathing on sleep architecture. Arch Intern Med 2004;164:406–418. In the meta-analysis by Ohayon and coworkers,5 when studies that included individuals with sleep and mental disorders were excluded, sleep latency increased only minimally from ages 20 to 80 (~10 min) (Fig. 6–3). If patients with mental and medical disorders were included, there was not a significant increase in sleep latency with age. This is consistent with more reports of early morning awakening than sleep onset problems in the healthy elderly. In general, a sleep latency of 30 minutes or more is considered abnormal. In the same meta-analysis, the REM latency decreased with age. TST decreases with age as does the sleep efficiency (TST Ö 100/TRT) (Fig. 6–4). There tends to be a more rapid decrease in TST from childhood to adolescence and then a slower decrease from age 20 to 80 years. Sleep efficiency decreases with age, especially after age 50.5 In the meta-analysis by Ohayon and coworkers,5 WASO and stage N1 (as %TST) increased from age 20 to 60 years (Fig. 6–5). In the analysis of Redline and colleagues,6 the amount of stage N1 increased over the four quartiles for men but not for women (Fig. 6–6).
Sleep Architecture Parameters, Normal Sleep, and Sleep Loss
TRT (min)
Time duration from lights out to lights on.
TRT = SL + WASO + TST
Lights out time (hr : min)
Time of the start of the recording.
Lights on time (hr : min)
Time of the end of the recording.
TST (min)
Time spent in stages N1, N2, N3, and R.
SL (min)
Time from lights out until the start of the first epoch of sleep (stages N1, N2, N3, or R).
Stage R latency (min) (REM latency)
Time from start of first epoch of sleep until the start of the first epoch of stage R.
Sleep efficiency (%)
= TST × 100/TRT.
Stage W (min)
All minutes of stage W during TRT.
WASO
Stage W recorded after sleep onset until lights on time.
= stage W − SL
Time in each sleep stage (min)
Minutes of stages N1, N2, N3, R.
Time in each sleep stage as a % of TST
Minutes of each sleep stage × 100/TST.
Arousal (number)
Total number of arousals.
ArI (#/hr)
Total number of arousals × 60/TST (min).
Normal Sleep in Adults
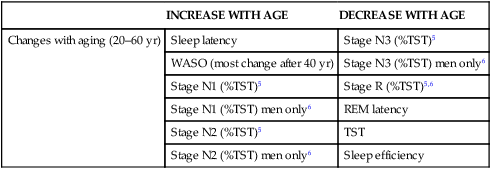
Changes in Sleep Architecture with Aging (Adults)
INCREASE WITH AGE
DECREASE WITH AGE
Changes with aging (20–60 yr)
Sleep latency
Stage N3 (%TST)5
WASO (most change after 40 yr)
Stage N3 (%TST) men only6
Stage N1 (%TST)5
Stage R (%TST)5,6
Stage N1 (%TST) men only6
REM latency
Stage N2 (%TST)5
TST
Stage N2 (%TST) men only6
Sleep efficiency
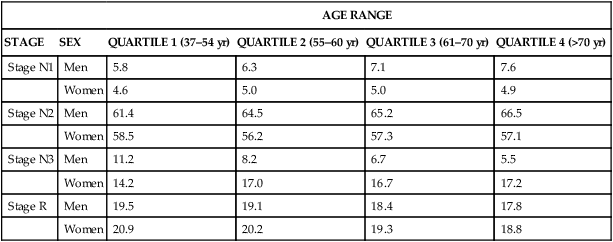
AGE RANGE
STAGE
SEX
QUARTILE 1 (37–54 yr)
QUARTILE 2 (55–60 yr)
QUARTILE 3 (61–70 yr)
QUARTILE 4 (>70 yr)
Stage N1
Men
5.8
6.3
7.1
7.6
Women
4.6
5.0
5.0
4.9
Stage N2
Men
61.4
64.5
65.2
66.5
Women
58.5
56.2
57.3
57.1
Stage N3
Men
11.2
8.2
6.7
5.5
Women
14.2
17.0
16.7
17.2
Stage R
Men
19.5
19.1
18.4
17.8
Women
20.9
20.2
19.3
18.8
Sleep Latency and REM Latency
TST and Sleep Efficiency
WASO and Stage N1 (as a Percentage of TST)
Related posts:
 Obstructive Sleep Apnea Treatment Overview and Medical Treatments
 Biocalibration, Artifacts, and Common Variants of Sleep
 Oral Appliance and Surgical Treatment for Obstructive Sleep Apnea
![]() Monitoring Respiration—Event Definitions and Examples
Monitoring Respiration—Event Definitions and Examples
 Central Sleep Apnea and Hypoventilation Syndromes
 Cardiac Monitoring during Polysomnography
![]()
Stay updated, free articles. Join our Telegram channel

Full access? Get Clinical Tree


Sleep Architecture Parameters, Normal Sleep, and Sleep Loss