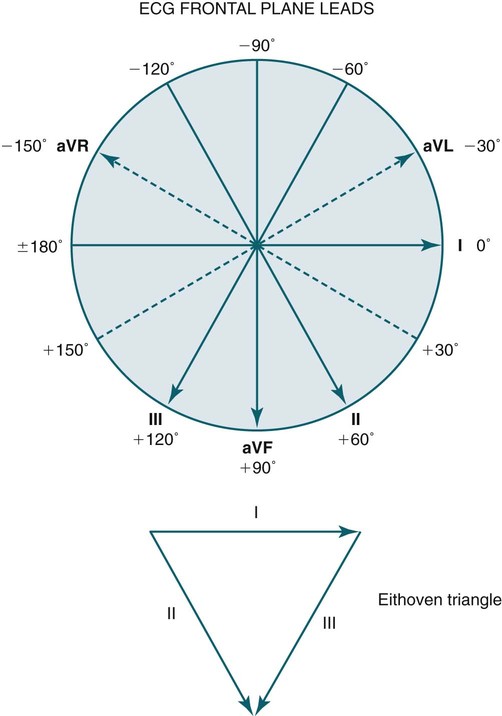
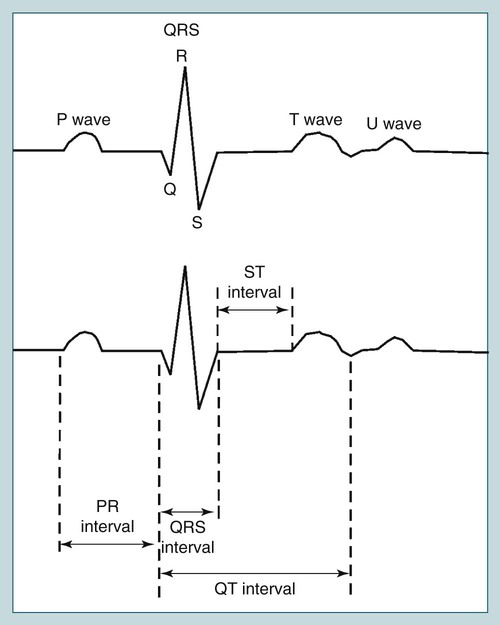
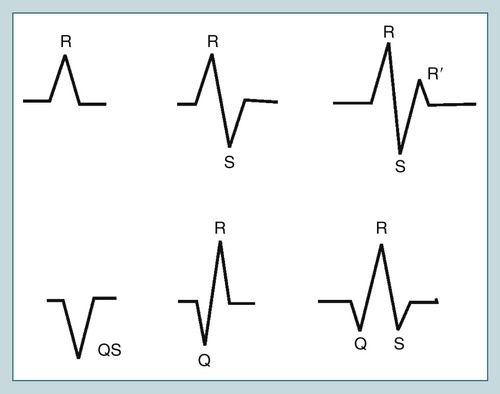
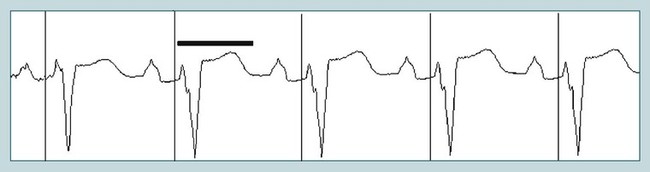
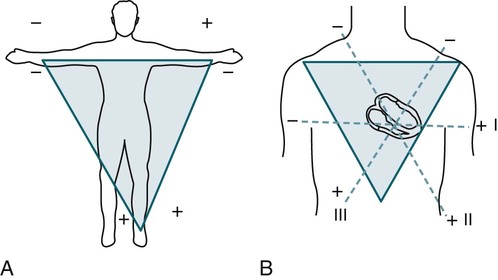
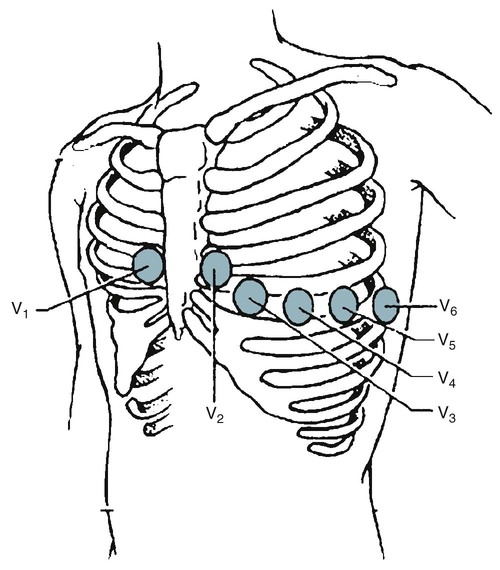
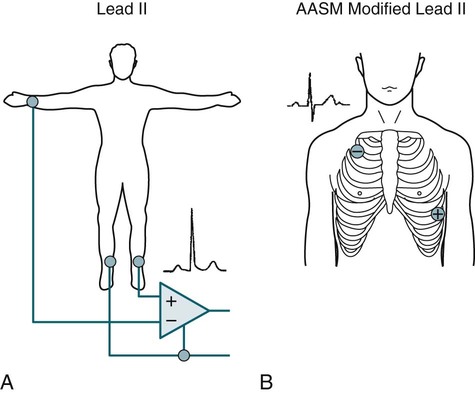
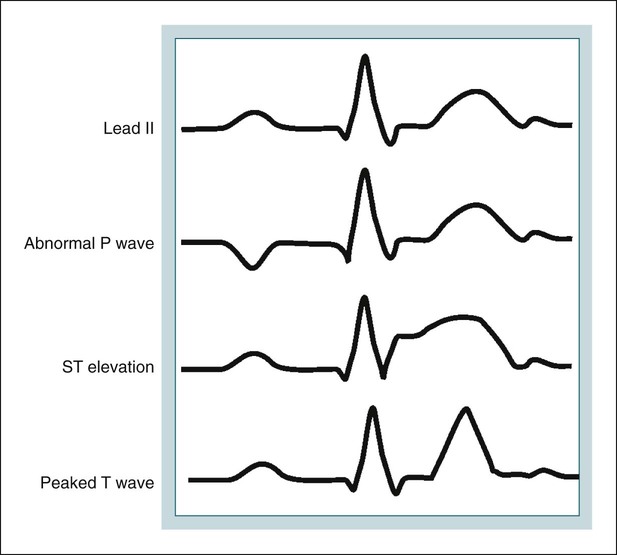
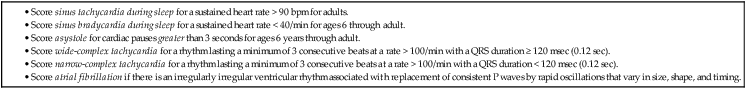
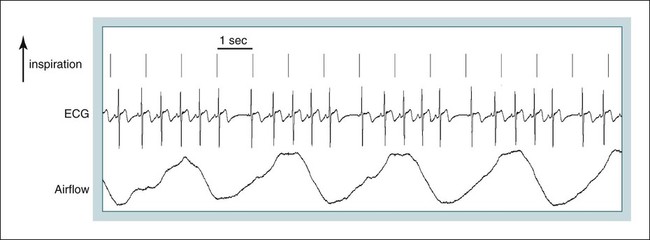
• Score sinus tachycardia during sleep for a sustained heart rate > 90 bpm for adults. • Score sinus bradycardia during sleep for a sustained heart rate < 40/min for ages 6 through adult. • Score asystole for cardiac pauses > 3 seconds for ages 6 through adult. • Score WCT for a rhythm lasting a minimum of 3 consecutive beats at a rate > 100/min with a QRS duration ≥ 120 msec (0.12 sec). • Score NCT for a rhythm lasting a minimum of 3 consecutive beats at a rate > 100/min with a QRS duration < 120 msec (0.12 sec). • Score Afib if there is an irregularly irregular ventricular rhythm associated with replacement of consistent P waves by rapid oscillations that vary in size, shape, and timing. • When the heart rate is ∼ 150, consider aflutter with 2/1 block. • Change to 10-second window to better visualize ECG. • Sustained WCT (>30 sec) should be treated as an emergency and it is likely ventricular tachycardia (especially in patients with known coronary artery disease). Emergency procedures in the sleep center should be activated. • In lead II, the P wave should be upright. • It is essential that the technologist or ordering physician document the presence of a pacemaker. It is also helpful to know whether the patient has known Afib. • A sudden run of wider complex beats < 100 bpm (e.g., 60–70 bpm) is not WCT (by definition > 100 bpm). Among other considerations, determine whether the patient has a pacemaker. Pacemaker spikes may be better visualized with a high filter of 100 Hz with the 60-Hz notch filter off. The purpose of this chapter is to discuss the aspects of electrocardiographic (ECG) monitoring relevant to polysomnography. For a detailed discussion of the ECG and related disorders, the reader is referred to reference 1. The normal ECG recording is composed of several different waveforms. Each waveform represents a different electrical event during the contraction of the heart. The waveforms include the P wave, QRS complex, and T wave (Fig. 11–1). The P wave represents atrial depolarization (right atrium followed by left). The QRS complex represents ventricular depolarization. By convention, if the first deflection is negative, the deflection is called a Q wave. The first positive deflection is called the R wave. The negative deflection following the R wave is called the S wave. If a single negative deflection occurs, it is termed the QS wave. The second positive deflection following an S wave is called the R’ wave (Fig. 11–2). The entire QRS duration should be less than 0.12 second. The T wave represents ventricular repolarization. The U wave is a small wave that follows the T wave. It may be absent or very small and is usually in the same direction as the T wave but approximately 10% of its amplitude. The PR interval is the time from the start of the P wave to the first part of the QRS complex (see Fig. 11–1). The PR interval varies with heart rate (shorter with faster heart rate) but is normally 0.12 to 0.2 second in duration. The time from the start of the QRS until the end of the T wave is the QT interval. The QT shortens with increases in heart rate. The RR interval is the time between successive QRS complexes. The heart rate in beats per minute (bpm) is 60/RR interval (sec). The corrected QT duration (QTc) is based on heart rate and is given by the formula A prolonged QT (Fig. 11–3) can occur with congenital long QT syndromes, medications including antibiotics (erythromycin, clarithyromycin, levofloxacin), antipsychotics (haloperidol, risperidone), tricyclic antidepressants, antiarrhythmic medications (amiodarone, sotalol), and electrolyte abnormalities (hypokalemia, hypomagnesemia). A life-threatening complication of a long QT is the development of polymorphic ventricular tachycardia (torsades de pointes). The standard ECG uses 12 leads. In standard ECG recording, electrodes are placed on the right and left arms (RA, LA) and left leg (LL). A ground is placed on the right leg (RL). Leads I, II, and III are then recorded as (I LA+/RA–, II LL+/RA–, III LL+/LA–) (Fig. 11–4). These leads plus an additional three frontal plane leads (aVF, aVR, aVL) are depicted in Figure 11–5. In the standard ECG, transverse plane electrodes are also recorded (precordial leads). The precordial leads V1 (fourth intercostal space to the right of the sternum), V2 (fourth intercostal space to the left of the sternum), V4 (fifth intercostal space on the midclavicular line), V3 (midpoint on a straight line between V2 and V4), V5 (lateral to V4 and on the anterior axillary line), and V6 (lateral to V5 on the midaxillary line) are depicted in Figure 11–6. Each precordial lead is recorded against linked left arm, left leg, and right arm electrodes, with the right leg as ground. In most sleep centers, a single ECG lead is recorded during sleep monitoring. Monitoring of a single ECG lead is most useful for determining the cardiac rhythm and the heart rate. Determination of the QRS axis requires multiple frontal plane electrodes. In addition, accurate determination of ST changes requires both frontal and precordial electrodes. The QRS duration in a single lead may not reflect the widest value if part of the QRS is isoelectric in that particular lead. Multiple precordial leads are also needed for differentiation of the causes of wide-complex tachycardia (WCT). Some sleep centers record three or more cardiac electrodes. The American Academy of Sleep Medicine (AASM) scoring manual2,3 recommends use of a modified lead II with the negative torso electrode placed parallel with the right leg and below the right shoulder and the positive electrode parallel to the left leg (hip) on the lower left chest rib cage around the sixth to seventh intercostal spaces (Fig. 11–7). The exact intercostal level was not specified in the AASM scoring manual. Because the main purpose is detecting the cardiac rhythm, a precise location is not essential. In the standard and modified lead II, the P wave, R wave, and T wave are upright (Fig. 11–8). Examples of abnormal P wave, ST elevation, and a peaked T wave are also shown in this figure. A digital polysomnography (PSG) recording viewed in a 10-second window corresponds to a traditional ink pen recording at a paper speed of 30 mm/sec. The traditional ECG paper speed used for recording was 25 mm/sec. Therefore, a 10-second PSG window provides a view similar to a standard ECG and is useful to observe the details of the ECG tracing. Most PSG software also has tools allowing measurement of durations and intervals of interest. The AASM scoring manual recommends that the ECG signal be acquired with a sampling rate of 500/sec (a sampling rate of 200/sec is acceptable). The recommended low- and high-frequency filter settings for display of the signal are 0.3 and 70 Hz, respectively. Normal sinus rhythm is associated with an upright P wave, R wave, and T wave in lead II. Each P wave is followed by a QRS complex with a relatively constant PR interval. If there is significant variability in heart rate with respiration, this is often called a sinus arrhythmia (Fig. 11–9). In a sinus arrhythmia, the heart rate increases with inspiration and decreases during expiration. Traditionally, sinus bradycardia is defined as a heart rate less than 60 bpm and tachycardia greater than 100 bpm. However, the heart rate normally decreases during sleep. The lowest heart rate in normal adults is usually during non–rapid eye movement (NREM) sleep when there is an increase in parasympathetic tone and a decrease in sympathetic tone. A review of the evidence that formed the basis for the AASM cardiac scoring rules by Caples and coworkers2 reports unpublished data from the Sleep Heart Health Study cohort of 2067 adult individuals. The individuals in the analysis had an apnea-hypopnea index (AHI) lower than 5/hr and were not taking cardiac or antihypertensive medications. The 95% confidence interval based on mean ± 2 standard deviations (SD) for heart rate during sleep found a minimum normative value of 43 bpm in men and 47.5 bpm in women. The maximum normative values for heart rate were 80.8 bpm for men and 84.7 bpm for women. Based on this information, the new AASM cardiac scoring rules define sinus bradycardia during sleep as a sustained heart rate less than 40 bpm for adults and children 6 years and older (Table 11–1). Here, “sustained” means longer than 30 seconds in duration.4 It should be noted that normal individuals, especially endurance-conditioned athletes, often exhibit heart rates less than 40 bpm during sleep. The AASM cardiac scoring rules also define sinus tachycardia during sleep in adults as a sustained heart rate greater than 90 bpm (see Table 11–1). TABLE 11–1 AASM = American Academy of Sleep Medicine; FAQ = frequently asked question. Adapted from Anonymous: Scoring Manual FAQs. Available at http://www.aasmnet.org/Resources/PDF/FAQScoringManual.pdf From Iber C, Chesson A, Ancoli-Israel S, et al: The Scoring of Sleep and Associated Events: Rules, Terminology and Technical Specifications, 1st ed. Westchester, IL: American Academy of Sleep Medicine, 2007. Defining normal heart rate limits is more complex in children in whom the heart rate is faster than in adults. The heart rate in normal children during wakefulness undergoes a large decrease with age5–7 (Table 11–2). Scant information is available for normative heart rates in children during sleep. As in adults, one would expect a lower heart rate in sleep than during wakefulness. The Cleveland Children’s Sleep and Health Study6 (CCHS) in a group of children aged 8 to 11 years (AHI < 5/hr) reported the mean ± 2 SD heart rate during sleep was 73 ± 10 bpm overall, 70 ± 9 bpm in boys, and 75 ± 9 bpm in girls. These values represented a 20% reduction from waking values. A 95% lower confidence limit of 51 bpm in boys and 57 bpm in girls was found. The corresponding upper limits for boys and girls were 89 bpm and 94 bpm, respectively. A recent study analyzed data from the CCHS study and the Tucson Children’s Assessment of Sleep Apnea (TUCASA) study.7 The study concluded that sleeping heart rates in children are lower than wake and decrease significantly with age. African American ethnicity, female sex, and obesity were associated with faster heart rates. The AASM scoring manual did not provide rules for scoring the heart rate in children because of the age dependence and scant data. TABLE 11–2 Normal Heart Rate during Wakefulness in Children
Cardiac Monitoring during Polysomnography


ECG Recording during Polysomnography
Sinus Rhythm and Normative Data for Heart Rate
AGE
MINIMUM
MAXIMUM
MEAN
2ND–98TH PERCENTILE
NO. OF SUBJECTS
<1 day
88
168
123
93–154
189
1–2 days
57
170
123
91–159
179
3–6 days
87
166
129
91–166
181
1–3 wk
96
188
148
107–182
119
1–2 mo
114
204
149
121–179
112
3–5 mo
101
188
141
106–186
109
6–11 mo
100
176
134
109–169
138
1–2 yr
68
165
119
89–151
191
3–4 yr
68
145
108
73–137
210
5–7 yr
60
139
100
65–133
226
8–11 yr
51
145
91
62–130
233
12–15 yr
51
133
85
60–119
247 Related posts:
 Sleep and Neurologic Disorders
Parasomnias
Sleep and Nonrespiratory Physiology—Impact on Selected Medical Disorders
Sleep Architecture Parameters, Normal Sleep, and Sleep Loss
The Technology of Sleep Monitoring: Differential Amplifiers, Digital Polysomnography, and Filters
Central Sleep Apnea and Hypoventilation Syndromes
Sleep and Neurologic Disorders
Parasomnias
Sleep and Nonrespiratory Physiology—Impact on Selected Medical Disorders
Sleep Architecture Parameters, Normal Sleep, and Sleep Loss
The Technology of Sleep Monitoring: Differential Amplifiers, Digital Polysomnography, and Filters
Central Sleep Apnea and Hypoventilation Syndromes
![]()
Stay updated, free articles. Join our Telegram channel

Full access? Get Clinical Tree


Cardiac Monitoring during Polysomnography