Structural Neuroimaging
Graeme D. Jackson
Ruben I. Kuzniecky
Introduction
The magnetic resonance imaging (MRI) study has become part of the basic assessment of patients with epilepsy and is of equal importance to the electroencephalogram (EEG). The assessment of the problem of seizures requires knowledge of the clinical details and features of the seizures, the functional abnormality in the brain as shown on the EEG, and the structural assessment of the brain with an MRI study optimized for epilepsy.
Several commissions of the International League Against Epilepsy have considered which patients with epilepsy should have an MRI study. It is becoming increasingly clear that a basic MRI study now has a similar status to the EEG as part of the basic assessment of epilepsy (Table 1).
Because there is the option of a surgical excision of the “seizure focus,” which may cure the patient, the detection of a focal abnormality of the brain is important for the formulation of the reason for the seizures and the options available for treatment. Knowledge of the brain abnormalities early in the course of treating the patient greatly helps the management of each individual. Magnetic resonance imaging is indispensable in many areas of neurology. The challenge to epileptologists is that the problem of epilepsy is a special one, which requires optimized protocols dedicated to it. In this chapter, we explain the essential elements of this issue and give a broad overview of what imaging options are available for the investigation of the patient with epilepsy from the perspective of the practicing epileptologist.
MRI studies should fit into the overall assessment of the patient. To understand the basis of the epileptic disorder, we first need to define and understand the epileptic events (clinical and EEG, ictal single photon emission computed tomography [SPECT]), the structural abnormalities in the brain, and the clinical context in which seizures occur.
In this chapter, we first deal with the need to define and understand the structural brain abnormalities by acquiring appropriate epilepsy-focused MRI of high quality and diagnosing the important lesions with high sensitivity and specificity. The clinical context, seizure features, and interpretation of the imaging, with full knowledge of the hypothesized basis of each individual’s epilepsy, are the keys to proper use of imaging. MRI interpretation is different when used in a screening way and when viewed in the context of other investigations. This is particularly important when the patient has partial seizures and may be considered for surgical treatment.
In Epilepsy, “Normal” and “Abnormal” are Diagnoses That Require Certainty: “Suspicious” is Equally Important and Different
It is important to identify suspicious as well as definitely abnormal areas. In the interpretation of the MRI in epilepsy, it is not enough to evaluate the images as “abnormal” or, by default, “normal.” The diagnosis of “normal” should be an active and positive one. If there is any change that is suspicious but not definitely abnormal, the diagnosis of normal is not appropriate. This “in-between” assessment can be very important in deciding how further investigations progress.
Most centers that deal with epilepsy spend a great deal of time in ensuring the quality of their EEG and EEG interpretation. However, unless there is a radiologist with an interest in epilepsy or an epileptologist who spends time with radiologic colleagues, it can be difficult to establish good epilepsy-focused MRI with appropriate sequences, radiography, and interpretation (Table 2).
Technical Issues
An “Epilepsy Protocol” Is Essential
An epilepsy MRI is not just a “routine MRI.” This is because the lesion of hippocampal sclerosis (HS) is hard to diagnose without using a dedicated epilepsy protocol, and it is essential to be confident about this in the basic assessment of the patient with epilepsy.
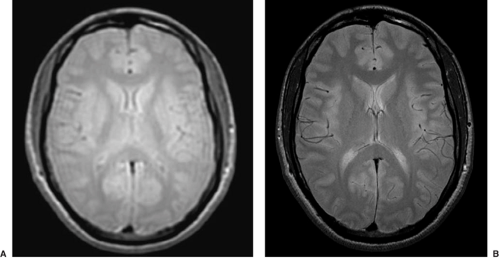
MRI acquisition and interpretation need to be focused on the problem of epilepsy (Table 2). An optimal MR study needs to deal with the issues of partial volume, which can blur the edges of a structure such as the hippocampus, as well as have good spatial resolution, good signal-to-noise ratio, good contrast, and short imaging time. To deal with this issue of partial volume effects, often very thin images are acquired. This can lead to increased noise in the images, which can defeat the purpose of having these thin slices. This interplay between spatial resolution and signal-to-noise ratio is illustrated in Figures 1 and 2. (For a review of the physical principles of imaging see Jackson et al.8 and references therein.)
T1-Weighted Images
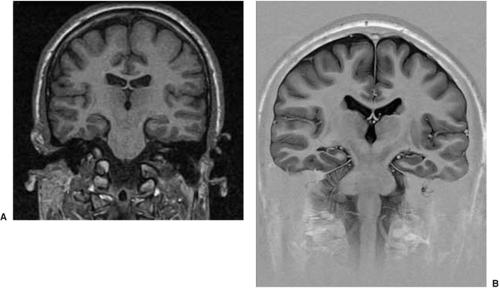
T1-weighted images are usually presented so that cerebrospinal fluid (CSF) is black, gray matter is gray, and white matter is bright. Generally these images are used to assess brain morphology. Different sequences give different types of T1-weighted images. FIGURE 3A shows an inversion-prepared, gradient-echo, echoplanar image. Sequences like this are fast, give good brain coverage, and often allow reasonably thin slices to avoid “partial volume” effects. FIGURE 3B shows a true inversion recovery image. This gives better gray–white matter contrast, improved contrast for gliosis, and also better delineation of the internal features or architecture of the hippocampus. These images take longer and have thicker slices and often incomplete brain coverage, but they can be extremely helpful in difficult cases.
Table 1 The three most important tests in assessing the patient with epilepsy | |
|---|---|
|
T2-Weighted Images
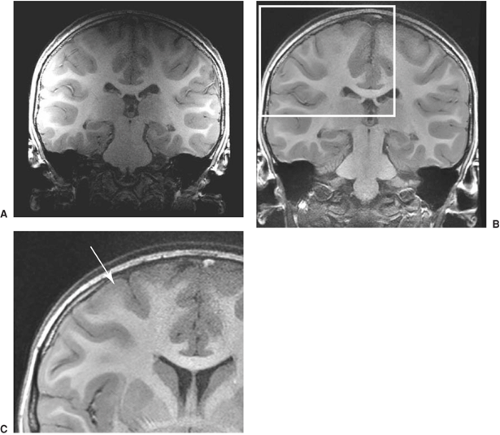
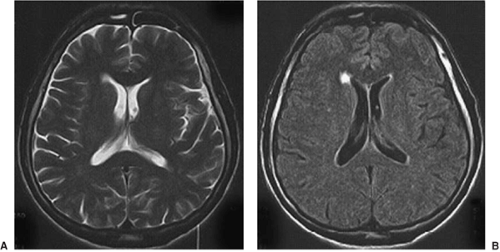
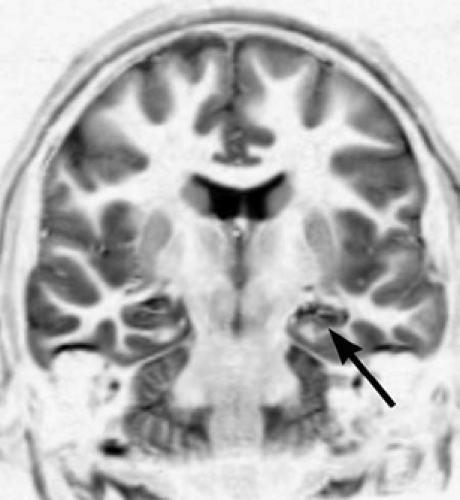
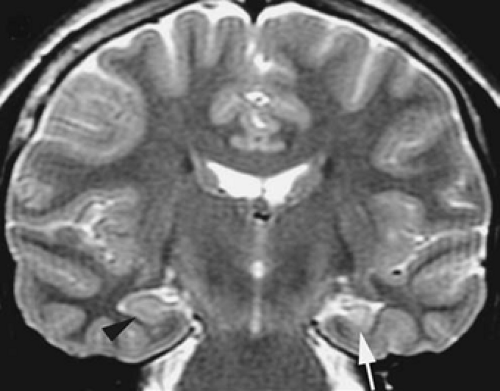
T2-weighted images usually show the CSF as white and the gray matter of higher signal (brighter) than the white matter. These images typically show pathology as areas of increased signal and are used to assess whether the tissue is abnormal (Fig. 4). As with T1-weighted images, there are many choices of sequence that one can use. Fast spin echo is a sequence that allows high-resolution images with good contrast in a short time (Fig. 5).
Fluid-Attenuated Inversion Recovery Images
Table 2 Epilepsy magnetic resonance imaging involves a team | |
|---|---|
|
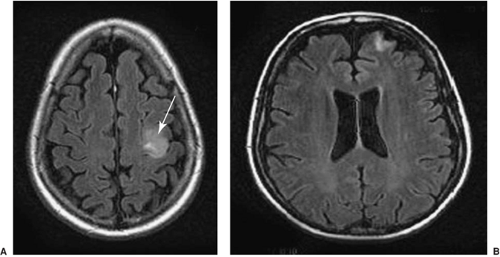
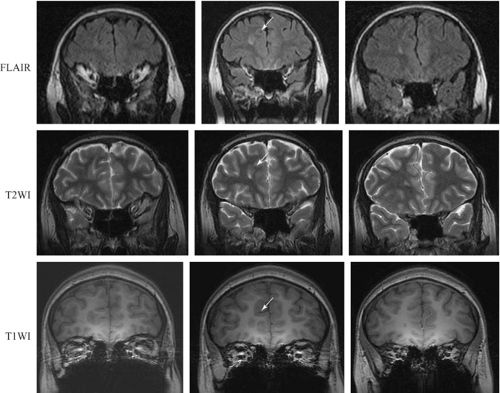
Fluid-attenuated inversion recovery (FLAIR) images can be thought of as T2-weighted images in which the CSF, through clever tricks applied during imaging, has been made to look dark. Pathology still looks high in signal (bright, Fig. 6). It is often much easier to see the pathology in these images, largely because there is no concern that the signal change can be attributed to partial voluming of the CSF and also because it is visually easier to identify. Some lesions that with a practiced eye can be seen on T2-weighted images become obvious on FLAIR images because of this issue of CSF partial voluming (Fig. 7). FLAIR images are not good for looking at morphology and may produce some artifactual signal increases in some areas. In the case of epilepsy, the issue of most concern relates to subtle signal changes in the mesial temporal regions on coronal images, in which these artifacts need to be interpreted with an experienced eye.
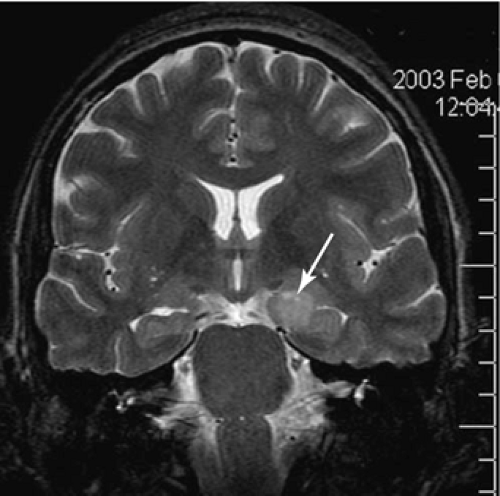 FIGURE 4. This T2-weighted image shows a dysembryoplastic neuroepithelial tumor in the mesial temporal region, involving the amygdala and the hippocampus on the left side (arrow). |
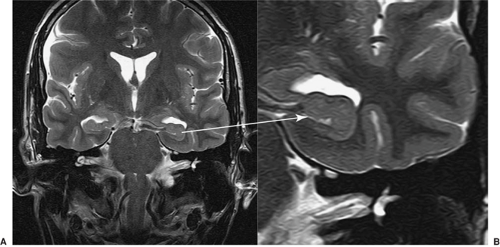 FIGURE 5. Fast spin echo = faster or higher resolution. The internal structure of the hippocampal head can be seen in these fast spin echo images. |
Figure 8 shows the practical importance of this. This patient had severe intractable frontal lobe epilepsy, and the MRI had been reported as normal over a long period of time. A repeat imaging study using these principles revealed a focal cortical dysplasia in the right frontal lobe that led to a clearly defined surgical option. Recognition of these subtle lesions is the fundamental skill toward which the optimization of epilepsy imaging and interpretation is directed.
Radiography
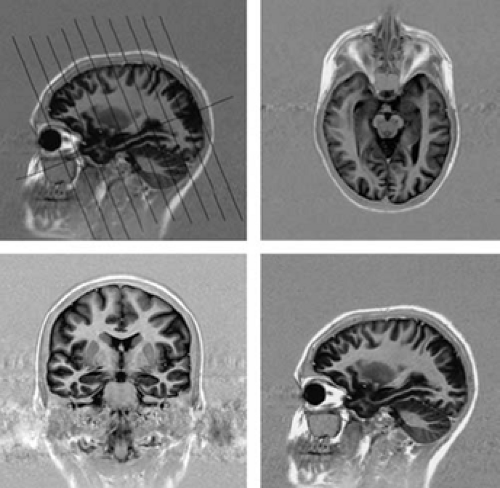
For epilepsy protocol images, the orientation of the imaging plane must be according to “in-brain” landmarks. This means that the radiographer must understand the hippocampal axis and ensure that all imaging is in this plane (Fig. 9). Some centers still acquire images in the “machine axis,” which is in terms of the x, y, and z directions of the bore of the MRI system. Because patients lie in the MR system at different angles, this gives images of inconsistent orientation. This is most important to keep in mind if one is to interpret the pathology of the hippocampus. Because one will need to compare structures on the left and the right, the angulation of the imaging in the coronal plane must also be symmetric, based on in-brain landmarks. In older MRI systems, this angulation caused some problems or was not possible. With new MR systems, this is easily done, but old habits may carry over from previous practice. Images can also be reconstructed in this appropriate axis from three-dimensional (3D) data sets. It is important that the epileptologist review and be satisfied with the quality of the imaging.
Figure 9 shows the basic orientation for an epilepsy protocol.6 The image sequence in this case gives axial and coronal images as shown. This is possibly the most important message of this chapter. Without understanding of the importance of this, the rest does not follow. The whole of the hippocampus is seen in a single slice (top right image), and there is little partial voluming of the hippocampus (lower left image). Because the diagnosis of abnormalities in the mesial temporal region is fundamental to the assessment of any patient with epilepsy, this imaging plane must be part of any effective epilepsy protocol imaging.
Interpretation
Even when imaging is excellent, the correct interpretation of subtle changes needs to be based on a clear understanding of the
features of the abnormality that has been looked for. In the case of epilepsy, the major difficulty that confronts the radiologist, and one with which the epileptologist must also be confident, is the reliable diagnosis of HS and subtle malformations of cortical development (MCDs).
features of the abnormality that has been looked for. In the case of epilepsy, the major difficulty that confronts the radiologist, and one with which the epileptologist must also be confident, is the reliable diagnosis of HS and subtle malformations of cortical development (MCDs).
The features of HS are altered signal in a small hippocampus and loss of the normal internal architecture (Table 3, and Figs. 10 and 11).6 Not all asymmetry is HS, and abnormal signal in a large hippocampus is usually hippocampal dysplasia rather than sclerosis. If one only looks for atrophy or asymmetry, the wrong hippocampus may be diagnosed as abnormal.
Requests
MRI is like the EEG in terms of requirements for basic study, sleep-deprived study, extra electrodes, or video-monitored
study. One can acquire many different bits of information using MRI that give different degrees of assessment of the brain (Table 4). This also involves having the patient potentially in the scanner for a long time. Although basic MRI is needed in nearly all patients, further studies need to be clinically driven and aimed at solving a specific problem. The epileptologist needs clearly to understand what information is needed and what can be obtained. The more focused the question that is asked of the radiologist, the better focused will be the assessment of the images. This is often the weak link in otherwise excellent MR imaging. Effort to focus the request is well rewarded.
study. One can acquire many different bits of information using MRI that give different degrees of assessment of the brain (Table 4). This also involves having the patient potentially in the scanner for a long time. Although basic MRI is needed in nearly all patients, further studies need to be clinically driven and aimed at solving a specific problem. The epileptologist needs clearly to understand what information is needed and what can be obtained. The more focused the question that is asked of the radiologist, the better focused will be the assessment of the images. This is often the weak link in otherwise excellent MR imaging. Effort to focus the request is well rewarded.
There are many levels of information that can be acquired using MRI. In many ways this is similar to the EEG: It is familiar practice to order a routine EEG, a sleep-deprived EEG, or prolonged video monitoring studies. In addition, it is understood that a routine EEG may be associated with activations such as hyperventilation and photic stimulation.
The indication and interpretation of an MR depend on the electroclinical findings and are assessed along with other examinations, such as video-EEG telemetry, positron emission tomography (PET), and SPECT. The correct application and interpretation of MR imaging also depend on knowledge of the brain anatomy (see Kuzniecky and Jackson10 for detailed review and further discussion of these issues).
Typical Imaging Sequences for an Optimized Epilepsy Protocol
A typical clinical scanning protocol for a patient with refractory epilepsy may include T1-weighted imaging, T2-weighted imaging, FLAIR imaging, and 3D volume acquisition sequences. T1-weighted imaging (short repetition time [TR] and echo time [TE]) is commonly used to initially define the brain anatomy. In T2-weighted images (long TR, long TE), many types of brain pathology are discernible. On FLAIR images, the CSF appears dark, which helps to identify lesions with long T2-relaxation times. A high-resolution 3D volume acquisition provides a useful degree of T1-weighted contrast between gray and white matter and helps greatly in the identification of subtle abnormalities, such as those associated with malformations of cortical development. The 3D data are made up of contiguous slices and allow characterization of the spatial extent of anatomic structures. Common 3D acquisition sequences include magnetization-prepared rapid acquisition gradient echo (MPRAGE) and 3D fast spoiled GRASS (3D-SPGR) imaging, where GRASS stands for gradient recalled echo acquisition at steady state. These sequences use a combination of short TR and TE to improve the time efficiency of the acquisition.
Table 3 Magnetic resonance imaging features of hippocampal sclerosis | |
|---|---|
|
Based on multiple acquisitions with a variety of these pulse sequences acquired in optimized imaging planes, it is possible to detect low-grade tumors, vascular malformations, infarction, inflammation, or trauma as sources of seizures. The application of contrast agents is indicated if there is suspicion of a primary or metastatic tumor, infection, or inflammatory lesion.
One should think good “epilepsy MRI” not “MRI.” To achieve this, knowledge of MRI is needed not only by the radiologist, but also by the neurologist and epileptologist. It is this continuing interaction that enables optimized imaging to be obtained (Table 5).
Table 4 Types of magnetic resonance imaging studies and information acquired | ||||||||||||||||||
|---|---|---|---|---|---|---|---|---|---|---|---|---|---|---|---|---|---|---|
|
Table 5 Dedicated imaging protocol for epilepsy | ||
|---|---|---|
|
Quantification of Volumes and T2 Relaxometry in Epilepsy
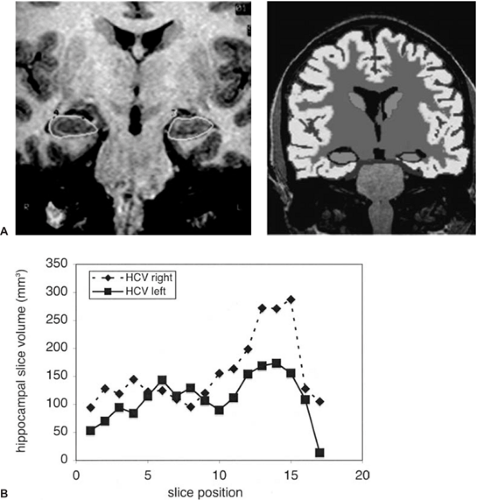
High-resolution T1-weighted 3D volume sequences can be used quantitatively to measure the volume of any particular regions of interest. In the case of epilepsy this is usually the hippocampus.7 Volumetric measurements require a significant investment in learning the hippocampal boundaries and depend on a large number of variables that need to be understood and controlled for in image analysis and acquisition. Volumetric assessment can be done manually or with half- or fully-automated software (Fig. 12), and increasingly advanced methods of anatomic analysis are being developed and
implemented. Longitudinal studies are possible, and this makes it possible to assess the progression of volumetric changes and may begin to help unravel the effects of the primary disease from the secondary effects of seizures.
implemented. Longitudinal studies are possible, and this makes it possible to assess the progression of volumetric changes and may begin to help unravel the effects of the primary disease from the secondary effects of seizures.
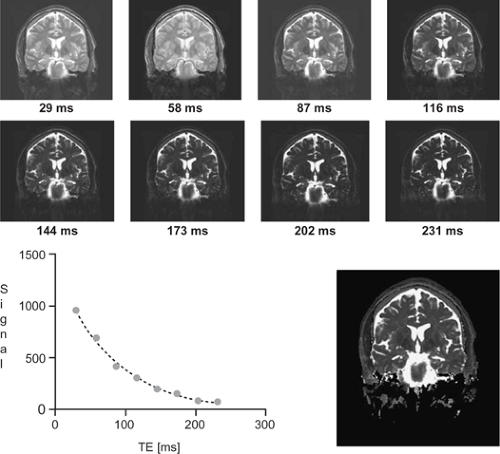
T2 relaxometry is the quantitative determination of the T2 relaxation time. To achieve this, several T2-weighted images are acquired at different echo times, and in each voxel the resultant values are fit with an exponential decay curve to estimate the T2 decay rate of the imaged tissue. T2 relaxometry has been established as a reliable tool that is stable over time. In contrast to elaborate volumetric assessment, the T2 relaxometry is a quick technique with small variance and can be implemented in large-scale studies (Fig. 13).7
In epilepsy patients with HS, signal increase on T2-weighted images is typically observed in the hippocampus. The measured values of the hippocampal volume and the T2 time are correlated with each other, indicating that a marked volume loss is associated with a significant increase in T2 relaxation, reflecting the complex pathology that is HS.
Diffusion-Weighted Imaging
A diffusion-weighted signal reflects the molecular motion of water in the extra- and intracellular environments. The extent of this motion depends on the microscopic environment, and is therefore tissue dependent. In tissues with a linear arrangement of myelinated fibers, such as white matter tracts, the molecular motion is restricted to the axis along the white matter tracts. This is known as anisotropic diffusion. In other tissue components, such as CSF, molecular motion is not restricted in any direction, and this is known as isotropic diffusion. Diffusion-weighted MR techniques are frequently used to assess early signs of cerebral ischemia. Diffusion changes similar to those observed in ischemia may also be present in tumors or infection. Diffusion imaging requires postprocessing, which allows the measurement of summary parameters such as diffusivity and fractional anisotropy. It is also possible to visualize the path of the white matter tracts using tractography techniques. This is a computationally intensive technique and is in the process of being refined.5
Advanced Analysis Techniques
There are a number of methods for analysis of images. Voxel-based methods such as voxel-based morphometry (VBM), voxel-based relaxometry (VBR), and voxel-based diffusivity (VBD) can use statistical methods to demonstrate the areas of the brain that differ from control values. This approach is particularly powerful when examining the effects between groups (such as patients with temporal lobe epilepsy [TLE] and controls) (Fig. 14).2
Major Findings on Magnetic Resonance Imaging
The major findings on MRI can be thought of in a fairly simple way as being the obvious lesions, HS, malformations of cortical development, or, at least after the initial epilepsy protocol imaging, normal (Table 6).
Obvious Lesions
In several series, detailed analysis of MRI images has revealed a high percentage of abnormalities that can be detected in the brains of patients with intractable partial epilepsy (see Kuzniecky and Jackson10 for review and more details).
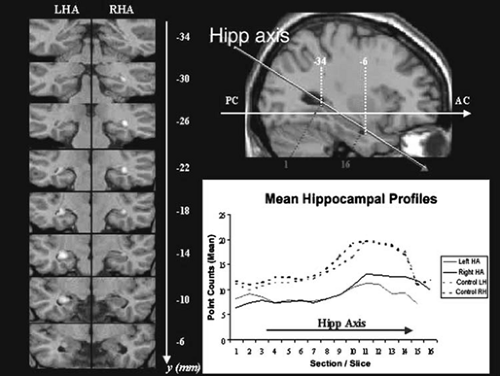 FIGURE 14. Quantitative measurement of the hippocampus. The volume can be measured in the cross-sectional coronal images obtained in the hippocampal axis. This can be extracted to give a shape analysis. The left panel shows this data in a statistical way by using voxel-based morphometry to show how the patient groups differ from a control group. LHA, left hippocampal axis; RHA, right hippocampal axis. (Figure courtesy of Gaby Pell, Brain Research Institute, Australia.)
Stay updated, free articles. Join our Telegram channel
Full access? Get Clinical Tree
 Get Clinical Tree app for offline access

|
