Fig. 10.1
(a) Anoxic Depolarization injury in necortex. Light transmittance (LT) imaging reveals damage following AD in higher, but not lower, brain regions. (a1) The front of LT change representing AD onset arises and propagates as a distinct ‘wave’, coursing through neocortical gray matter (arrows) and leaving damage (light scatter, magenta) in its wake. The white square delineates a region of interest (ROI) of ~30 × 30 pixels. (a2) Light transmittance change in the ROI is plotted over time in response to OGD (red trace). A similar response is evoked by the Na+/K+ pump inhibitor ouabain (100 μM) in another neocortical slice. (b) AD injures in cerebellar cortex but not brainstem. In a slice containing cerebellum (Cbell) and midbrain-pons, AD begins propagating through cerebellar gray after ~3 min of OGD. By 4:30 AD ‘mini-fronts’ start spreading through each tegmental nucleus (TN) in the pons. By 26 min AD propagation has injured cerebellar gray, but not TN or adjacent brainstem regions. The inferior colliculi (InfCo) display some superficial swelling and then damage. (c) Regional peak gray matter changes in LT evoked by OGD. (c) AD generation is stronger and more damaging in rostral brain regions compared to brainstem. (c1) Comparison of regional responses to OGD in terms of AD strength (peak LT increases) and subsequent dendritic injury (maximal LT decreases) shows more swelling and subsequent injury in higher brain regions compared to brainstem nuclei. The exception is superior colliculus (SupCo) which displays injury similar to higher gray matter, possibly because it has been a prominent surface structure throughout vertebrate evolution until recently. (c2) The means of peak LT values displayed by higher and lower regions (excluding SupCo) were collapsed and compared with an independent samples t-test and found to be significantly different [t(58) = 3.6, p < 0.001]
In OGD slices containing brainstem, the adjacent hippocampus or cerebellar cortex (Fig. 10.1b) supports a spreading LT front with subsequent damage. At the same time the brainstem nuclei may display OGD-induced ‘mini-fronts’ of AD coursing through the periaqueductal gray, superior colliculus (not shown) and tegmental nucleus (Fig. 10.1b, c). However these lower brain regions display little subsequent light scatter with the exception of superior colliculus (Fig. 10.1c). LT values from the three higher brain areas (neocortex, hippocampus and cerebellar cortex) and three lower brain areas (PAG, IC and TG) were collapsed and the means plotted in Fig. 10.1c2. These means were compared with an independent samples t-test and found to be significantly different [t(138.9) = 5.78, p < 0.001]. Similarly the three higher regions showed significantly more LT reduction than the three lower regions (not shown).
These observations which indicated less AD-evoked damage in the brainstem post-OGD were followed up by using whole-cell patch recording of neurons during OGD to compare responses of higher gray matter with lower brain nuclei. The electrophysiological properties of each recorded neuron as well as the properties of lower neurons recorded in post-OGD slices can be found at http://hdl.handle.net/1974/7578 [45]. General findings are presented below.
10.4 Higher Neuron Electrophysiology
10.4.1 Neocortical Pyramidal Cells
Twenty pyramidal neurons (PyNs) were monitored by whole-cell patch recording during simulated stroke (Fig. 10.2a, top trace). The patch pipette was visually placed within layer V and the targeted PyNs identified based on the cell’s triangular shape and diameter of 15–20 μm. The resting membrane potential of the 20 cells averaged −82 ± 2.5 mV. Mean input resistance and action potential amplitude were 82 ± 31 MΩ and 79 ± 6.6 mV, respectively (Table 10.1) as typically reported for PyNs in other studies.
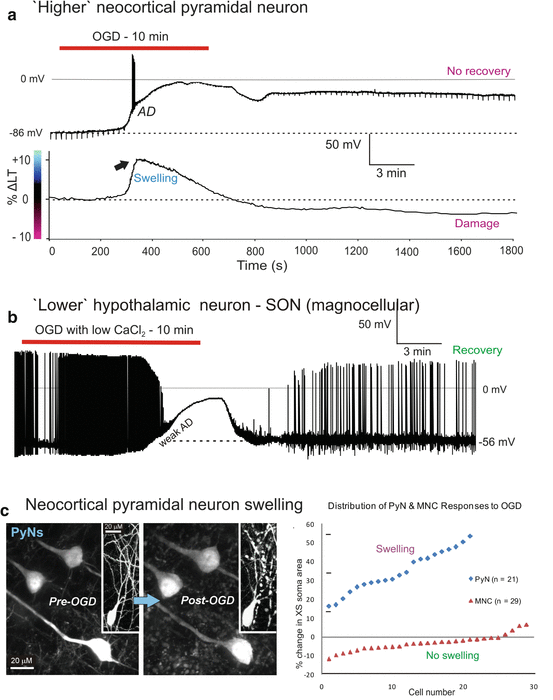
Fig. 10.2
(a) ‘Higher’ neocortical pyramidal neuron. (b) ‘Lower’ hypothalamic neuron – SON (magnocellular). (c) Neocortical pyramidal neuron swelling. (a) Pyramidal neurons do not recover following OGD. Top trace: Whole-cell PyN recording during 10 min of OGD. Downward deflections represent voltage response to 70 pA hyperpolarizing current pulses elicited every 20 s to monitor whole-cell input resistance. Post-AD this value remains near zero megaohms, confirming injury. Bottom trace: Simultaneous imaging of the cortical field in layer V. Light transmittance change (ΔLT) is plotted over time in a100 μm × 50 μm ROI which includes the PyN recorded above. A 9 % LT increase (arrow) corresponds with the fast component of the AD, as the AD wave front reaches the recording pipette tip at ~320 sFig.10.2 (continued) (b) Identical OGD (left) as shown in A but by a hypothalamic neuron in the supraoptic nucleus. This magnocellular neuroendocrine cell typically shows a weak AD with spike inactivation. The cell repolarizes with spike reactivation, signaling recovery. (c) Two-photon laser scanning microscopy reveals that PyNs are injured after AD. PyN cell bodies and proximal dendrites in cortical layer V dramatically swell as observed 20 min after OGD in the green fluorescent protein (GFP) mouse. The distribution graph (right) shows single PyN and MNC responses to OGD. PyNs swell by an average of 34.5 ± 11.0 % in response to 10-min OGD. MNCs shrink slightly by an average of 3.4 ± 4.2 % in response to 15-min OGD. XS area, cross-sectional area
Table 10.1
Summary of whole-cell recording data for higher and lower projection neurons in response to OGD
Neuron type | Cell no. | Rmp (mV) | Recovered cell no. Post-OGD | Rmp Recov (%) | Max Depol. (mV) (%) | AP Ampl Recov (%) | Rin Recov | AD Onset (s) | AD Rate (mV/s) | Ref. |
|---|---|---|---|---|---|---|---|---|---|---|
Higher gray | ||||||||||
Neocortical PyN | 20 | −82 ± 2.5 | 0 | 27 | 0 | 0 | 57 | 246 | 1.6 | [29] |
CA1 PyN | 9 | −63 ± 2.5 | 0 | 10 | 0 | 0 | – | 343 | 3.0 | [34] |
Striatum | 10 | −70 ± 3.0 | 0 | 29 | 0 | 0 | 64 | 287 | 3.0 | [34] |
Thalamus (AMV) | 12 | −70 ± 3.5 | 0 | – | −4 | 0 | – | 217 | 2.0 | [27] |
(midline) | 7 | −69 ± 2.9 | 0 | – | −9 | 0 | – | 243 | – | [27] |
Hypothalamus | ||||||||||
MNC (SON) | 21 | −65 ± 2.9 | 11 | 87 | −19 | 82 | 84 | 484 | 0.2 | [29] |
MNC (PVN) | 8 | −51 ± 3.9 | 7 | 84 | −9 | 82 | 89 | 298 | – | [27] |
Parvo (PVN) | 12 | −49 ± 4.2 | 11 | 78 | −6 | 95 | 92 | 298 | – | [27] |
SCN | 18 | −45 ± 4.1 | 15 | 81 | −19 | 65 | 100 | 431 | – | [27] |
Brainstem | ||||||||||
Mesenceph. Nuc | 14 | −53 ± 2.3 | 7 | 93 | −42 | 95 | 86 | 301 | <0.5 | [34] |
Locus Ceruleus | 8 | −48 ± 2.8 | 5 | 82 | −4 | 83 | 100 | 301 | <0.5 | [34] |
Nuc Solitarius | 31 | −48 ± 4.5 | 12 | 75 | −10 | 73 | 57 | 322 | 0.3 | [34] |
Dorsal Motor Nuc | 12 | −46 ± 1.4 | 10 | 98 | −1 | 73 | 95 | 322 | 0.3 | [34] |
Exposing PyNs to 10 min of OGD (n = 20) elicited an abrupt anoxic depolarization (AD) with a mean slope of 94.1 ± 40.1 mV/min and a mean onset time of 4.1 ± 0.8 min; (Fig. 10.2a top trace; Table 10.1). The maximal average membrane depolarization during AD was to 0 ± 2.3 mV. Upon return to control aCSF this slowly returned to a mean of 27 % of the original membrane potential. Following a single 10 min OGD exposure, subsequent intracellular recordings from the same neocortical slice could no longer be obtained, even up to 3 h after return of oxygen and glucose. Importantly it was no longer possible to record evoked field potentials from layers II-III or V post-OGD upon stimulation of layer VI (not shown) so the entire neocortex was electrically silent.
Light transmittance (LT) imaging of the pyramidal cell field during whole-cell recording demonstrated a sudden increase in ΔLT corresponding with AD onset in the single cell (Fig. 10.2a, lower trace). PyNs slowly depolarized during initial OGD, followed by the fast component of the AD. An immediate 8 % increase in ∆LT coincided with the propagating AD wave front, which in this case reached the recorded PyN at ~ 320 s of OGD, coinciding with the fast AD component (Fig. 10.2a, lower trace, arrow). Upon reintroduction of aCSF, membrane potential returned to only 32 % of its original value after 20 min. Action potentials could not be evoked post-OGD because of this maintained depolarization where Na+ channels were inactivated. There was no subsequent recovery.
10.4.2 Hippocampal CA1 Neurons
The patch pipette was visually placed within layer CA1 and pyramidal somata targeted based on the triangular shape and diameter of 15–20 μm. The average resting membrane potential was −63 ± 2.5 mV (Table 10.1). Mean action potential amplitude and input resistance were 84 ± 13.4 mV and 99 ± 18 MΩ, respectively. Nine CA1 pyramidal neurons were monitored by whole-cell patch during simulated stroke. Ten minutes of OGD elicited an abrupt AD in CA1 neurons that reached zero millivolts in all cells tested (Fig. 10.3a1). Mean AD onset time was 343 ± 85 s. Seven cells responded to OGD with an initial hyperpolarization (H, Fig. 10.3a1). Following 20 min recovery in control aCSF the mean membrane potential was only −20 ± 7.4 mV, representing a mere 10 % recovery (Table 10.1). Whole-cell input resistance was too low to accurately measure post-OGD. No new recordings could be acquired in the CA1 stratum pyramidale post-OGD as the neurons were all permanently depolarized. The response to OGD by the nine cells was indistinguishable from 17 other CA1 neurons in our previous study [46] so we did not expand the pool further.
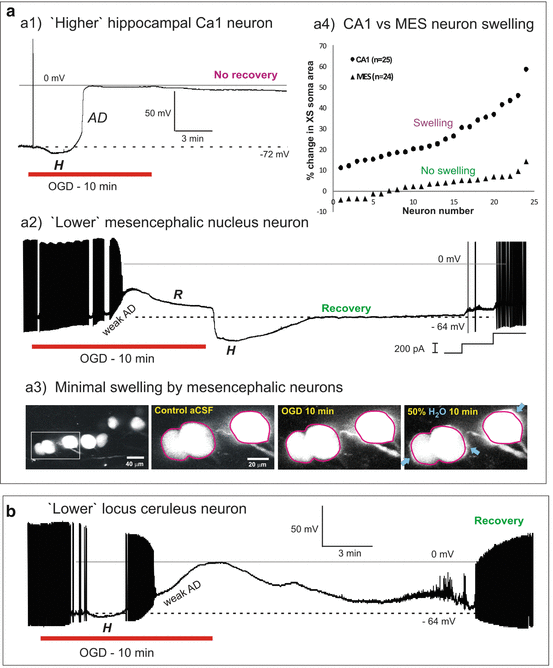
Fig. 10.4
(a) ‘Higher’ thalamic neuron. A thalamic neuron held hyperpolarized by 10 mV (left) characteristically fires a brief burst when step depolarized. At a more positive resting potential, the same neuron fires tonically (not shown). During 10 min of OGD (right), a thalamic neuron undergoes rapid AD to near-zero millivolts. Following return to control aCSF the cell could not repolarize. This is typical for higher neurons following 10 min of OGD in slices at 34–36 °C. (b) ‘Lower’ hypothalamic nerurons – PVN. (b1). Magnocellular. (b1) MNCs display a characteristic delay in firing (square) when depolarized from negative resting potentials and a delay in return to baseline (arrow) in response to a hyperpolarizing current step. During 10 min of OGD (right), an MNC gradually depolarizes before reaching a plateau as action potentials inactivate. Following return to control aCSF, the MNC rapidly repolarizes with some action potential firing. (b2) A non-bursting parvocellular neuron with characteristic post-inhibitory rebound spike (arrow). The neuron responds to 10 min of OGD by gradually depolarizing before reaching a plateau as action potentials inactivate. The neuron resists further depolarization before slowly approaching zero millivolts. Following return to control aCSF, the neuron repolarizes to near-baseline
10.4.3 Thalamic Neurons
Eleven neurons in anteromedial ventral (AMV) nucleus were monitored by whole-cell current clamp during simulated stroke (Fig. 10.4a; Table 10.1). The patch pipette was visually placed within AMV and the cells targeted based on their elongated shape and length of 20–30 μm. When steadily hyperpolarized below −65 mV, a depolarizing current step evoked a low threshold potential driving a burst of action potentials (Fig. 10.4a, left), typical of thalamic neurons. The mean resting potential of the 11 AMV cells was −70 ± 3.2 mV. Mean input resistance and action potential amplitude were 81 ± 20 MΩ and 78 ± 5.9 mV, respectively. Exposing these 11 neurons to OGD elicited an abrupt anoxic depolarization (AD) with a mean onset time of 217 ± 26 s (Fig. 10.4a, right). The average maximal depolarization reached during AD, was −4 ± 2.5 mV. Average resting membrane potential following OGD could not be determined, as none of the whole-cell recordings from the AMV nucleus could be maintained.
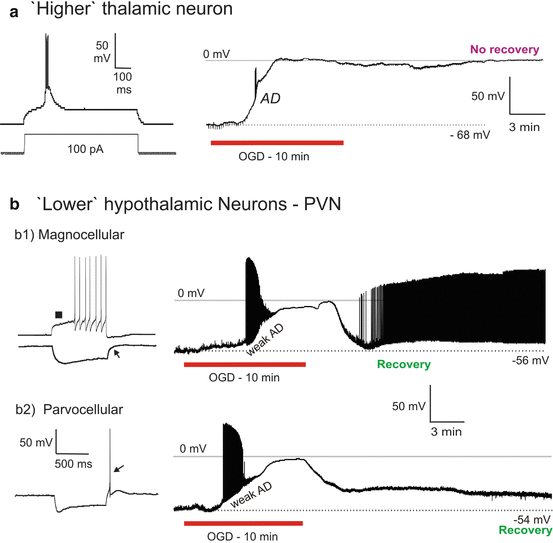
Fig. 10.3
(a1) ‘Higher’ hippocampal CA1 pyramidal neurons undergo terminal AD induced by OGD (as do hippocampal CA3 neurons [76] and granule cells [46]. In response to 10 min of OGD, the CA1 neuron initially hyperpolarizes before undergoing rapid AD to near-zero millivolts from where it does not recover. (a2) ‘Lower’ mesencephalic nucleus neuron. MES neurons resist depolarization and swelling in response to OGD. Whole-cell recording of MES neuron. The spontaneously firing neuron slowly depolarizes and inactivates in response to 10 min of OGD. Surprisingly, the cell then repolarizes during OGD (R). With return of control aCSF, the neuron displays a hyperpolarizing undershoot (H), before regaining its original membrane potential. At the end of the recording, steps of depolarizing current demonstrate the neuron’s ability to discharge. (a3) Minimal swelling by mesencephalic neurons. Volume responses to OGD by YFP-positive MES neurons monitored in real time with 2-photon microscopy. Cell bodies in the MES nucleus resist swelling after 10 min of OGD. In contrast, post-OGD dilution of the aCSF by 50 % with distilled water does evoke swelling (blue arrows). (a4) CA1 vs MES neuron swelling. Change in cross-sectional (XS) area of the cell body is measured to determine soma Fig.10.3 (continued) swelling or shrinking in real time. Swelling by CA1 neurons is pronounced compared to the small range displayed by ‘lower’ MES neurons in response to 10 min OGD. Results here are similar to Fig. 10.2 comparing neocortical pyramidal neurons and ‘lower’ hypothalamic magnocellular endocrine neurons. (b) ‘Lower’ locus cerules neuron. LC neurons resist depolarization in response to OGD. Initially, the neuron briefly hyperpolarizes (H) as action potentials inactivate before reaching a plateau. It then continues to near-zero millivolts. Upon return to control aCSF, the LC neuron slowly repolarizes
To show that the AMV neurons were typical thalamic cells, additional recordings were made in other thalamic nuclei (n = 8). Each of these neurons showed abrupt AD in response to OGD (Table 10.1) as described above. And as in other higher regions, even after an hour of normal aCSF exposure post-AD it was impossible to obtain new recordings from the electrically silent thalamus.
10.4.4 Striatal Neurons
The patch pipette was visually placed within the striatum and cells targeted based on their diameter of 10–15 μm. Spiny projection neurons fire tonically in response to a depolarizing stimulus, typical of striatal projection neurons [13] (not shown). The average resting membrane potential of the 10 cells was −70 ± 3.0 mV. Input resistance and action potential amplitude were 55 ± 18 MΩ and 81 ± 9.1 mV, respectively, as reported in other studies [47].
Ten striatal neurons were monitored during 10 min of OGD which evoked an abrupt AD to near-zero millivolts (Fig. 10.5a, left). Mean AD onset was 287 ± 23 s. Upon reintroduction of control aCSF, neurons repolarized to −20 ± 16.9 mV, representing only a 29 % recovery with further deterioration following. Cell input resistance did not recover. As with other higher neurons described above, no action potentials could be evoked post-OGD. As well, no newly acquired recordings could be obtained in striatum, further indicating regional injury.
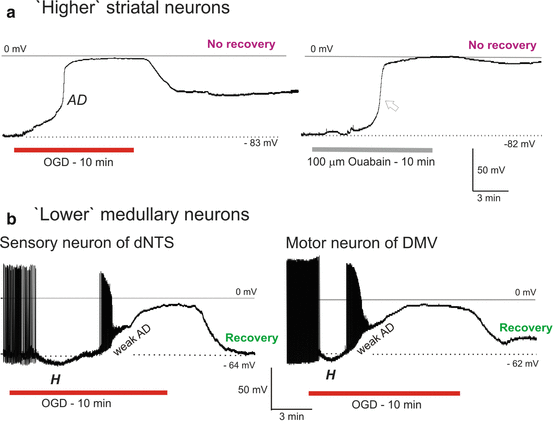
Fig. 10.5
(a) In response to OGD (left) a striatal neuron slowly depolarizes before undergoing rapid AD to near-zero millivolts. Upon return to control aCSF, the neuron begins to repolarize, but does not recover. In response to the Na+/K+ pump blocker ouabain (right), the response is similar to OGD. (b) Upon exposure to OGD, a sensory neuron and a motor neuron in medulla oblongata initially hyperpolarize (H) and then gradually depolarize with eventual spike inactivation, reaching a plateau that is maintained throughout OGD. Upon return of control aCSF each neuron repolarizes to near resting potential
Exposing 4 striatal neurons to 100 μM ouabain for 10 min elicited an abrupt AD-like response (arrow, Fig. 10.5a, right) that approached zero millivolts. As with OGD, striatal neurons fired no action potentials during the depolarization phase and no substantial recovery occurred. In fact although not detailed in this article, ouabain exposure mimicked the OGD response in every neuronal type tested [29, 33, 34]. This emphasizes the central importance of Na + /K + pump failure in the ischemic response by neurons of every region in the CNS.
10.5 Lower Neuron Electrophysiology
Our definition of the ‘lower’ brain is the hypothalamus and brainstem. As described in this chapter and detailed in [33], the thalamus-hypothalamus interface represents a distinct border where more caudal neurons take on an elevated resistance to OGD (shown below) compared to the neurons just described.
10.5.1 Hypothalamic Neurons
Whole-cell data from thalamic (n = 19) and hypothalamic neurons (n = 38) in response to 10 min OGD are summarized in Table 10.1. As noted above, post-OGD thalamic membrane potentials were near-zero. In sharp contrast, hypothalamic neurons located only a millimeter or less away responded to identical OGD by only slowly depolarizing and usually recovering when back in control aCSF. This was true whether the neurons were recorded in SON (Fig. 10.2b), PVN (Fig. 10.4b) or SCN [33]. As well, there was no immediate spike inactivation as seen in higher neurons. As with all lower brain neurons described below, resistance to OGD-induced depolarization was seen despite a more positive resting membrane potentials pre-OGD (Table 10.1).
Figure 10.2b demonstrates that MNCs are not in some way protected from irreversible depolarization by inhibitory synaptic input. Superfusion of OGD aCSF with calcium chloride reduced from 1.8 to 0.45 mM blocks any residual synaptic input not removed by OGD itself. Yet the depolarization remains intact, indicating that the response is intrinsic to the recorded neuron.
10.5.2 Midbrain/Pontine Neurons
Neurons in Locus Ceruleus (LC)
Eight neurons from the LC were whole-cell patched. The pipette was visually placed within the LC and the cells targeted based on their elongated shape and diameter of 20 μm. LC neurons were further identified by their electrophysiological properties [34]. Ten minutes of OGD only gradually depolarized LC neurons, reaching −28 ± 3.5 mV (Fig. 10.3b). Spike inactivation also developed slowly. After this plateau, LC neurons resisted further depolarization for an average duration of 57 ± 21 s, before further depolarizing to −4 ± 4.6 mV. The average membrane potential of 6 LC neurons that were held following 10 min of OGD was −40 ± 10.1 mV, representing 87 % recovery (Table 10.1). The action potential amplitude recovered by 83 %.
Neurons in Trigeminal Mesencephalic (MES) Nucleus
A patch pipette was visually placed within MES nucleus and the cells targeted based on their large diameter of 25–50 μm and their round or ellipsoid shape [48]. MES neurons were further identified by their electrophysiological properties [34]. Exposing 14 MES neurons to 10 min of OGD elicited only slight depolarization. The majority were silent but some initially fired spontaneously prior to OGD (Fig. 10.3a2). Of note, all MES neurons actively repolarized during OGD (R, Fig. 10.3a2). Upon return to control aCSF, MES neurons often displayed a hyperpolarizing undershoot (H, Fig. 10.3a2) before returning to baseline levels. The average resting membrane potential of 12 MES neurons that could be held following 10 min of OGD displayed a 93 % recovery (Table 10.1). Input resistance recovered by 86 % and action potential amplitude 95 %. Moreover healthy MES neurons (n = 7) could be readily patched in slices previously exposed to 10 min of OGD. Their average resting membrane potential represented a 99 % recovery compared to MES neurons not previously exposed to OGD. Input resistance recovered by 100 % and action potential recovered by 97 %. Some MES neurons were subjected to additional 10 min OGD exposures with near-complete recovery [34]. Exposing three MES neurons to 100 μM ouabain for 10 min caused a gradual depolarization, similar to OGD and gradual recovery [34]. As with OGD, the recorded neuron resisted further depolarization during ouabain exposure, reaching a maximal depolarization of −39 mV before gradually recovering in aCSF.
10.5.3 Medullary Neurons
Neurons in Dorsal Nucleus Tractus Solitarius (dNTS)
The pattern of a slow AD induced by OGD followed by recovery continued in the brainstem. Thirty-one sensory neurons from dNTS of the medulla oblongata were whole-cell patched during simulated stroke. The patch pipette was visually placed within the dNTS and the cells targeted based on their diameter of 15–20 μm. They were further categorized based on established electrophysiological properties [34]. Exposing dNTS neurons to 10 min (n = 15) or 15 min (n = 16) of OGD, elicited a gradual depolarization (n = 7, Fig. 10.5b) often preceded a brief initial hyperpolarization (n = 24, Fig. 10.5b) as in LC neurons (Fig. 10.3b). The membrane potential of 17 dNTS neurons that were still held on to following 10 or 15 min of OGD displayed a 75 % recovery. Input resistance and action potential amplitude displayed a 57 % and 73 % recovery, respectively. Healthy neurons from the dNTS could be readily patched following 10 or 15 min of OGD. The average resting membrane potential of 12 dNTS neurons that were newly acquired showed a 95 % recovery compared to neurons not previously exposed to OGD. Mean cell input resistance displayed an 89 % recovery and action potential amplitude recovery was 80 %.
Related posts:
 The Medical Practice Impact of Functional Neuroimaging Studies in Patients with Disorders of Consciousness
 Brain Electrophysiology in Disorders of Consciousness: Diagnostic and Prognostic Utility
 Vegetative State Two Decades After the Multi-Society Task Force (MSTF) Report
 Brain Responsiveness After Severe Brain Injury: Revolutions and Controversies
 Mesocircuit Mechanisms Underlying Recovery of Consciousness Following Severe Brain Injuries: Model and Predictions
 Exploring the Neurophysiological Correlates of Loss and Recovery of Consciousness: Perturbational Complexity
Stay updated, free articles. Join our Telegram channel

Full access? Get Clinical Tree


