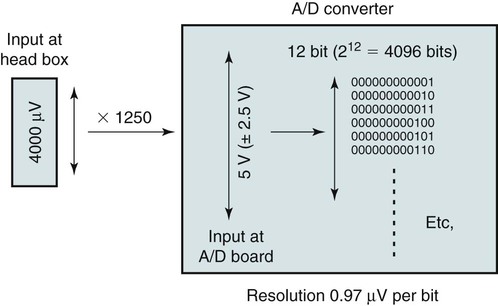
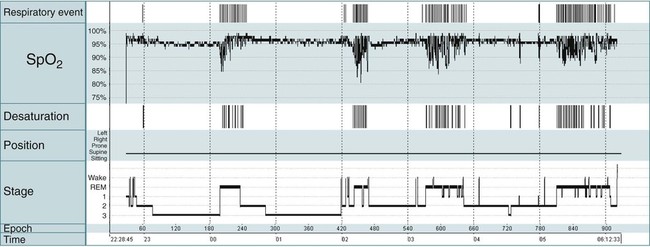
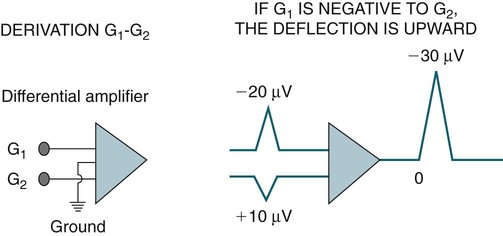
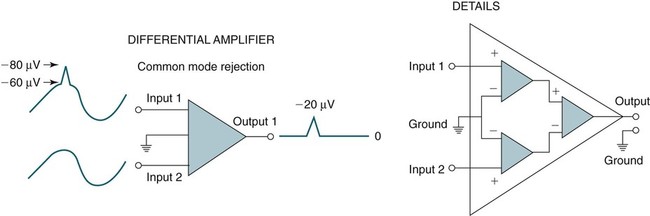
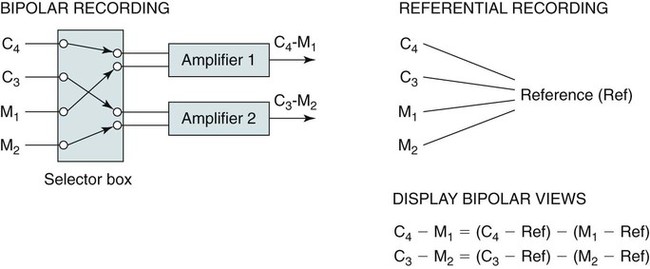
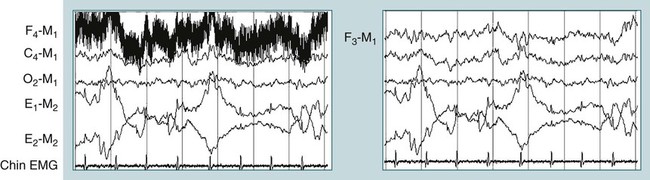
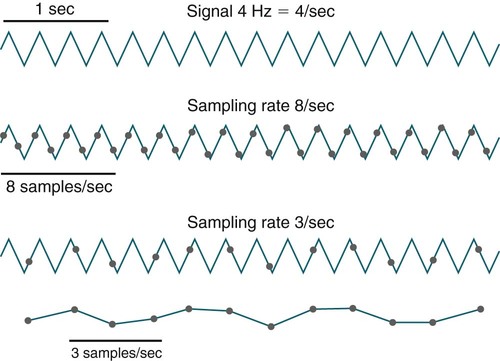
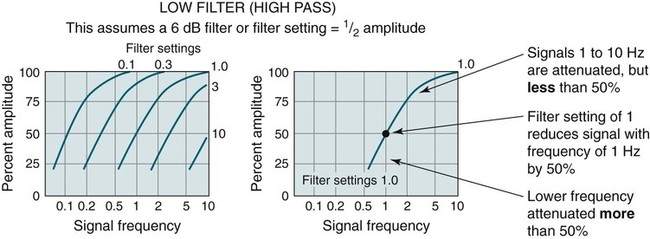
• Common mode rejection of unwanted signals by a differential AC amplifier depends on having low and fairly equal electrode impedances. An electrode impedance less than 5 KΩ is desirable (<10 KΩ acceptable). • Digital PSG typically uses a combination of AC referential, AC true bipolar, and DC recording. • In referential recording, each electrode is recorded in comparison with a common reference electrode. Any derivation (combination of differences between electrodes) can be displayed by digital subtraction [(C4-Ref) − (M1-Ref) = C4-M1] during acquisition or later during review of the study. If the reference electrode is faulty, all channels will be affected. • Most digital AC amplifiers record with a wide bandwidth (“wide open”), for example, a low-frequency filter of 0.03 and a high-frequency filter of 100 Hz. Each derivation is then displayed after processing with the desired low- and high-frequency digital filters. The recorded data are not changed by the display filters. This allows display with different filter settings if desired. • Digital recording requires appropriate sampling rates by the A/D converter depending on the variable being recorded. A suitable high-frequency filter must be used to prevent aliasing distortion. • The resolution of the monitor is usually what limits the possible resolution of the displayed data rather than the sampling rate. In sleep monitoring (polysomnography [PSG]), electroencephalographic (EEG), electro-oculographic (EOG), and electromyographic (EMG) activity is recorded by differential AC amplifiers that amplify the difference in voltage between two inputs1–3 (Fig. 2–1). Each differential amplifier has two inputs and a ground. By convention in EEG recording, if input 1 (G1) is negative relative to input 2 (G2), the deflection is upward (negative up polarity). Signals common to both inputs are not amplified (common mode rejection) (Fig. 2–2). Actually, each of the inputs is recorded against the common ground and input 2 is inverted. This allows common signals to cancel each other but differences between input 1 and input 2 to be amplified. Use of differential amplifiers permits the recording of very low voltage EEG signals that are superimposed upon larger DC scalp voltage changes and 60-cycle interference from nearby AC power lines. Common mode rejection depends on the impedance at input 1 and 2 being relatively equal. Otherwise, common signals will produce unequal voltages at the two inputs. Making the intrinsic impedance of the inputs much higher than the impedance of the electrodes minimizes the effect of unequal electrode impedances. However, a poorly conducting electrode (high impedance) will typically result in a large amount of 60-Hz artifact (signal contamination). The ground of each differential AC amplifier is connected to the common patient ground (commonly, an electrode placed on the forehead). This common ground helps balance the inputs to all the differential amplifiers, thereby improving common mode rejection. The use of grounds in EEG recording is discussed at the end of the chapter. Most digital recording systems use a combintation of referential, true bipolar, and DC recording (Table 2–1).2 In true bipolar recording, each amplifier records the difference between two electrodes of interest (A–B, C–D). Before the digital era, paper recording was performed using a selector panel and dedicated individual differential amplifiers. Using this approach, it is possible to change the electrodes (derivation) that are recorded with a given amplifier (Fig. 2–3). However, changing the derivation once the signal is recorded (changing from A–B to A–D) is not possible. Today, selector panels are rarely used in digital sleep recording. However, true bipolar recording is still used for inputs that one would not desire to change in review—for example, the two inputs of the thermal flow sensor, respiratory effort bands (thorax and abdomen), leg EMG inputs, and electrocardiographic (ECG) inputs. TABLE 2–1 In referential recording, multiple electrodes are recorded against a common electrical reference (often a single or two linked electrodes placed near the vertex). A display of any derivation using two referentially recorded electrodes is then obtained by digital subtraction [(electrode A − reference) − (electrode B − reference) = electrode A − electrode B] either during live recording or during review (see Fig. 2–3). The digital subtraction for display does NOT change the recorded data. For example, if the sleep technologist failed to observe that the electrode F4 went bad during the recording, the reviewer can change the viewed frontal derivation to F3-M1 or F3-M2 (the recommended alternative) (Fig. 2–4). For this reason, both F3 and F4 are recorded (against the reference electrode) even though only F4-M1 may be displayed in the default montage. Of note, if the reference electrode is faulty, all referential signals are affected (Fig. 2–5). In Figure 2–5, note that the true bipolar channels are not affected by a faulty reference electrode. In most digital PSG systems, the EEG, EOG, mastoid, and chin EMG electrodes are recorded referentially (see Table 2–1). DC recording is used for nasal pressure, pulse oximetry, and other DC signals such as those from the positive airway pressure device (flow, leak, tidal volume, delivered pressure), end-tidal, or partial pressure of carbon dioxide (PCO2) device (end-tidal or transcutaneous). Most digital recording systems use analog amplifiers that produce a continuous signal output. The signal is then sampled by an analog-to-digital (A/D) conversion board that converts the signal to a digital form that can be stored and manipulated by a computer. The sampling rate must be more than twice the frequencies being recorded to avoid signal distortion (Nyquist theorem).1,2,4 If lower sampling rates are used, the signal can be very distorted and the addition of frequencies lower than the original signal sampled may be introduced (Fig. 2–6). For this reason, signals with a frequency higher than half the sampling rate must be filtered out because they can cause aliasing distortion.2,4,5 For example, if the sampling rate is 200 samples/sec, the amplified signal must be processed by a high frequency filter with a cutoff frequency of 100 Hz or lower before being sampled (A/D converter). The required sampling rate depends on the frequency of the signal to be recorded. Slower varying signals require a lower sampling rate. In Table 2–2, the sampling rates recommended by the American Academy of Sleep Medicine (AASM) scoring manual6 are illustrated. Some digital PSG systems have the ability to record different signals at different sampling rates. Ultimately, the computer program uses only a small portion of the data for the display because monitor resolution (in pixels per displayed time duration) is usually much less than the sampling rate.5 TABLE 2–2 Recommended Sampling Rate for Various Polysomnographic Signals From Iber C, Ancoli-Israel S, Chesson A, Quan SF for the American Academy of Sleep Medicine: The AASM Manual for the Scoring of Sleep and Associated Events: Rules, Terminology and Technical Specifications, 1st ed. Westchester, IL: American Academy of Sleep Medicine, 2007. A/D conversion is also characterized by the dynamic range (the range of voltages accepted by the A/D converter) and the resolution. The dynamic range may be expressed as the amplified or unamplified signal range. The resolution depends on the A/D converter as well as the dynamic range. A 12-bit DC converter produces 212 = 4096 digital values (bits) or a 16-bit converter = 65,536 values across the dynamic range. A typical A/D converter might have a dynamic range for the amplified signal of 5 V (±2.5 V). Commonly, a set amplification is applied to all AC signals before A/D conversion (e.g., a gain of 1250). If one assumes an amplification of 1250, then the dynamic range (peak to peak) of an A/D converter with an amplified voltage range of 5 V expressed as the unamplified signal would be approximately 4000 µV (4000 µV × 1250 = 5,000,000 µV = 5.0 V). If a 12-bit A/D converter is used, this would result in a resolution of 0.97 µV/bit (4000 µV/4096 digital values) (Fig. 2–7). An important limitation on the accuracy of signal recording and display is introduced by the fact that the monitor resolution is usually much lower than the data sampling rate. Because the sampling rate used for most digital systems is 200 samples/sec or higher, the resolution of the monitor is often the limiting factor in the accuracy of signal display. The minimum monitor resolution recommended by the AASM scoring manual is 1600 × 1200. Assuming 1600 pixels horizontally, the visual sampling rate for displays of a 30- or 10-second window of data corresponds to a sampling rate of approximately 50 and 150 samples/sec if the entire monitor display consists of waveforms. Then according to the Nyquist theorem, frequencies of 25 or 75 Hz or greater would be prone to aliasing. A monitor-induced aliasing distortion of data can sometimes be noted if switching from a 30-second to a 10-second view significantly changes the shape of the activity being visualized.5 During traditional paper-ink recording for sleep, the paper speed was 10 mm/sec, which produced 30-second pages (30-cm-wide paper). A faster speed was used for clinical EEG (30 mm/sec). However, such a fast paper speed would produce a very large amount of paper for each sleep study. In digital recording, one can choose various time windows during either acquisition or review. A 30-second window (equivalent to a paper speed of 10 mm/sec) is used for sleep staging and for scoring arousals. Time windows of 60 to 240 seconds may be used to view and score respiratory events and leg movements. Alternatively, viewing data in a 10-second window (equivalent to 30 mm/sec) is the usual method for clinical EEG recording. This allows better visualization of very brief events (sharp waves and spikes) and interictal or epileptiform activity. The 10-second window can also be useful for measuring the frequency of a group of oscillations or viewing the ECG result. The traditional ECG speed is 25 mm/sec, which is quite close to 30 mm/sec. Some systems allow split screens with different time windows in each screen. All digital sleep monitoring systems also provide an all-night condensed view with graphs of the hypnogram (representation of sleep stages), arterial oxygen saturation (SpO2 tracing), continuous positive airway pressure (CPAP) levels, respiratory events, and body position (Fig. 2–8). This allows a useful overview of the entire recording. One can usually select a time point (double click) on a given position in the summary view and be taken to that time point in the more detailed tracings. Any signal of interest can be contaminated by unwanted low- or high-frequency signals or 50- to 60-Hz artifact (from nearby AC power lines). Filters allow these components to be diminished. For example, a low-frequency filter (high-pass filter) attenuates the amplitude of low-frequency signals. A high-frequency filter (low-pass filter) attenuates the amplitude of high-frequency signals.1 The amount of signal reduction due to a given analog or digital filter is given in decibels. The amount of signal reduction in decibels (dB) is given by the formula 20 log (voltage-out/voltage-in), where voltage-out and voltage-in are the amplitude of the signal entering and leaving the filter, respectively. A signal reduction of 30% and 50% (voltage-out/voltage-in ratios of ∼ 0.7 and 0.5, respectively) corresponds to 3 dB and 6 dB reductions. Different filter settings (e.g., 0.3, 1) are named by the “cutoff frequency,” which is the frequency of the signal that is reduced by 3 or 6 dB depending on the terminology and the type of filter the manufacturer uses. Therefore, a filter setting of “X Hz” means that the amplitude of a signal with a frequency of X is diminished by 30% or 50% depending on whether the 3 dB or 6 dB cutoff frequency is used to name the filter. A 1-Hz low-frequency filter (3 dB) attenuates a 1-Hz signal by 30% (or to 70% of the original signal). Similarly, a 6 dB filter would attenuate a 1-Hz signal by 50%. Signal strength of frequencies below 1 Hz would be attenuated even more (Figs. 2–9 and 2–10). It is important to realize that frequencies slightly above the low-frequency filter setting of 1 Hz will also be attenuated by a 1-Hz low-frequency filter, although to a lesser degree. Figure 2–10 illustrates the effect of various low-frequency filters (denoted by their 3 dB cutoff frequency) on low-frequency signals. A range of possible low-frequency filter settings (off, 0.01, 0.03, 0.1, 0.3, 1, 3, and 10) is commonly provided.
The Technology of Sleep Monitoring
Differential Amplifiers, Digital Polysomnography, and Filters
Referential and Bipolar Recording
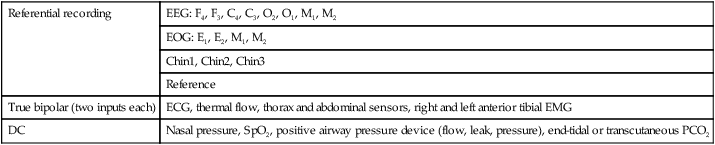
Referential recording
EEG: F4, F3, C4, C3, O2, O1, M1, M2
EOG: E1, E2, M1, M2
Chin1, Chin2, Chin3
Reference
True bipolar (two inputs each)
ECG, thermal flow, thorax and abdominal sensors, right and left anterior tibial EMG
DC
Nasal pressure, SpO2, positive airway pressure device (flow, leak, pressure), end-tidal or transcutaneous PCO2
Sampling Rate
SAMPLING RATES
DESIRABLE (Hz)
MINIMAL (Hz)
EEG
500
200
EOG
500
200
EMG
500
200
ECG
500
200
Airflow
100
25
Oximetry
25
10
Nasal pressure
100
25
Esophageal pressure
100
25
Body position
1
1
Snoring
500
200
Rib cage/abdominal movements
100
25
Monitor Resolution
Time Window for Display
Filters (Low-Frequency, High-Frequency, and Notch Filters)
Low-Frequency Filter
Related posts:
 Obstructive Sleep Apnea Treatment Overview and Medical Treatments
 The Restless Leg Syndrome, Periodic Limb Movements in Sleep, and the Periodic Limb Movement Disorder
 Biocalibration, Artifacts, and Common Variants of Sleep
![]() Monitoring Respiration—Event Definitions and Examples
Monitoring Respiration—Event Definitions and Examples
 Central Sleep Apnea and Hypoventilation Syndromes
 Cardiac Monitoring during Polysomnography
![]()
Stay updated, free articles. Join our Telegram channel

Full access? Get Clinical Tree


The Technology of Sleep Monitoring: Differential Amplifiers, Digital Polysomnography, and Filters