Chapter 2 Visual Analysis of the EEG:
Wakefulness, Drowsiness, and Sleep
QUICK TOUR: Transition of the EEG from Wakefulness to Drowsiness, Sleep, and Arousal from Sleep
Wakefulness
Figure 2-1 shows the typical appearance of the EEG in a patient who is awake with eyes closed. The basic setup of the EEG page is summarized in the figure’s caption. The most prominent rhythm on the page is denoted by the solid black arrows and is called the posterior rhythm. Note that this waveform is highly rhythmic and sinusoidal (i.e., shaped like a sine wave). It is of highest voltage in the posterior or occipital channels (black arrows) and becomes much less prominent in the anterior channels. The posterior rhythm is best seen when the patient is awake with eyes closed.
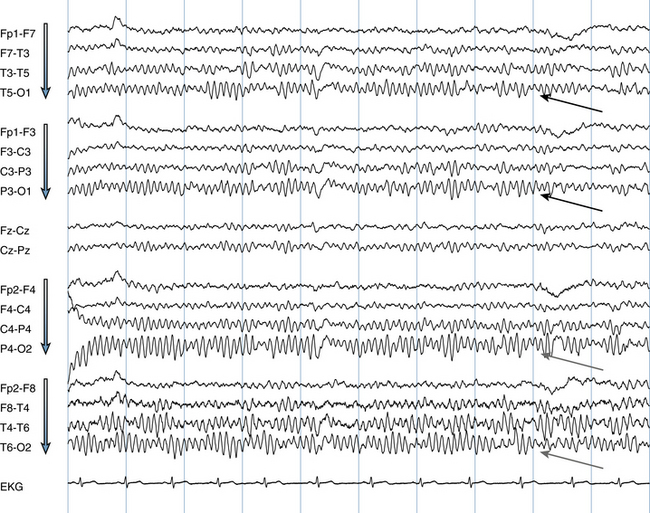
Table 2-1 Summary of Transition from Wakefulness to Sleep in the Routine EEG
| Awake | Eyes closed: posterior rhythm present Eyes open: low-voltage, nondescript pattern seen posteriorly, posterior rhythm absent |
| Drowsy | Mild slowing of the posterior rhythm Slow roving lateral eye movements appear Disappearance of posterior rhythm in the occipital areas, replaced by low-voltage theta activity Diffuse increase in theta range activity, particularly at the vertex |
| Stage I Sleep | Vertex waves of sleep |
| Stage II Sleep | Sleep spindles K-complexes |
| Arousal | High-voltage hypersynchronous (rhythmic) slowing in some Return of posterior rhythm and typical waking patterns |
As seen in Figure 2-2, the posterior rhythm suppresses and often disappears completely with eye opening and fixation of gaze. When the eyes are closed, the rhythm returns. In summary, the posterior rhythm is a rhythm of wakefulness that is present when the eyes are closed. During wakefulness with the eyes open, the EEG shows a lower voltage, nondescript pattern in the occipital region, as is seen in Figure 2-2, between eye opening and closure.
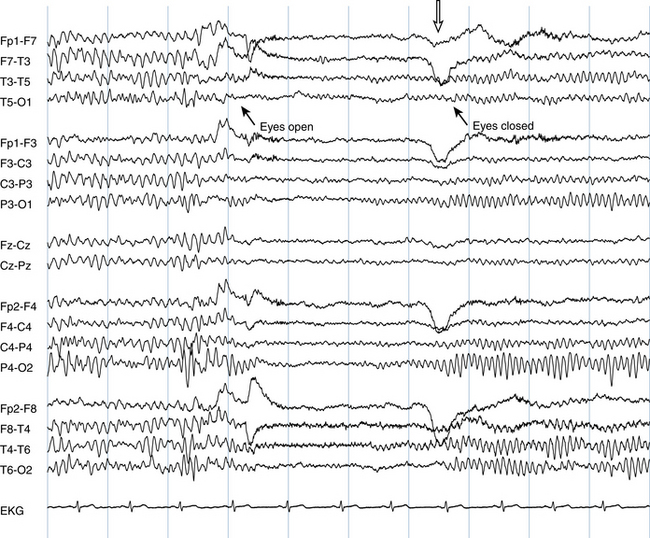
Figure 2-2 EEG of the same patient shown in Figure 2-1, awake, demonstrating the effect of spontaneous eye opening and closure on the posterior rhythm. The posterior rhythm suppresses dramatically with eye opening. Note also that the posterior rhythm actually begins to return 1.5 seconds before the eyes close, suggesting a period of relative visual inattention. The exact moment of eye closure is marked by the eye-closure artifact seen in the frontal leads (hollow arrow).
Drowsiness
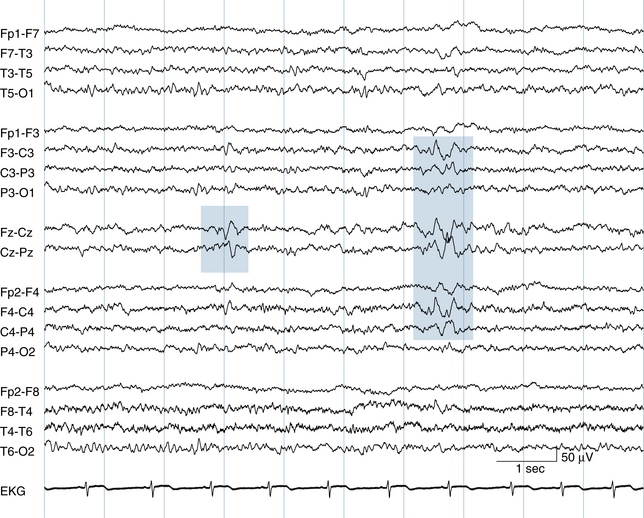
One of the first EEG changes seen in drowsiness is a subtle slowing of the posterior rhythm. In Figure 2-3, the posterior rhythm is seen to slow over the course of the page from 10 Hz in the first second of the page to 8 Hz in the seventh second, an early indication of drowsiness in this patient. (This brief period of posterior rhythm slowing is not always identifiable; sometimes the posterior rhythm simply “drops out” without an observable period of slowing.) Another, more subtle finding is that of slow roving lateral eye movements of drowsiness, which are indicated by the shaded rectangles (see figure caption for further explanation). Such slow roving eye movements are commonly detected by the EEG but are not actually visible on casual observation of the patient because they are hidden by the patient’s eyelids. Although the appearance of slow roving eye movements in the EEG technically represents an artifact (because they are not actual brain waves), they still provide useful information to the reader regarding onset of drowsiness. The EEG appearance of slow roving eye movements is discussed in more detail in Chapter 6.
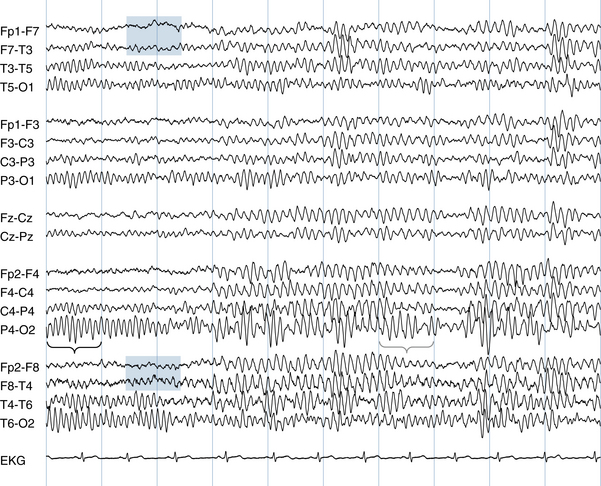
Figure 2-3 The initial transition to drowsiness is marked by a slowing of the posterior rhythm. A frequency of 10 Hz can be counted over the black brace in the first second of this page. The frequency falls to approximately 8 Hz by the seventh second over the blue brace. Artifact from slow roving eye movements can also be seen: note the subtle spreading apart of the waveforms of the two channels that include F7 (top blue rectangle) compared with a relative narrowing together of the two channels that include F8 (bottom blue rectangle). The appearance of this artifact is caused by a slow roving movement of the eyes to the left, a sign of early drowsiness, and is described in more detail in Chapter 6.
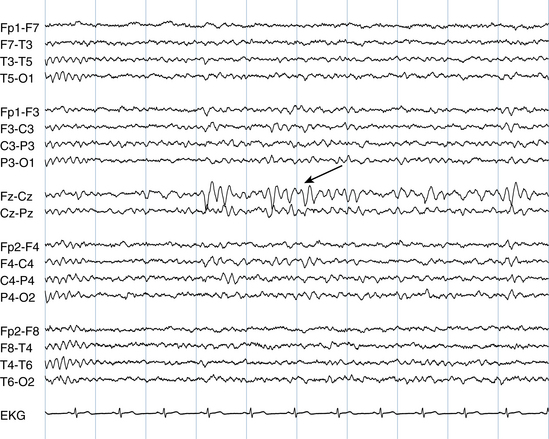
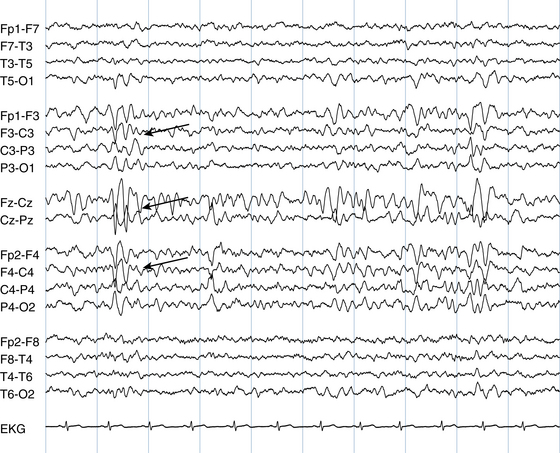
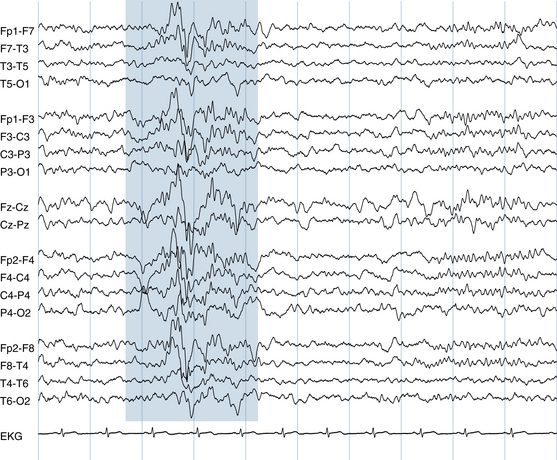
The next EEG page (Figure 2-4) in this example shows two additional important changes that mark advancing drowsiness: first, the posterior rhythm has dropped out nearly completely. Second, there is an increase in theta-range (slow) activity throughout the tracing. Most characteristically, theta activity has appeared at the vertex, particularly in the midline central (Cz) electrode, although it may be seen in other locations as well.
On the following EEG page (Figure 2-5), the first true vertex waves of sleep are seen. These midline sharp waves mark the onset of Stage Ia sleep and may occur in dramatic bursts. After they are established, assuming no subsequent arousals, vertex-wave bursts continue in a repetitive fashion through Stage II sleep.
Stage II Sleep
The onset of Stage II sleep is defined by the appearance of sleep spindles. The sleep spindles that occur early in Stage II sleep are usually of maximum voltage in the central electrodes (C3 and C4) and at the central vertex (Cz), as is seen in this example. They consist of lower voltage, regular 14-Hz waves lasting from 1 to a few seconds. In deeper Stage II sleep, the field of sleep spindles may include both the frontal and central areas. Figure 2-6 shows the appearance of the first, bicentral sleep spindles in this patient, intermixed with vertex waves. By the next page, the sleep spindles become more sharply defined (see Figure 2-7) and continue to be intermixed with repetitive vertex waves. The combination of repetitive vertex waves and spindles marks well-established Stage II sleep. An example of the fields of spindles and vertex waves is shown in Figures 2-8 and 2-9 and schematically in Figures 2-10 and 2-11.
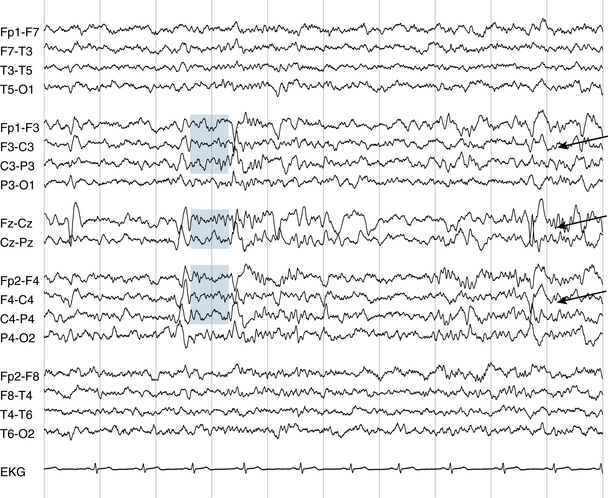
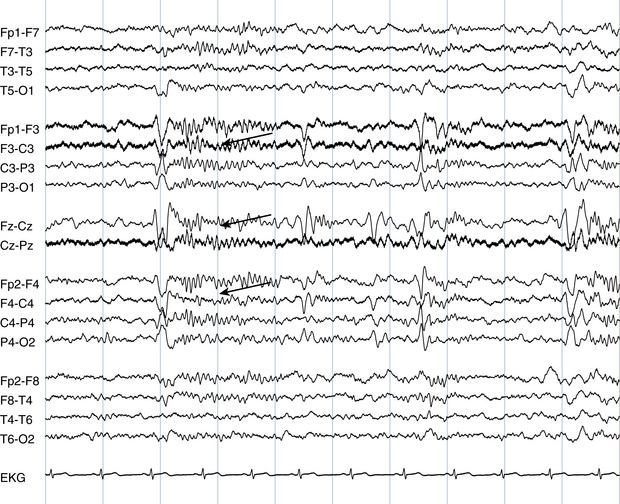
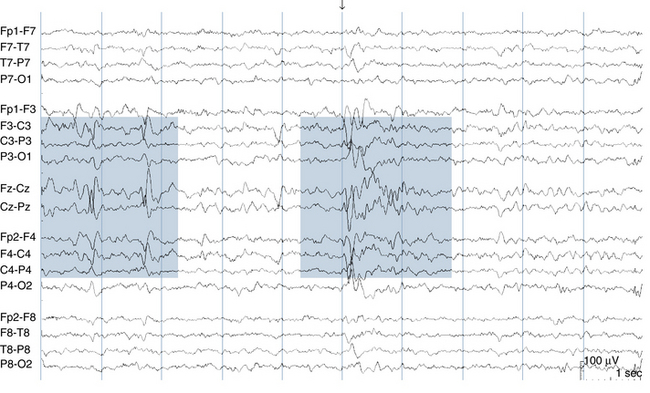
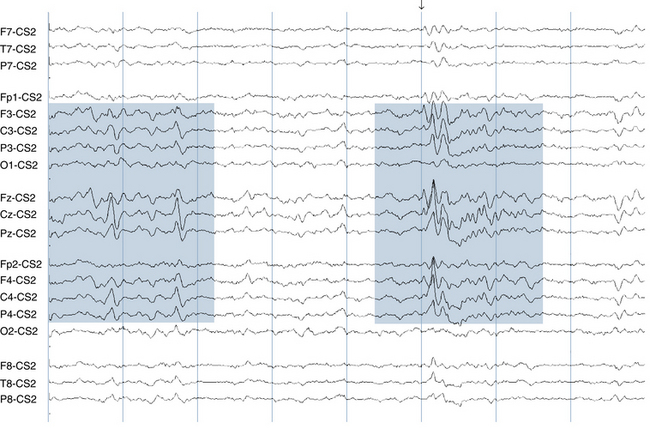
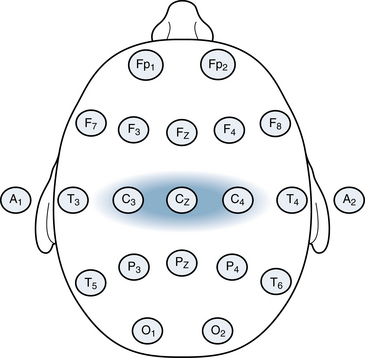
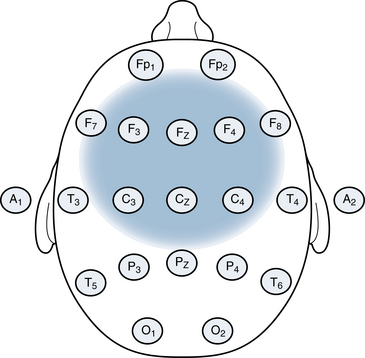
Figure 2-11 Classically, spindles are centered over the central areas, particularly the C3 and C4 electrodes. In many examples such as the EEG traces shown in Figures 2-8 and 2-9, spindles are also seen to spread frontally (F3 and F4 electrodes). The field of spindles only occasionally spreads laterally to the midtemporal electrodes where they should be of lower voltage compared with the central electrodes or not seen at all.
Bursts of high voltage waves occurring across nearly all channels may be seen sporadically in sleep. These discharges, called K-complexes, can be dramatic and are sometimes mistaken for spike-wave discharges, an epileptiform abnormality. K-complexes may be set off by stimuli (such as a noise) in the environment of the sleeping patient that cause a mild subarousal (an increase in the level of arousal or a lightening of the sleep state that is not strong enough to awaken the patient fully). In fact, EEG technologists often demonstrate K-complexes in the EEG by tapping a pencil on the EEG instrument while the patient is in light sleep. The tapping sound may elicit a subarovsal and an associated K-complex. Most K-complexes, however, appear to occur spontaneously without an obvious trigger. The field of a K-complex differs from that of sleep spindles or sleep vertex waves and is shown in Figure 2-12. K-complexes may or may not be intermixed with a sleep spindle, as occurs in the example shown in Figure 2-13.
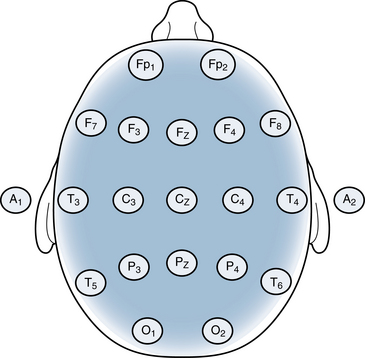
Figure 2-12 The field of a K-complex is diffuse and may include all brain areas. This helps differentiate it from simple spindles, which are maximum frontocentrally and concentrated in the midline and parasagittal areas as described in Figure 2-11. A sleep waveform of an intensity just as strong in the temporal areas as in the midline is not likely to represent a sleep spindle or vertex wave but may represent a K-complex.
Arousal from Sleep
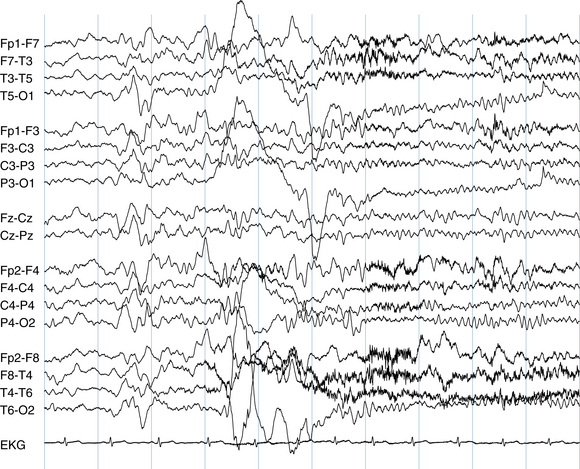
Arousal from sleep may occur uneventfully with a simple return of the posterior rhythm and other patterns of wakefulness described earlier. At other times, arousal from sleep may be marked by a dramatic run of diffuse, high-voltage rhythmic waves called an arousal hypersynchrony. Figure 2-14 shows a fairly simple arousal with a brief increase in rhythmic slowing followed by high-voltage motion artifact generated from the patient stirring in bed. This is followed by a return of the posterior rhythm.
The sequence of wakefulness to drowsiness to sleep is shown in a second patient in Figures 2-15 through 2-20, with fewer figure markings to help the render practice identification of normal sleep waveforms.
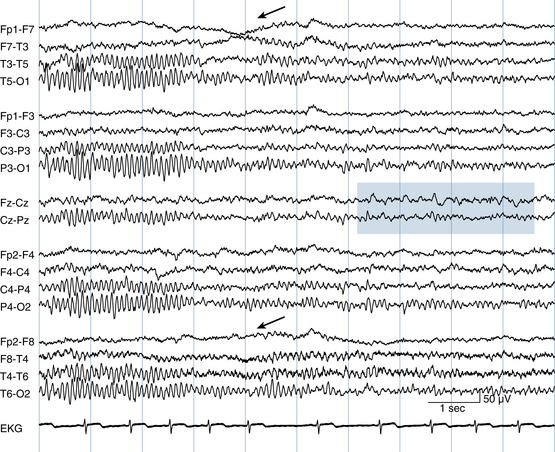
Figure 2-16 During the course of this page, the posterior rhythm drops in frequency by 1 Hz and becomes less prominent (seen best in T5-O1, P3-O1, P4-O2, and T6-O2). Slow roving lateral eye movements are seen as evidenced by approximation of the Fp1-F7 and F7-T3 channels at the same time as a mild “bulging apart” of the Fp2-F8 and F8-T4 channels (arrows). The reason that lateral eye movements create this appearance is explained in more detail in Chapter 6. An increase in theta activity, another sign of drowsiness, is seen at the vertex in the seventh and eighth seconds in the Fz-Cz channel (blue rectangle).

Stay updated, free articles. Join our Telegram channel

Full access? Get Clinical Tree


