Non-contrast head CT axial image at the level of the basal cisterns demonstrates hyperdensity in the expected location of the basilar artery (arrow).
The clinical history and abnormal computed tomography (CT) findings prompted a magnetic resonance imaging (MRI) and MR angiogram (MRA) of the brain with and without contrast, which demonstrated single punctate foci of susceptibility within the occipital horns of the lateral ventricles consistent with hemorrhage or calcification but no aneurysm (Figure 4.2).
Ultimately, a diagnostic lumbar puncture (LP) was performed in the emergency department at approximately 5.5 hours post symptom onset because of the concern for subarachnoid hemorrhage (SAH). Cerebro spinal fluid (CSF) analysis showed 4 mL of blood-tinged CSF (reported as non-traumatic); red blood cells (RBCs) 48K on tube 1, 44K on tube 4; no xanthochromia; protein content 156 mg/dL (normal range 15–45 mg/dL). CSF was otherwise normal. The patient was admitted to the neurosciences intensive care unit (NICU) for aneurysmal SAH. The patient remained hemodynamically stable with a persistent 5/10 frontal headache. A diagnostic cervical and cerebral catheter angiogram was performed the next morning which demonstrated a 3 mm dorsal wall, blister-type aneurysm involving the ophthalmic/hypophyseal segment of the right internal carotid artery (Figure 4.3).
MRI of the entire spine with and without contrast and a repeat diagnostic LP was performed after the angiogram. The MRI of the spine was normal. The repeat LP was performed under fluoroscopy to yield the cleanest possible sample. CSF analysis of the second LP: opening pressure 12 cm H2O; 10 mL of blood-tinged CSF; 5K RBCs on tube 1; 4K RBCs on tube 4; positive xanthochromia. Following a multidisciplinary discussion, the decision was made to treat the right internal carotid artery (ICA) blister-type aneurysm via an endovascular approach. The patient was loaded with aspirin and clopidogrel, as per protocol. The patient underwent uneventful treatment of the right ICA aneurysm with an endoluminal flow-diverting stent approximately 48 hours later.
Discussion
This patient presented with a “thunderclap” headache that is classic for SAH and 80% of the time secondary to aneurysm rupture. The diagnostic imaging in this patient was relatively unimpressive for a ruptured cerebral aneurysm. The sensitivity of an NCCT for acute SAH ranges from 97.5% to 93% but decreases with time to approximately 50% sensitivity at 7 days post ictus [1,2]. MRI of the brain begins to surpass the sensitivity of CT for the detection of SAH as the time from ictus increases. However, MRI is particularly fraught with susceptibility artifact near the skull base and aerated structures such as sinuses and mastoid air cells. In this particular case, the CT scan was essentially negative for SAH as there was lack of hemorrhage visible within the basal cisterns despite imaging at time interval less than 5 hours post ictus. Hemorrhage on MRI will have variable signal intensity (brightness or darkness) depending on the age of the intracranial blood breakdown products. Typically SAH hemorrhage will have increased signal or brightness on fluid-attenuated inversion recovery images (FLAIR) and decreased signal on gradient-recalled echo (GRE) or susceptibility-weighted imaging (SWI), which are generally the most sensitive sequences for the detection of SAH. Unfortunately, FLAIR and GRE/SWI images have a relatively low specificity secondary to pulsation and susceptibility artifact, respectively. The GRE images in this case did detect punctate foci of susceptibility within the occipital horns of the lateral ventricles; however, this could be hemorrhage, calcium, and/or mineralization. The lack of calcification on the prior NCCT confirms the MRI findings are secondary to heme. The initial diagnostic LP was suspicious for SAH given the persistently elevated RBC count in tubes 1 and 4 despite the lack of xanthochromia. Optimal timing of the LP is debatable but >6 hours and preferably at least 12 hours post ictus is recommended [3]. A sufficient time interval is necessary to allow hemoglobin breakdown and bilirubin formation within the CSF thus resulting in xanthochromia. Ultimately, our patient had a repeat LP with fluoroscopic guidance at approximately 20 hours post ictus which demonstrated persistent RBCs and xanthochromia. Digital subtraction cerebral angiography (DSA) remains the “gold standard” for the detection of cerebral aneurysms. However, the sensitivity of multidetector CT angiography (CTA) is near 99% and now approaches the sensitivity of DSA. A spinal MRI was performed in this patient to exclude a possible spinal vascular malformation or arteriovenous fistula as a cause of SAH. Although several studies have concluded that the addition of a spinal MRI in this setting is probably unnecessary [4].
Tip
The compelling force for decision-making and necessity to exclude aneurysmal SAH in this case hinged on the classic clinical presentation of “thunderclap and worst headache of life.” The diagnostic imaging in this case was not particularly conclusive and possibly would have resulted in delayed diagnosis or non-treatment of a small (3 mm) ruptured cerebral aneurysm. Furthermore, one must exercise caution with regard to interpretation of ancillary laboratory data, particularly the CSF cell count and absence of xanthochromia, if the LP is performed within 0–12 hours post ictus. The differential diagnosis of SAH is broad and beyond the scope of this chapter but is most commonly associated with aneurysm rupture (80%) followed by perimesencephalic non-aneurysmal SAH and reversible cerebral vasoconstriction syndrome (RCVS). The inherent imaging pitfalls in the detection of subarachnoid blood are essentially identical regardless of the etiology. Pitfalls in the diagnosis of SAH are further discussed in Chapter 16.
Case 2. Cervicocerebral atherosclerotic disease and ischemic stroke
Case description
A 58-year-old right-handed woman with a history of hypertension, asthma, and 30 pack-years smoking presented with slurred speech and right-sided weakness which was worse and progressive relative to her baseline. The patient had been discharged approximately 2 weeks prior to admission after suffering left hemispheric watershed and embolic strokes. She was in her usual state of health with mild residual right-sided weakness, arm more involved than leg, intermittent spastic dysarthria and non-fluent aphasia when her symptoms worsened during an argument with her spouse. She had known bilateral ICA and left vertebral artery occlusion based on a prior cervicocerebral DSA and CTA (Figure 4.4).
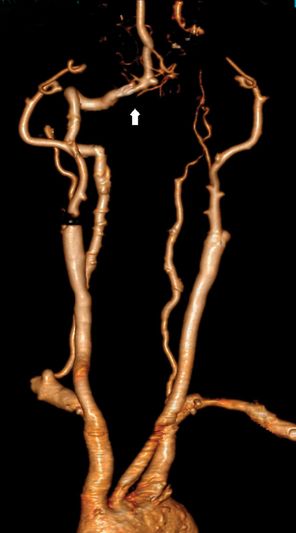
3D volume rendering, CTA of the head and neck demonstrating the right vertebral artery (arrow) as the single intracranial arterial supply. The bilateral internal carotid and left vertebral arteries are occluded.
She was previously discharged on a medical regimen of daily amlodipine 2.5 mg, lisinopril 2.5 mg, atorvastatin 80 mg, aspirin 81 mg, and clopidogrel 75 mg by mouth. On admission, she was afebrile, her blood pressure was 140/60 mmHg and pulse was 66 beats per minute. Respiratory rate was 18 breaths per minute, and O2 saturation was 97%. Neurologic examination was notable for mild dysarthria and 4/5 right upper extremity grip strength. Laboratory data and transthoracic echocardiogram (TTE) were normal. MRI of the brain demonstrated two new foci of acute infarction within the left corona radiata (Figure 4.5), subacute anterior and posterior left border zone infarctions, left middle cerebral artery (MCA) territory embolic infarcts, chronic right MCA infarcts, and severe bilateral chronic border zone infarctions.
Antihypertensive medications were withheld and she was admitted to the NICU for observation and hemodynamic monitoring. She remained hemodynamically and neurologically stable and returned to her pre-admission baseline within 72 hours without the need for blood pressure augmentation. MR perfusion, CT perfusion, and CTA of the head and neck were performed prior to discharge. She was maintained on her initial medical regimen, remained asymptomatic, and was discharged to home.
Discussion
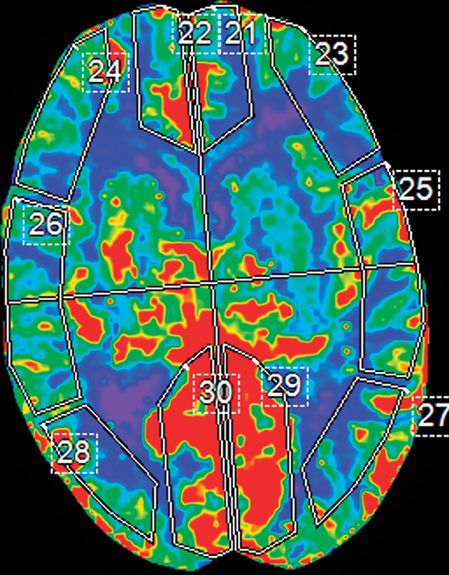
Given the patient’s history of known cervical arterial vascular occlusion, intermittent, waxing and waning symptoms, the most appropriate and sensitive initial study for this new presentation was an MRI of the brain to determine areas of new infarction/ischemia. An NCCT scan would be appropriate if there was any indication of an acute hemorrhage; this was not the case here. The NCCT would have very low sensitivity for an acute infarct in this setting, given her relatively low National Institutes of Health Stroke Scale (NIHSS) score and background of extensive chronic infarcts and ischemia. The favored diagnosis on admission was hypoperfusion syndrome and watershed/border zone infarcts which may be exacerbated by hyperventilation (following an argument with her spouse) resulting in decreased blood pCO2 and cerebral vasoconstriction. However, the infarcts on the prior MRI where not entirely limited to a border zone territory but rather had an embolic component. Furthermore, the new and recent infarcts on MRI were primarily isolated to the left MCA territory. From where would such emboli originate and how could emboli get to the left MCA territory in the setting of bilateral ICA and left vertebral artery occlusion? The entire intracranial arterial vasculature in this patient was primarily supplied from the right vertebral artery through the posterior communicating arteries and pial/leptomeningeal collaterals. Embolic material traveling through the right innominate artery, right subclavian, and right vertebral artery to the intracranial arterial vasculature would inevitably result in embolic strokes within the posterior circulation and right anterior circulation rather than strokes isolated to the left MCA territory as in this patient. No additional vascular territory infarcts where demonstrated on three MRIs over the course of 3 weeks. An MR perfusion (MRP) examination was chosen to test the perfusion to the left MCA territory. Unfortunately, the MRP examination was extremely degraded by patient motion and was non-diagnostic (Figure 4.6).
MR brain perfusion; axial contrast-enhanced susceptibility-weighted images demonstrating rotational head motion between the two scan intervals. Note the decreased signal intensity within the internal cerebral veins, left insula, and operculum secondary to the paramagnetic effects of gadolinium.
The second available option was to try CT perfusion (CTP), which has rapid image acquisition and is less sensitive to motion. Drawbacks to CTP are necessity of iodinated contrast, radiation exposure, and questionable accuracy in defining core infarct volume and penumbral tissue [5]. A successful CTA and CTP examination was performed which demonstrated mildly prolonged (~2 s) mean transit time (MTT), preserved relative cerebral blood volume (rCBV), and relative cerebral blood flow (rCBF) within the left MCA territory (Figure 4.7).
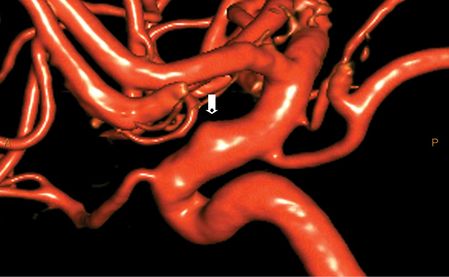
At the time of the CTP examination the patient had returned to her baseline. Her symptoms remained unaffected by fluctuations in blood pressure, position, or ambulation. The embolic phenomenon was revisited with careful attention to the left internal carotid artery. Carotid ultrasonography/Doppler (not shown) demonstrated occlusion of both ICAs and left vertebral artery. Carotid Doppler ultrasound is extremely operator dependent and not particularly specific in the evaluation of complete vessel occlusion or the acuity of the occlusion. With the exception of newborns and transcranial Doppler (TCD), ultrasound has a limited role for the evaluation of the intracranial vasculature because of the overlying cranium. The prior DSA demonstrated retrograde opacification of normal caliber left cavernous and petrous ICA and visualization of small geometric filling defects and a meniscus within the left petrous ICA consistent with thrombus (Figure 4.8).
DSA; left common carotid injection, lateral projection demonstrates left internal carotid artery occlusion with intracranial reconstitution through the ophthalmic artery (arrowhead) and retrograde filling of the left cavernous and petrous carotid artery. Note the filling defects within the left petrous carotid (arrows).
Unfortunately, DSA can only image vessels and structures that fill with contrast. Vessel wall and surrounding tissue escapes detection with this modality. Fortunately, both MR and CT have the capability to image intra- and extraluminal structures as well as the vessel wall [6]. This patient’s left ICA imaging findings – DSA, NCCT (hyperdense “clot” in the high left cervical ICA, not shown) and CTA (hypodense plaque and enhancing vessel wall) – indicated that the left carotid occlusion was a recent event and that she was probably experiencing “stump” emboli from the left ICA with or without hypoperfusion syndrome (Figure 4.9).
Tip
The overwhelming majority of strokes that result from cervical carotid or vertebral artery occlusion or stenosis are secondary to thromboembolism rather than hypoperfusion. The ability of MR or CT perfusion imaging to identify at-risk ischemic penumbral tissue is debatable and continues to be investigated. MRI with diffusion-weighted imaging (DWI) is the best modality to assess acute cerebral infarct. The sensitivity and specificity of CTP to identify cerebral infarct core is debatable. Current available data does not support the routine use of perfusion imaging for the triage of acute stroke patients [7]. MRP is extremely vulnerable to motion and thus not always suitable for the acute stroke patient who might be aphasic. CT perfusion acquisition is rapid and less sensitive to patient motion at the expense of iodinated contrast and radiation exposure. CTA may be falsely positive for vessel occlusion in the setting of severe stenosis depending on the timing of contrast bolus. Research, mostly MRI, concerned with plaque imaging and composition to assess high or low stroke risk is ongoing.
Case 3. Non-contrast CT and ischemic stroke
Case description
A 60-year-old right-handed woman with a history of metastatic renal cell carcinoma presented to the emergency department (ED) with acute onset of left hemiplegia, hemineglect, left facial droop, and dysarthria. She was in her usual state of health until her husband noticed that she acutely began slurring her words and could not move her left side. He immediately called the emergency services. Upon admission she had left hemiplegia, left hemineglect, left facial droop, and moderate dysarthria: NIHSS score 21. NCCT (spiral technique) was obtained at approximately 2 hours after symptom onset and read as negative (Figure 4.10).
Axial NCCT head through the level of the lentiform nuclei and posterior insula demonstrates obscuration of the right putamen and insular cortex.
Intravenous tissue plasminogen activator (IV tPA) was administered within 3 hours of symptom onset per protocol but her neurological examination failed to improve. MRI and MRA performed at approximately 10 hours following symptom onset demonstrated a large (>1/3) right MCA territory acute infarct, multiple acute left MCA territory infarcts, posterior circulation acute infarcts, and a distal right MCA occlusive thrombus. The patient was intubated for airway protection and transferred to the intensive care unit. Her neurological examination deteriorated in concordance with progressive brain swelling and subfalcine herniation. An emergent right hemicraniectomy was performed within 48 hours of stroke onset. Unfortunately her hospital course was complicated by pneumonia, atrial fibrillation (AF) with rapid ventricular response, acute renal insufficiency, and inability to wean from the ventilator. Per family request, she was terminally extubated.
Discussion
The patient’s presentation is classic for an acute stroke, either ischemic or hemorrhagic. An NCCT of the brain is a necessity and usually the first imaging study obtained in the acute stroke setting. Advantages of an NCCT are: readily available, fast image acquisition, and 98% sensitivity for the detection of hemorrhage [8]. The exclusion of acute hemorrhage or hemorrhagic infarct is the most important use of the NCCT prior to the administration of IV tPA, which is the only FDA-approved treatment for acute ischemic stroke. But what about MRI in the setting of acute ischemic and/or hemorrhagic stroke? Yes it is true that MRI, specifically DWI, is the most sensitive imaging modality to detect acute ischemic infarct. An MRI, especially GRE and SWI, is especially sensitive for the detection of hemorrhage. But MRI is prone to false positives for the detection of hemorrhage when there is susceptibility artifact from air, bone, calcium, and/or metal. A focus of susceptibility on brain MRI should not prevent a patient from receiving appropriate treatment (IV tPA) as this finding is not necessarily hemorrhage. An NCCT must be reviewed or obtained to be sure that you are not looking at a false positive such as calcification on the MRI. The sensitivity of NCCT to detect an acute infarct within the first 3–6 hours is approximately 60%. Overall sensitivity and specificity of NCCT in the diagnosis of stroke is 64% and 85%, respectively. Sensitivity of NCCT approaches 100% at 24 hours or greater. The earliest signs of ischemia on NCCT are: decreased parenchymal attenuation; obscuration of the lentiform nucleus and/or insular ribbon; dense MCA sign and sulcal effacement. Ischemia is visualized on NCCT as hypodensity or hypoattenuation typically involving gray and white matter in an arterial vascular distribution because of the accumulation cytotoxic edema. Cytotoxic edema results from ischemia and depletion of ATP causing the failure of ion pumps and cellular swelling. Decreased density on NCCT is very specific for irreversibly damaged brain tissue if visualized in the first 6 hours of symptom onset [8]. If one look carefully at this patient’s NCCT, one can see early findings indicative of acute stroke: obscuration of the right lentiform nucleus and insular ribbon (see Figure 4.10).
If these findings had been made earlier, would this have changed the management in this case? Probably not. The patient was appropriately given IV tPA based on the clinical presentation and lack of hemorrhage on the NCCT. Whether or not this patient would have benefited from rapid or earlier advanced imaging such as MRI/MRA, CTA or perfusion studies and possible intra-arterial therapy is the basis of ongoing research and clinical trials. Endovascular stroke therapy will be discussed in Chapter 8.
Related posts:
 Recognizing cerebrovascular etiologies of “thunderclap†headaches
Choosing the right patients for carotid artery procedural interventions
Transient ischemic attacks (TIAs) – an underrecognized and undertreated disorder
The diagnosis and overdiagnosis of cerebral vasculitis
Dilemmas in endovascular stroke therapy
Underdiagnosis of reversible cerebral vasoconstriction syndromes
Recognizing cerebrovascular etiologies of “thunderclap†headaches
Choosing the right patients for carotid artery procedural interventions
Transient ischemic attacks (TIAs) – an underrecognized and undertreated disorder
The diagnosis and overdiagnosis of cerebral vasculitis
Dilemmas in endovascular stroke therapy
Underdiagnosis of reversible cerebral vasoconstriction syndromes
Stay updated, free articles. Join our Telegram channel

Full access? Get Clinical Tree


