Real-time display of brain perfusion with low MI perfusion imaging of the brain on a Philips IU22 platform using a 1- to 5-MHz dynamic pulsed-array transducer. (A) The arrival of the contrast agent SonoVue® is first observed in the M3 segments of the middle cerebral artery (arrows). (B) Thereafter, the contrast agent is delivered to the capillaries, which are then depicted with contrast-specific ultrasound as a homogeneous contrast enhancement in brain tissue. For anatomical reference, the arrows show the well-delineated frontal horns of the lateral ventricles.
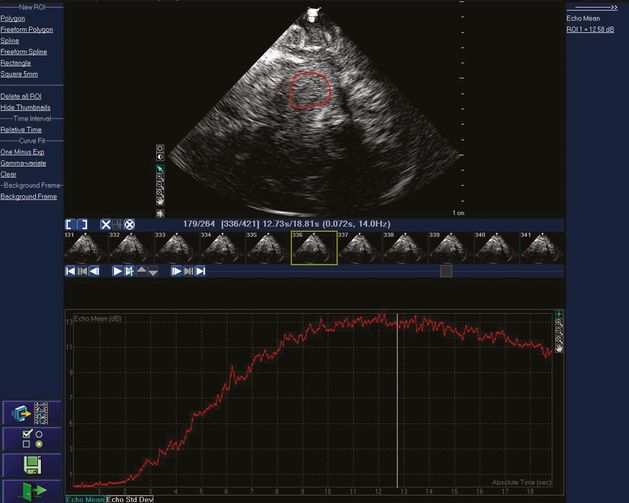
Real-time acoustic intensity curve of the contrast agent SonoVue® after bolus injection on a Philips IU22 platform using a 1- to 5-MHz dynamic pulsed array transducer. A very low MI of 0.017 is used, which is then attenuated about 90% by the skull bone before entering the brain. A region of interest has been drawn in the upper image to determine where mean acoustic intensity will be measured. The smaller images in the middle of the figure are the individual image frames at 14 Hz. The red curve displays the mean acoustic intensity of contrast bolus arrival from the region of interest for a total of 264 frames during 18.81 seconds.
Bolus, destruction and refill kinetics
After UCA bolus injection, time–intensity curves (TICs) with contrast wash-in and wash-out phases can be generated using contrast-specific imaging and further analysis. Different parameters of these curves can be extracted (Figure 13.3) such as the time to peak intensity (TPI), the peak intensity (PI), the mean transit time (MTT), the peak width (PW, full width at 90% of the maximum intensity and FWHM (full width at half the maximum intensity), the area under the curve (AUC), the positive gradient (PG, defined as PI/TPI) and the peak signal increase (PSI). These parameters can then be displayed as parametric images [19].
Schematic representation of different parameters of the time–intensity curve available for perfusion assessment. ROI = region of interest; IU = intensity units (linear scale); PI = peak intensity; PG = positive gradient; PSI = peak signal increase; PW = peak width; FWHM = full width at half the maximum intensity; AUC = area under the curve; MTT = mean transit time.
Several studies have shown that such parameters may be suitable for assessment of brain perfusion, particularly the analysis of local TICs in prespecified ROI [4] or the visual interpretation of parametric images [19–23]. MRI and PET studies in acute stroke patients have demonstrated the diagnostic value of TPI maps for differentiation between unaffected parenchyma, penumbra, and ischemic core area [24]. Similar results have been achieved with ultrasound perfusion techniques.
Destruction kinetics involves destruction of contrast agent microbubbles at a constant frame rate using a high MI. After contrast bolus injection, microbubbles are destroyed using a series of high-energy pulses. Local perfusion status is analyzed in selected regions of interest by destruction curves and acoustic intensity differences obtained before and after microbubble destruction [25,26]. There are three mathematical models for analyzing the diminution curve: a linear model, a simple exponential model and a complex exponential (contrast burst depletion imaging; CODIM) model [9,10,26,27]. Figure 13.4 provides an example of using microbubble destruction imaging (MDI) to assess cerebral perfusion in a patient with a high-grade carotid stenosis.
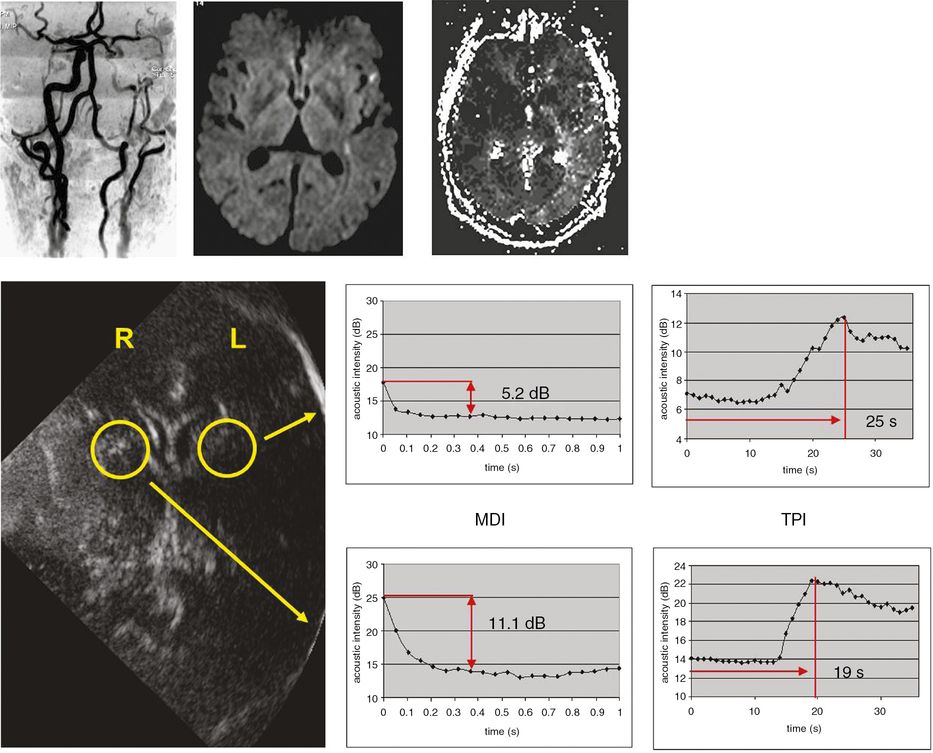
Investigation of symptomatic high-grade left carotid stenosis with time to peak intensity (TPI) and microbubble destruction imaging (MDI) using SonoVue®. The upper MRI images demonstrate the high-grade stenosis with MR angiography (left), left hemispheric diffusion-weighted imaging lesions (middle) and perfusion deficit in left hemisphere with perfusion-weighted imaging (right). For TPI, triggered imaging was used (frame rate 1 Hz) to measure time to maximum acoustic intensity. For destruction imaging repetitive sequences of high-energy pulses at high frame rate (14 Hz) resulting in complete microbubble destruction were applied. Analysis of TPI and MDI were undertaken in both hemispheres in the territory of the middle cerebral arteries (yellow circles). Note both prolonged TPI and decreased destruction intensities in left hemisphere.
High MI ultrasound pulses lead to microbubble destruction within the field of insonation. If a constant concentration of contrast agent is delivered to brain tissue using a constant UCA infusion rate, then after destruction with high MI ultrasound new microbubbles will enter this field with a certain velocity, will travel a determined distance and fill a certain tissue volume depending on blood velocity. The intensity of the echo response signal is directly related to the contrast agent concentration in the tissue, therefore the blood flow assessment is based on monitoring the intensity of the echo response signal of the insonated volume after bubble destruction. Low MI ultrasound imaging can be used to monitor microbubble replenishment in real time (Figure 13.5) following the application of destruction pulses at high MI. The behavior of the refill kinetics can be assessed with an exponential curve fit [28]. The parameters of this exponential curve are related to cerebral blood flow: blood flow velocity is directly related to the rate constant β, the fractional vascular volume is related to the plateau echo enhancement (A), and the product of both (A • β) is associated with blood flow. Using the flash replenishment mode of low MI contrast agent imaging, refill kinetics can be analyzed very quickly (<5 seconds scanning time) compared to the high MI approach (3 minutes’ scanning time).
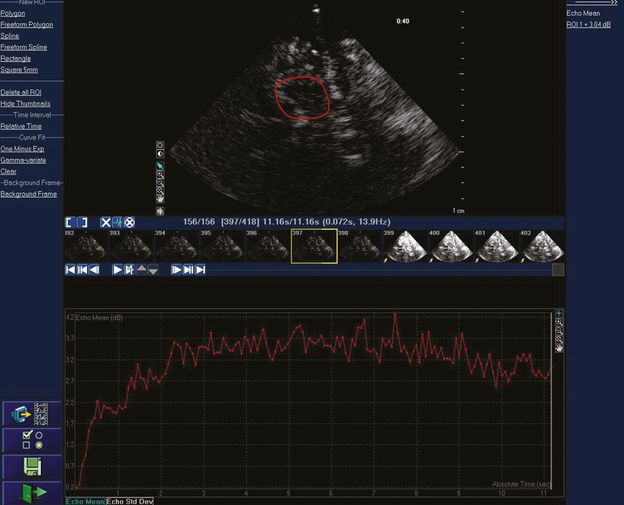
Real-time acoustic intensity curve of the contrast agent SonoVue® demonstrating refill following bubble destruction with transient high MI imaging. Mean acoustic intensity is measured in the region of interest in the upper image. The smaller images in the middle of the figure are the individual image frames at 14 Hz. The yellow arrow shows the first of a series of high MI images for microbubble destruction.
Focused questions
Which method should be implemented for assessing brain perfusion with ultrasound?
It remains unclear which kinetics or which parameter is the most valuable for the analysis of brain perfusion with ultrasound. Theoretically, time-dependent parameters like time to peak intensity (bolus kinetics), half-life perfusion coefficient (diminution kinetics) or the β-value (replenishment kinetics) should be more useful than amplitude dependent parameters, because the latter depend also on insonation depth and attenuation of the skull bone. Parametric images of certain properties of the TIC have been generated, which facilitate the evaluation of regional brain perfusion.
Two studies have reported perfusion-weighted MRI as a reference for ultrasound perfusion imaging (contrast burst and time variance imaging as well as high MI harmonic imaging) [14,29]. In both studies the time to peak intensity and in one study [29] the area under the TIC of ultrasound perfusion imaging showed a good correlation to the time to peak intensity as measured in perfusion-weighted MRI.
The most significant recent advancement in perfusion imaging is real-time refill kinetics. It is likely that after further studies have confirmed the validity of this measurement technique, it will emerge as the preferred method for assessing brain perfusion with ultrasound.
Is ultrasound perfusion imaging safe?
The commercially available ultrasound contrast agents Levovist®, Optison® and SonoVue® have been shown to have contrast-enhancing properties in human brain perfusion imaging. No severe adverse events have been documented in numerous volunteer studies published on brain perfusion analysis using these contrast agents, which have included hundreds of patients.
One study investigated the integrity of the blood–brain barrier (BBB) in humans after bubble destruction of Levovist® and Optison® with transcranial color-coded sonography [6]. MRI examinations with gadolinium (Gd-MRI) were performed during both early and late phases after insonation. Ultrasound transmission power levels were kept within diagnostic limits and resembled standard settings in brain perfusion studies. Using a triple dose of gadolinium to increase sensitivity and considering the potential time dependence of BBB changes, the authors showed that insonation of Levovist® and Optison® did not lead to any detectable difference in T1 signal intensities in two defined brain regions in Gd-MRI. Moreover, they found no signs of focal signal enhancement or focal brain damage. In another study on patients with small-vessel disease and intact BBB standard contrast-enhanced ultrasound perfusion imaging did not lead to MRI-detectable BBB changes [30]. These studies provide further evidence for the safety of ultrasound contrast agents and of the exposure levels of current ultrasonic equipment used for transcranial investigations. The results are reassuring but not totally conclusive in terms of ultrasound safety, since hypothetically more subtle effects of ultrasound and microbubbles on the BBB might be missed by Gd-MRI.
Experimental data also suggest that microbubbles and ultrasound have no deleterious effects in acute stroke. In one study [31], transcranial ultrasound was applied after experimental induction of intracranial hemorrhages (ICH) to rat brains for 30 minutes during a continuous intravenous infusion of SonoVue®. The results showed no significant effect of ultrasound and microbubbles on hemorrhage size, on the extent of brain edema or on the rate of apoptosis. In another study, ultrasound and microbubbles (SonoVue®) were applied in a middle cerebral artery (MCA) occlusion model in rats to evaluate possible effects upon brain infarct volume, apoptosis, interleukin 6 (IL-6) and tumor necrosis factor (TNF)-alpha levels, and disruption of the BBB [32]. Interestingly, the results show that infarct volume was significantly reduced in the microbubble and ultrasound group as compared to control animals. The levels of IL-6 and TNF-alpha concentrations, as markers of tissue damage, were not significantly different. In trypan blue-treated animals, no additional BBB disruption was observed. Likewise, there was no increase in apoptotic cell death outside the infarction area in animals treated with microbubbles and ultrasound. These results support the notion that ultrasound and microbubbles do not have a harmful effect upon ischemic stroke in MCA occlusion.
Imaging/measurement tips
Brain perfusion imaging in acute ischemic stroke patients
Ultrasound contrast agent (UCA) bolus kinetics was analyzed in most of the current perfusion imaging studies in acute ischemic stroke. Different nonlinear imaging modalities (harmonic imaging, power modulation, and pulse inversion imaging) with high MI triggering and different contrast agents (Levovist®, Optison® and SonoVue®) were used [3,4,20,22,25,33–41]. With more sensitive multipulse ultrasound technologies it is possible to analyze brain perfusion not only in the ipsilateral but also in the contralateral hemisphere within one investigation improving the geometry of the insonation plane and overcoming near-field artifacts [22,39]. When using this approach, additional artifacts (calcification of pineal gland and choroid plexus of lateral ventricles causing shadowing artifacts) have to be considered.
Ultrasound perfusion imaging can be performed as an emergency diagnostic procedure within a few minutes before starting thrombolytic therapy [42]. Different parameters of the (high MI) bolus kinetics curve acquired from ischemic brain regions in the hyperacute phase of ischemic stroke have been compared with the area of infarction in comparable imaging planes of a follow-up CT. A combination of signal peak intensity (PI) reduction compared to the surrounding (healthy) brain tissue and the relative delay of the time-to-peak (TTP) have proven to be most helpful in detecting the area of infarction, with a sensitivity between 75% and 86% as well as a specificity between 96% and 100% [4,38].
Several studies have evaluated color-coded parametric images [19,20]. These images provide information on the time–intensity data of all pixels under evaluation, thus facilitating the visualization and documentation of the perfusion state [19,22]. Although the supplying artery was found patent by color-coded duplex, in 13–14% of acute ischemic stroke patients a perfusion deficit in the MCA territory could be identified with parametric perfusion imaging [4,19]. The areas of disturbed perfusion on the parametric images (especially the PI image) correlate with the area of infarction in follow-up CT and the severity of stroke symptoms in the early phase as well as the outcome after 4 months [39]. In a pilot study, stroke MRI with diffusion-weighted imaging (DWI) and perfusion-weighted imaging (PWI) maps was used to validate the threshold of PI reduction and TTP delay for the diagnosis of a DWI or PWI lesion [40]. The results of this study showed that an area with isolated PWI delay (without DWI abnormalities = penumbra) could be separated from healthy tissue with parameters of the wash-in kinetics. For a peak signal with more than one-third of the amplitude of the healthy tissue and a delay of more than 4 seconds, isolated PWI delay without DWI abnormalities could be suspected.
Spatial resolution for the detection of infarction is a critical point for diagnostic sensitivity. In a study on thalamic infarction, lesion size below 2 cm was seldom diagnosed using phase inversion harmonic imaging [41]. Another critical point in detection of perfusion deficits in acute ischemic stroke is the time window for detection. A study on ischemic stroke patients in the acute (<12 hours) and subacute (>28 hours) phase showed that the detection rate of lesions decreases by time [21]. Reperfusion phenomena may impair the diagnostic impact in later examination.
Beside contrast bolus kinetics, diminution kinetics after bolus injection of SonoVue® was evaluated in the early phase of ischemic stroke (<24 hours) and compared with perfusion MRI [25]. This pilot study showed the diagnostic potential of this fast imaging technique to obtain information on regions of reduced perfusion in the early phase of ischemic stroke.
A few studies have examined ultrasound perfusion imaging in patients after hemicraniectomy [33,35,43]. In these studies, Doppler-based nonlinear imaging technologies with higher receiving frequencies seem to be superior to gray-scale harmonic imaging. In theory, when using high MI imaging, direct contrast-enhanced insonation of the brain without the skull (which reduces the actual energy that has an effect on the tissue) could be harmful because of cavitation and capillary rupture [44,45,46].
First reports on the use of low MI, real-time perfusion imaging in stroke patients showed that measurement of real-time refill kinetics is feasible in patients with sufficient insonation conditions. These analyses revealed lower rise rates in ischemic tissue as compared to contralateral normal brain [28]. Moreover, the plateau of acoustic intensity A and the product of A and β as a measure of blood flow also showed significantly lower values in ischemic tissue. Findings corresponded well with MRI-derived regional cerebral blood flow maps. A recent study showed that real-time ultrasound perfusion imaging can detect hemodynamic impairment in acute MCA occlusion and subsequent improvement following arterial recanalization. The delay of real-time TTP was reversible and the refill parameter beta showed a greater slope once recanalization of an underlying MCA obstruction was demonstrated [47]. These results provide a new opportunity for bedside monitoring of hemodynamic compromise (e.g., during therapeutic interventions such as systemic thrombolysis).
Related posts:

Stay updated, free articles. Join our Telegram channel

Full access? Get Clinical Tree


