Brainstem Auditory Evoked Potentials (BAEPs) and Other Auditory Evoked Potentials


Brainstem Auditory Evoked Potentials (BAEPs) and Other Auditory Evoked Potentials


Gastone G. Celesia


INTRODUCTION

Evoked potentials (EPs) after an auditory stimulus have been recorded directly from the human cortex (1, 2, 3, 4, 5 and 6), the brainstem (7,8), the eighth nerve (9, 10, 11 and 12), the cochlea (12,13), and the scalp. The need to study objectively and noninvasively the function of the auditory system, specifically the cochlea-auditory nerve-brainstem pathways, resulted in an extensive development of scalp recording of both near- and far-field potentials. It is customary to subdivide the auditory evoked responses into different classes in relation to their latencies (14, 15 and 16). Early or short-latency auditory EPs (AEPs) refer to the EPs occurring during the first 10 to 12 msec after an auditory stimulus, whereas evoked responses occurring between 12 and 50 msec are referred to as middle-latency EPs, and responses occurring 50 msec or more after the stimulus are referred to as slow or late EPs (Table 47.1).

We will briefly review the functional organization of the human auditory system and then proceed to review AEPs with particular emphasis on the clinical usefulness of the early potentials that have stood the test of time (15, 16 and 17).


FUNCTIONAL ORGANIZATION OF THE HUMAN AUDITORY SYSTEM

Sound waves travel via the external auditory canal to the tympanic membrane, where they produce changes in air pressure and displacement of the tympanic membrane. Displacements of the tympanic membrane are transmitted via the ossicular chain (malleus, incus, and stapes) to the oval window of the cochlea. The tympanic membrane and ossicular chain are not just passive transmitters of movements; together, they function as an acoustic transformer, permitting efficient conversion of motion from the middle ear to the cochlear liquid (18, 19 and 20).

The cochlea contains an epithelial tube, the cochlear duct, filled with endolymph. The endolymph is suspended within another fluid-filled space, the perilymphatic space, which is a spiral tube closed at one end by the footplate of the stapes in the oval window and at the other end by the round window. It is continuous with the vestibular labyrinth and the cerebrospinal fluid and contains perilymph. Vibration or displacement of the stapedial footplate at the oval window changes the pressure in the perilymphatic space. The cochlea is subdivided into two connected compartments by the cochlear duct. The space above the duct is called the scala vestibuli, and the space below the duct the scala tympani. Within the cochlear duct are the basilar membrane and the organ of Corti. Vibrations transmitted by the stapedial footplate are transformed into a traveling wave at the basilar membrane. The envelope of the vibrations reaches maximum displacement at a particular point along the cochlear duct; high frequencies produce maximum displacement at the base of the cochlea, whereas low frequencies produce maximum displacement toward the apex (21). The organ of Corti contains sensory cells: inner and outer hair cells that carry cilia of graded length. The longest cilia in each cell are embedded in the tectorial membrane. When the basilar membrane vibrates, hair cell cilia bend against the tectorial membrane or are perturbed by the endolymph displacement. Somehow this perturbation, although not completely understood, produces electrical depolarization of the hair cells (receptor potential).

The inner hair cells are in contact with afferent nerve fibers originating in the spiral ganglion cells. The fibers originating in the spiral ganglion form the cochlear nerve. A separate set of spiral ganglion fibers innervates the outer hair cells. It has been shown that the more intense the stimulation, the larger the number of hair cells excited and the more cochlear nerve fibers firing. Information about stimulus frequency and amplitude is transmitted to the central nervous system (CNS) via cochlear nerve discharge patterns.

The first-order afferents of the auditory system are spiral ganglion cells, the central processes of which form the auditory portion of the eighth nerve. The auditory nerve compound action potential (AP or N1) represents the close synchronization of nerve impulses within the auditory nerve fibers. The fibers of the auditory nerve terminate in the ipsilateral, ventral, and dorsal cochlear nuclei of the medulla. From the cochlear nuclei the pathways toward the cortex are multiple and project to ipsilateral and contralateral superior olivary complex of the medulla/pons and to the inferior colliculi. Commissural auditory fibers in the pons are clustered in the trapezoid body; from the cochlear nuclei to the Heschl’s gyrus there are five major auditory nuclei: superior olivary nuclei, trapezoid body nuclei, nuclei of the lateral lemniscus (LL), inferior colliculi, and the medial geniculate bodies. The medial geniculate body projects directly to the primary auditory cortex, located in the “Heschl” gyri of the temporal lobe. Although the predominant projections are contralateral, there are considerable ipsilateral
connections; thus, each brainstem nucleus as well as the cortex has an input from both ears. As shown in Figure 47.1, this functional organization has been demonstrated in humans with recording of EPs during surgical procedures for the treatment of intractable epilepsy (1, 2 and 3).


Table 47.1 Classification of Auditory Evoked Potentials According to Latency


Type


Latency (msec)


Terminology


Presumed Source


Early


<12


EcochG


1-4


Cochlear microphonic


AC component receptor potential—cochlear hair cells


Summating potential


DC component receptor potential—cochlear hair cells


N1 or AP


Auditory nerve compound action potential I-auditory nerve action potential


BAEPs or ABR


1-12


Waves I to V


II-V brainstema


Middle


12-50


Transient


Na (N20), Pa (P30)


Myogenic vs. neurogenic source


Steady state


40-Hz, AEP


Slow or late


>50


Late


50-250


N100, P150, N200


Cortical


Long


>250


P300, CNV


Cortical


ABR, auditory brain response; BAEP, brainstem auditory evoked potential; ECochG, electrocochleogram.


a See text for details.


The tonotopic organization of the cochlea is maintained throughout most of the auditory pathways, and has been demonstrated to be represented in the human primary auditory cortex (22). Electrophysiologic recording of EPs during surgical procedures for the treatment of medically intractable epilepsy has shown that the primary auditory cortex is located in a small area of the “Heschl” gyri and is surrounded by other auditory areas located in the planum temporale and in the superior temporal gyrus (1, 2, 3, 4, 5 and 6,22). These findings have been confirmed in normal subjects by fMRI (22); there are now at least five auditory cortical areas with documented functional interconnections (6,22). The functions of these areas are not known; similarly we have a poor understanding of the relationship among the sensory auditory cortical areas and other cortical regions involved in language and cognition.


EARLY AUDITORY EVOKED POTENTIALS OR SHORT-LATENCY AUDITORY EVOKED POTENTIALS

Early AEPs have also been referred to as short-latency AEPs and correspond to the responses recorded within the first 12 msec after an auditory stimulus. Responses recorded from the external auditory meatus or the tympanic membrane and occurring within the first 2.5 msec after a stimulus are referred to as the electrocochleogram (ECochG) because they reflect receptor potentials generated in the cochlea and auditory nerve. The responses recorded from the vertex to the mastoid or earlobe and occurring from 1 to 12 msec are referred to as brainstem auditory evoked potentials (BAEPs) or auditory brain responses (ABRs). Although it is possible to record the two types of responses simultaneously, for the sake of clarity they are described separately.


ELECTROCOCHLEOGRAM

The ECochG is recorded with a needle electrode positioned near the round window (transtympanic ECochG) or a ball electrode placed in the external auditory meatus (extratympanic ECochG) and referred to a second more distant electrode (23, 24, 25, 26, 27 and 28) positioned at either the vertex or the midline frontal area. Noninvasive silver ball electrodes placed 2 to 4 mm from the tympanic membrane are preferred for recording ECochG at the present time (23,24). Broadband clicks or tone bursts of specific frequencies can be used to elicit an ECochG. As shown in Figure 47.2, the ECochG consists of three components: the cochlear microphonic (CM) potential, the summating potential (SP), and the AP or N1. Procedures for separating and enhancing the various components have been described (23). The CM consists of bursts of high-frequency electrical oscillations of alternating polarity, usually lasting 2 msec or longer. The SP is a negative potential arising from the baseline and followed

abruptly by a larger negative wave, the AP or N1 potential. The CM represents (Table 47.1) the alternating current (AC) component of the hair cell receptor potential (29, 30 and 31), or the fluid pressure (condensation and rarefaction) produced in the cochlear fluid by sound-induced stapes footplate vibrations (32); SP represents the direct current (DC) potentials mostly from inner hair cells of the organ of Corti of the basal portion of the cochlea with some contribution from the outer inner hair cells (27,30,31). The AP represents the action potential of the auditory nerve and therefore is the same potential as Wave I of the BAEPs. AP (N1) is usually larger than the BAEPs Wave I, because of the methodology of recording the potentials closer to the nerve at the tympanic membrane. Thus, ECochG is employed when less than optimal recording conditions were used to obtain Wave I of the BAEPs (27). ECochG recording can assess the functional integrity of the cochlea and the auditory nerve and in diseases affecting the hearing system determine what is the contribution of each of these structures to the patient deficit (27,28,33, 34, 35 and 36).


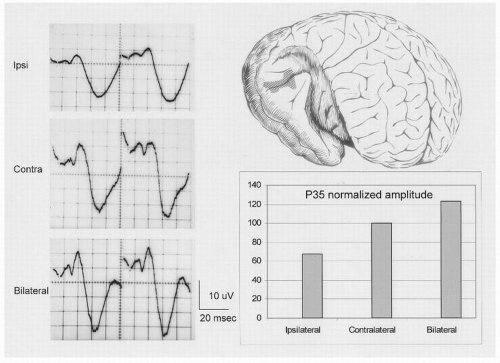
Figure 47.1 Auditory evoked responses recorded directly from the human cortex (area in hatching in the brain drawing on the upper right of the figure) exposed during temporal lobectomy for the treatment of medically intractable epilepsy. Responses from monocular stimulation of the ipsilateral ear are smaller than responses from stimulation of the contralateral ear. Bilateral ear stimulation results in the highest amplitude responses. Each potential is the average of 64 responses; positive deflections are downward. The evoked responses are shown on the left half of the figure; on the right half is a bar graph of the amplitude of the P35 to the three different stimuli.


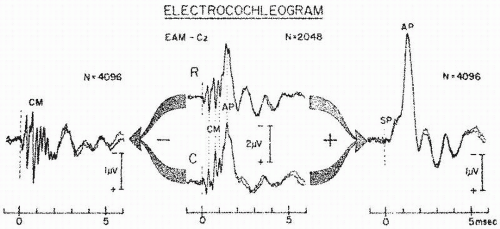
Figure 47.2 Electrocochleogram elicited by exclusively rarefaction (R) or condensation (C) clicks (middle section) are composites of CM, SP, and AP potentials. Dotted line emphasizes reversal of CM polarity and lack of AP polarity reversal when stimulus phase is inverted. SP polarity behaves similarly to that of AP. Algebraically subtracting C from R ECochGs results in summation of CM and cancellation of most of the SP and AP (left), whereas adding C to R ECochGs results in summation of SP and AP and cancellation of most CM (right). (From Chatrian G, Wirch AL, Lettich K, et al. Click-evoked human electrocochleogram. Noninvasive recording method, origin and physiologic significance. Am J EEG Technol. 1982;22:151-174.)

Objective audiometry with frequency-specific tone bursts has been performed with ECochG. The marker has been the AP response, and threshold to tone bursts of 500, 1000, 2000, 4000, and 8000 Hz corresponding to the subjective audiometry have been obtained (37). The correlation between subjective and ECochG audiogram is excellent, with mean differences of about 0 to 5 dB between the two methods. On the other hand, ECochG thresholds determined with broadband clicks do not permit reliable estimation of the audiogram (38). The best correspondence between click threshold and audiometry is for 2 and 4 kHz. The use of clicks for both ECochG and BAEPs allows the estimation of hearing loss levels equal to or greater than 2 kHz. Small localized regions of hearing loss or low-frequency hearing loss will be missed (39). ECochG has been useful in the study of cochlear function as well as in the study of the auditory nerve. As the CM and the SPs reflect the function of the receptor potentials, they are useful in studying cochlear function.

In Ménière disease, SPs are often abnormal with greatly increased amplitude (<0.7 mV) or/and elevated SP:AP ratio (27,35,36), and at times, a prolonged action potential latency shift (35). Ghosh et al. (39) recorded transtympanic and extratympanic ECochG in 20 controls and 20 patients with Ménière disease. They used 0.29 as a cutoff for SP/AP abnormality. The transtympanic method yielded a sensitivity of 100% and a specificity of 90%, whereas the extratympanic method showed corresponding values of 90% and 80%, respectively. They concluded that extratympanic ECochG was an effective test for the diagnosis of Ménière (39). Chung et al. (36) similarly report that in 150 cases of Ménière disease the extratympanic ECochG sensitivity was 71% and the specificity 96%. An absent or reversed SP in Ménière disease or sudden deafness suggests a poor prognosis for recovery of the lost hearing (39,40). Camilleri and Howarth (41) studied 70 patients with severe Ménière disease to determine if electrocochleography (ECoG) could predict the patients who would be free of vertigo, 2 and 5 years after surgery. At 5 years, 5/8 (63%) patients with normal ECoG were relieved of dizziness compared to 30/30 (100%) with abnormal ECoG (P < 0.001). They concluded that patients with a normal ECoG will be less likely to benefit from saccus surgery.

Abnormalities of SP have also been demonstrated in other hearing disorders such as hearing loss associated with X-linked hypophosphatemic osteomalacia, auditory neuropathy, hearingimpaired children with GJB2 mutation, cochlear damage related to neurotoxins, and other causes of sensorineural hearing loss (27,28,30,33,34,42,43). In auditory neuropathy Santarelli et al. (43) have demonstrated that CM receptor potentials were either normal or of enhanced amplitude while SP receptor potentials were of normal amplitude while the AP were either normal, absent, or broader and smaller (Fig. 47.3). The authors interpreted the prolonged SP-AP complex as related to temporal dispersion of neuronal activity at postsynaptic level. The presence of normal SP but absent AP in some patients was interpreted as indicative of a presynaptic disorder of the inner hair cells (43). They concluded that ECoG may help identify pre- and postsynaptic disorders of inner hair cells and auditory nerve (43).

In summary ECoG is most useful: (i) in diagnosis and assessment of Ménière disease/endolymphatic hydrops as well as in monitoring treatment for these disorders; (ii) in assessing the function of the cochlea and auditory nerve in patients with sensorineural hearing loss; (iii) in intraoperative monitoring during procedures involving the auditory periphery (27,28). This third use of ECoG will be discussed later in the chapter.


BRAINSTEM AUDITORY EVOKED POTENTIALS (BAEPS) OR AUDITORY BRAINSTEM RESPONSES (ABRS)

BAEPs are a set of seven positive waves recorded from the scalp during the first 12 msec following a click (44,45). They represent far-field potentials originating in the brainstem and are labeled I to VII (Fig. 47.4). BEAPs are the tools most frequently used to study the functional integrity of the central auditory pathways.


Origin of BAEPs

The source of BAEP waves is only partially known (7, 8 and 9,11, 44, 45, 46, 47, 48 and 49,). It is now acknowledged that far-field potentials are derived from three possible sources (Table 47.2): afferent volleys (all-or-none action potentials), graded postsynaptic potentials, and changes in the current flow within the surrounding volume conductor. The initial hypothesis, based on the correspondence between human and animal BAEPs and on the time relationship between Waves I and V and responses recorded directly from different nuclear regions, suggested that BAEPs arose from multiple generators activated sequentially within the brainstem auditory pathways. The demonstration that intracranial recordings around the inferior colliculus have responses with longer latencies than Wave V (46, 47, 48 and 49) and that auditory nerve responses have longer propagation times than previously suspected (7,9 and 10,48,49), together with a study of BAEPs scalp distribution and analysis using a spatiotemporal dipole model, has suggested that BAEPs may have multiple generators with nonsequential interaction among second-order axons and thirdorder ipsilateral and contralateral axons and neuronal cells (50).


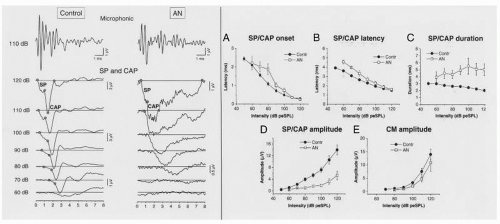
Figure 47.3 The left half of the figure represents the receptor potentials (CM and SP) and compound action potentials (CAP) obtained from both a control and one auditory neuropathy (AN) patient. The upper panel reports the cochlear microphonics recorded at 110 dB pe SPL at the same gain in control and AN subject. The lower panel reports the CAP with the superimposed SP at decreasing stimulation intensities from 120 to 60 dB pe SPL. Note the decrease in amplitude and the broadening in duration of the neural response obtained from AN subject compared to control. At threshold, the ECochG potentials from both AN and control have similar form. The right half of the figure represents the means and standard errors of SP/CAP onset (A), peak latency (B), duration (C), peak amplitude (D), and CM amplitude (E) for controls (filled circles) and AN subjects (open squares). There are significant differences between the two groups for SP/CAP peal latency, duration and peak amplitude. (Modified from Santarelli R, Starr A, Michalewski HJ, et al. Neural and receptor cochlear potentials obtained by transtympanic electrocochleography in auditory neuropathy. Clin Neurophysiol. 2008;119:1028-1041.)

Wave I is a negative wave (seen as a positive wave at the vertex) recorded at the ear being stimulated and reflecting eighth nerve activity. Recording in humans (9, 10 and 11), and studies of dipole sources (50) suggest that Wave I reflects the action potential of the distal portion of the acoustic nerve near the cochlea. Buchwald (51), on the other hand, asserts that Wave I represents graded potentials in dendritic terminals of the acoustic nerve in the mammalian cochlea. Whether or not Wave I is an action potential or a graded dendritic potential, it nevertheless reflects activity at the distal end of the eighth nerve.


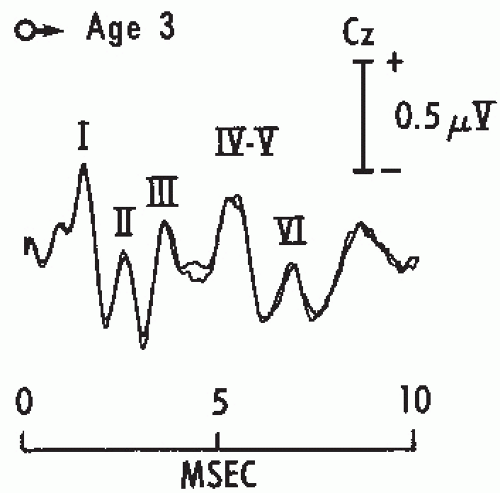
Figure 47.4 Brainstem auditory evoked potentials (BAEPs) in a normal child age 3. Two tracings were superimposed to show reproducibility of the responses. Recording was between Cz and the ipsilateral ear. Click intensity was 110 dB SPL. Note that Waves IV and V are fused together in a single complex.

The origin of Wave II has been related to postsynaptic potentials in the cochlear nucleus in the brainstem (44,51,52). However, recordings from the auditory nerve in humans during surgery showed that the action potential of the intracranial portion of the eighth nerve close to the brainstem corresponded to Wave II (47, 48 and 49,53), suggesting that Wave II is generated in the proximal portion of the auditory nerve. Scherg and von Cramon (50) suggest that Wave II may actually represent changes in current flow due to the auditory nerve transition from within the skull into the posterior fossa. Current flux asymmetry is generated as the auditory action potential crosses the boundary between the temporal bone and the brainstem (54). Perhaps Wave II may represent the summation of more than one generator (55).

Wave III is thought to represent potentials evoked within the superior olivary complex and trapezoid body (44,45,51,52). Patients with hereditary motor-sensory neuropathy have shown delayed Waves I and II but normal Waves III to V; conversely, patients with pontine hemorrhages sparing the superior olivary nucleus have normal Waves I, II, and III (17,56). Data on the dipole sources (50) suggest that Wave III represents the
interaction of two dipoles, one originating in the ventral cochlear nucleus and the other in the ipsi- and contralateral trapezoid body and superior olivary complex. These data suggest that the origin of Wave III is within the brainstem (57).


Table 47.2 Origin of BAEP Waves


Wave


Generator


I


Compound action potential recorded from the distal end of the acoustic nerve or graded potential of dendritic terminals of acoustic nerve


II


Changes in current flow at the poms acusticus internus, or compound action potential of the auditory nerve at the entrance into the brainstem, or graded potentials from cochlear nucleus


III


Cochlear nucleus and trapezoid body or superior olivary complex and trapezoid body


IV


Lateral lemniscus, ventral lemniscus cells, or superior olivary complex or ascending auditory fibers in the pons


V


Ventrolateral inferior colliculus and ventral lateral lemniscus


VI, VII


Higher brainstem structures (medical geniculate body?)


The origins of Waves IV and V are still under some debate. Animal data show that Wave IV is not affected by destruction of either the inferior colliculi or the superior olivary complex, whereas lesions of the LL profoundly affect Wave IV (51,58). It is unclear, however, whether Wave IV represents postsynaptic potentials in the LL, action potentials from lemniscal fibers, or a combination of the two. Wave V was initially believed to originate in the inferior collicular region (44,45,51), but direct recording from the human inferior colliculus has shown potentials with latencies longer than Wave V (46,47,49). These authors therefore suggest that Wave V is generated in the LL. Studies of dipole models suggest a close interaction between Waves IV and V, with Wave V receiving contributions from the ipsi- and contralateral superior olivary complexes and lateral lemnisci.

The sources of Waves VI and VII are even less clear. There is speculation that they may originate in the medial geniculate body above the colliculi.

Although it is not possible at this time to absolutely locate the source of each BAEP wave, the knowledge that the first wave is generated in the eighth nerve and that Waves III to V are generated in the brainstem is sufficient for clinical applications, as will be demonstrated in the next few pages.

The diagnostic power of BAEPs relies on I to V interpeak latency, which represents brainstem transmission time and therefore brainstem auditory processing.


Normative Data

The widespread application of BAEP recording in clinical practice has led to concern not only about misuse and overuse of the test, but also about its quality and standardization (59, 60 and 61). These issues were addressed in the American Clinical Neurophysiology Society’s Guidelines on Short-latency Auditory Evoked (62). These guidelines mandate clinicians to adhere to rigorous quality control standards when using BAEPs to assist in the diagnosis of otologic or neurologic disorders.

BAEPs vary considerably in relation to changing auditory stimulus parameters (63, 64, 65, 66, 67, 68, 69, 70 and 71). Each acoustic stimulus can be broken down into three primary components: frequency, intensity, and time. Frequency refers to the spectrum of sound in hertz (Hz) and relates to the location of physical stimulation along the basilar membrane of the cochlea and along the tonotopic representation of the central auditory pathways. Intensity refers to the loudness of the stimulus and is expressed in decibels (dB) relative to a reference. Time includes duration, rise-fall time, repetition rate, and phase of onset of the stimulus. Clicks represent very short acoustic waves, with the first wave usually more prominent than the others. They are usually generated by a square wave electrical pulse and consist of mixed spectral frequencies. Each tone has a specific frequency (e.g., a 1000- or 2000-Hz tone burst) with a rising time (the time before the stimulus reaches a plateau), a stable plateau, and a decay or fall time to the baseline. The duration of the stimulus is measured in either microseconds (µsec) or milliseconds (msec). The phase of onset refers to the initial direction of the mechanical displacement of the basilar membrane of the cochlea. A click’s phase of onset is referred to as polarity and defined according to the pressure that the first acoustic wave applies to the tympanic membrane. Positive pressure is referred to as condensation, and negative pressure as rarefaction (66,68,70).

The intensity of an acoustic stimulus is measured in three ways: hearing level (HL), sensation level (SL), and sound pressure level (SPL). HL is defined as the average threshold in decibels of a group of normal adults tested in the same laboratory under the identical conditions used to record BAEPs. SL indicates the subject’s individual threshold and is measured just before BAEP recording begins. The American Clinical Neurophysiology Society (62) recommends that acoustic stimuli be calibrated in decibels peak equivalent sound pressure level (dB pe SPL). SPL measurements use as a reference level a physical standard of 20 µPa. Although this is the most reliable method currently available, it depends on the click’s acoustic waveform with possible measurement errors of 3 to 9 dB (72). In spite of this pitfall, measurements of click intensity in dB/SPL provide better interlaboratory comparability than dB HL or dB SL (23,62).

Standardized recording techniques are also important in obtaining reproducible BAEPs (62). Recording electrodes should be placed over the vertex, the right and left earlobes (A1 and A2), or the right and left mastoid processes (M1 and M2). The vertex electrode is referred to the ipsilateral earlobe (or mastoid), as well as the contralateral ear (or mastoid). Simultaneous
recordings to ipsi- and contralateral derivations are recommended to improve wave detection. Wave I (Fig. 47.5) is selectively attenuated in contralateral derivation, whereas Waves IV and V are separated better in contralateral than in ipsilateral recordings (73,74). The best way to obtain a large Wave I is to utilize a ball electrode placed in the external auditory canal (extratympanic electrode referred to the vertex [Fig. 47.6]); in this fashion it is feasible to simultaneously record ECochG and BAEPs.


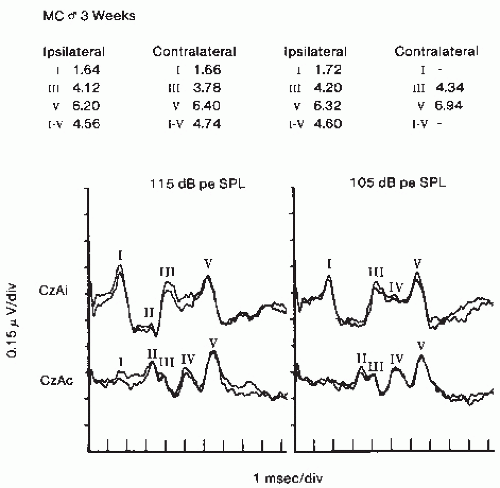
Figure 47.5 Brainstem auditory evoked potentials (BAEPs) in a 3-week-old boy. Note the greater amplitude of Wave I from ipsilateral recording but better definition of Wave IV in contralateral recording. CZ, vertex; Ai, ipsilateral earlobe; Ac, contralateral earlobe. Responses on the left half of the figure were to clicks of 115 dB SPL; responses on the right half of the figure were to clicks of 105 dB SPL.


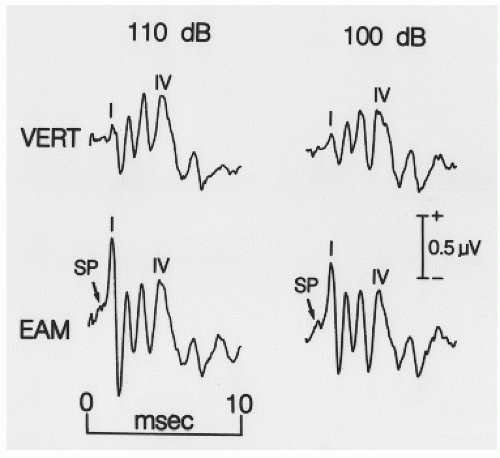
Figure 47.6 Simultaneous recordings of evoked potentials to monoaural clicks at 110 and 100 dB pe SPL. VERT indicates recordings from ipsilateral mastoid electrode referred to Cz; EAM indicates recordings from ipsilateral extratympanic electrode referred to Cz. Note that the recording from EAM shows a larger Wave I and also the summating potential (SP) of ECochG.

Amplification is variable but on the order of 105, with frequency cutoffs of 100 and 3000 Hz. A total of 2000 sweeps of 10-msec duration are averaged at least twice to ensure reproducibility. The stimulus used in BAEP recording is usually a broadband click generated by a 100-microsecond rectangular pulse, delivered monaurally. Contralateral masking with 60 dB/SPL white noise is recommended to avoid crossover responses (i.e., responses originating from bone-conducted stimulation of the contralateral ear).

BAEPs are relatively independent of consciousness and resistant to drugs, especially sedatives (17,75, 76, 77, 78 and 79). However, age, sex, intensity, and rate may affect the latency and amplitude of these potentials (15,17,68,70,75,79, 80, 81 and 82).

The acoustic phase of the click affects BAEP latency. Rarefaction clicks evoke shorter latency waves I and V (12,68,70,83,84), although these changes vary considerably among subjects (84). Phase effect is further increased in patients with high-frequency hearing loss, in whom condensation and rarefaction may produce out-of phase responses that can cancel each other when algebraically combined (12,83,84). In view of these effects, rarefaction clicks are now generally recommended.

Click presentation rate is another variable that must be considered (75, 76, 77, 78 and 79,85). Allen and Starr (85) have shown increased Wave V latency associated with increases from 10 to 30 to 50 clicks/sec.

BAEP latencies decrease in quasi-linear manner with increasing stimulus intensities (63,86). Both Waves I and V latencies increase as intensity decreases, whereas the I to V interpeak interval remains essentially unchanged (Fig. 47.7). Normative values, therefore, vary relative to stimulus intensity; the relationship between the two is referred to as the latencyintensity function and is summarized in a graph (Fig. 47.8).

The utilization of latency-intensity functions rather than the study of BAEPs to a single-intensity click increases the power of the test (12,42,63). Comparing the subject’s latency-intensity functions with normal standards permits detection of conductive, cochlear, and retrocochlear dysfunctions (12,43,63,86).

Age is another important variable affecting BAEPs. In prematures and newborns, Waves II, IV, and VI are less well defined than Waves I and V, and the I to V interpeak interval is longer than in adults (87, 88 and 89). There is an approximate 0.2 msec/week decrease in Wave V latency at 26 to 40 weeks gestational age. After the neonatal period, latencies decrease more slowly, reaching adult values by 1 year of age (80, 81 and 82,87, 88 and 89). BAEP values also change, although less dramatically, with advancing age; latency increases gradually as the individual grows older (80, 81 and 82,90). Allison et al. (91) reported a change in Wave V of 0.0072 msec/year for males and a change of 0.0040 msec/year for females. Similarly, Rosenhall et al. (82) found increased latency with increasing age in Waves I, III, and V, but noted that the I to V interval was equal in all age groups. Chu (92), on the other hand, reported a small increase of the I to V interval with age. It is therefore unclear whether or not central auditory conduction time increases significantly with age. It is agreed that most of the changes that do occur are related to an increase in Wave I, which may be related to age-related mechanical and neuronal changes in the cochlea (93, 94 and 95). Nelson and Hinojosa (93) reported degeneration of the stria vascularis, spiral ganglion
cells, inner hair cells, and outer hair cells in 21 humans with presbycusis and noted that the extent of degeneration was associated with the severity of hearing loss. The possibility that some changes in the central auditory pathways contribute to the age-related delays of BAEPs cannot be entirely excluded. There have been reports of reductions in the number of neurons in the cochlear nucleus in aged humans (96,97). Gender also influences the various BAEP waves; there are consistently shorter latencies in females (73,80,81,92). Male-female differences are attributed to different body and brain size.


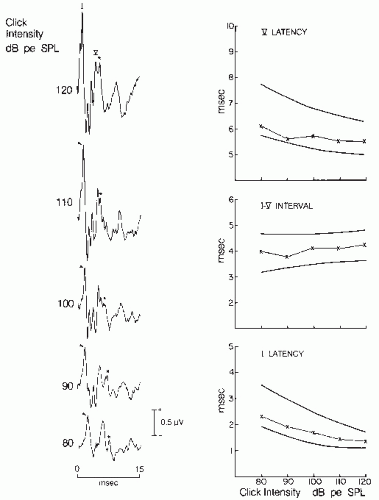
Figure 47.7 Brainstem auditory evoked potentials (BAEPs) in a normal 32-year-old woman. Results to monaural stimulation of the left ear. Recordings were obtained with a plastic-leaf silver electrode placed in the external auditory meatus and referred to the vertex. BAEPs to clicks of decreasing intensity are illustrated (left). Waves I and V are labeled and tagged with an arrow and an asterisk. Note the SP response preceding Wave I. The latency-intensity functions of Waves I and V, and I to V interval are shown (right). The thick lines represent the boundary of normal. Note that the value of the subject marked by an X is well within the normal range. pe, peak equivalent; SPL, sound pressure level.


Clinical Applications

BAEPs are effective in evaluating the integrity of the peripheral and central auditory pathways. There is general agreement that BAEPs are useful for (i) hearing assessment in infants and small children, (ii) determining hearing loss in uncooperative adult patients, (iii) evaluating hearing in functional deafness, (iv) evaluating brainstem function in multiple sclerosis (MS), and other neuro-otologic disorders (acoustic neuromas, cerebellopontine angle (CPA) tumors, and brainstem lesions), (v) evaluating potential ototoxicity of drugs, and (vi) monitoring the function of the auditory pathway during surgical procedures that may be complicated by damage of the cochlea or auditory nerve and cause deafness.


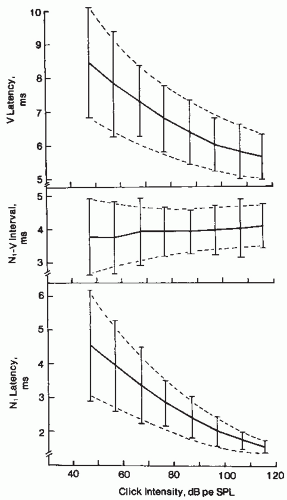
Figure 47.8 Latency-intensity curves from 23 normal-hearing ears showing means (solid lines) and ±2 standard deviation limits (crossbar). Dashed lines show estimated normal ranges. (From Coats A. Human auditory nerve action potentials and brain-stem evoked responses latency/intensity functions in detection of cochlear and retrocochlear pathology. Arch Otolaryngol. 1978;105:709-717.)

BAEP interpretation requires identification and measurement of Waves I, III, and V and the measurement of I to V and I to III interpeak intervals. These values should then be compared with the normal values for the patient’s age and sex (12,23,62,63). Interpretation should be cautious; some practical rules should be followed. First, absence of Wave I with normal Wave V probably reflects technical problems in recording. The use of an external auditory meatus electrode referred to the
vertex in such cases usually reveals a normal Wave I. Second, absence of Wave III is significant only when Wave V is also missing or delayed. Third, BAEPs cannot be interpreted without considering the patient’s hearing status; conductive hearing loss and cochlear pathology may profoundly affect BAEP wave latency and amplitude (12,23,63,86).


Diagnostic Role of BAEPs in Adults

The utilization of latency-intensity functions permits differentiation of four types of pathologies:


  • Latency-intensity functions indicating conductive hearing loss (Fig. 47.9).

    The functions are characterized by prolonged Waves I and V with latency-intensity curves parallel to the normal curve. The I to V and I to III intervals are normal.


  • Latency-intensity functions indicating cochlear hearing loss (Fig. 47.9).

    This type of abnormality accompanies high-frequency hearing loss of cochlear origin. It is characterized by a recruiting curve for Wave I, that is, normal or mildly prolonged Wave I latencies with loud clicks and greater delays with decreased intensity, resulting in a steep curve. Wave V is not drastically affected, and its curve is less steep, resulting in a shortened I to V interval.


  • Latency-intensity functions indicating retrocochlear deficit Type I (Fig. 47.10).

    Wave I is prolonged with a steep latency-intensity function; since Wave V is prolonged, the I to V interval is prolonged. This type of abnormality has been reported in lesions affecting the eighth nerve.


  • Latency-intensity functions indicating retrocochlear deficit Type II (Fig. 47.10).


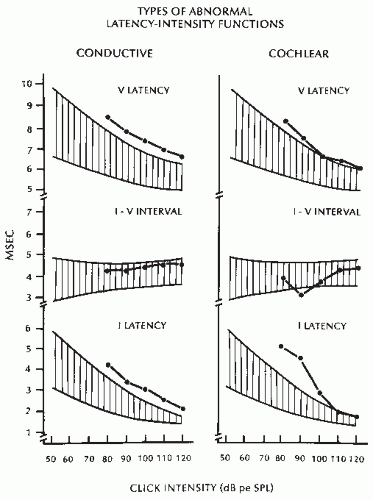
Figure 47.9 Latency-intensity functions in conductive and cochlear hearing loss. The hatched area represents the boundary of normality. The line connecting the dots represents the latency-intensity function for the two types of abnormalities. (See text for details.)


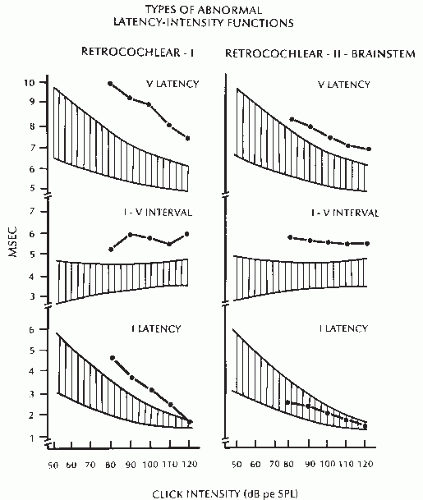
Figure 47.10 Two types of latency-intensity functions in retrocochlear dysfunction. (See text for details.)

The Wave I latency-intensity curve is normal. Wave V and the I to V interpeak interval are prolonged. The latency-intensity function of Wave V and the I to V interval is variable. A delayed Wave V with normal Wave I latency signifies that the delay has occurred somewhere after Wave I (i.e., central to the auditory nerve). A variation of this type of abnormal BAEP is characterized by normal Wave I and absence of succeeding waves. Selective elimination of specific waves may help localize the pathology. Absence of all waves suggests a deficit involving the cochlea or the eighth nerve (Fig. 47.11). Preservation of Wave I with elimination of all later peaks indicates total functional destruction of the brainstem (98, 99 and 100) and has been observed in cerebral death (Fig. 47.12).

In more limited brainstem lesions, Waves I, II, and III may be preserved while Waves IV and V are either absent or prolonged. The most sensitive indicator of brainstem pathology is prolongation of the I to V interpeak interval. Further localization in these cases may be achieved by analyzing the I to III and III to V intervals (Fig. 47.13). Prolongation of the III to V interval alone
indicates a deficit at or after the superior olivary complex, in either the high pons or the low midbrain (17,98, 99 and 100). This detailed interpretation is based on two assumptions—that each BAEP wave is generated in a known neuronal location and that detailed identification of a lesion within brainstem structures is important in diagnosis and management of neurologic disorders—neither of which is correct. There is no consensus on the origin of BAEPs. Furthermore, the clinician is interested only in whether the lesion is intra-axial (within the brainstem) or extra-axial (in the VIII nerve). BAEPs cannot specify the nature of the lesion but only the type and approximate location of dysfunction.


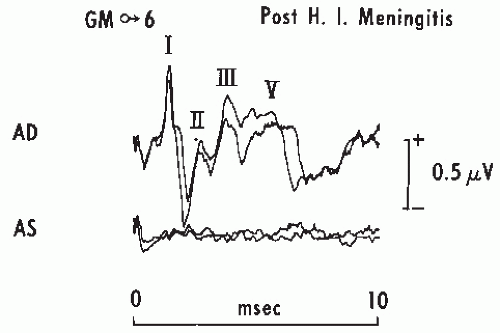
Figure 47.11 Brainstem auditory evoked potentials (BAEPs) in a boy, aged 6, 10 days after recovery from Haemophilus influenzae meningitis. Note the total absence of any response to left ear stimulation (AS), suggesting profound damage to the left cochlea or VIII nerve. Stimulation consisted of rarefaction clicks at 75 dB HL. Stimulation of the right ear AD shows a prolonged I to V interval and a dispersed Wave V amplitude suggesting right brainstem damage.


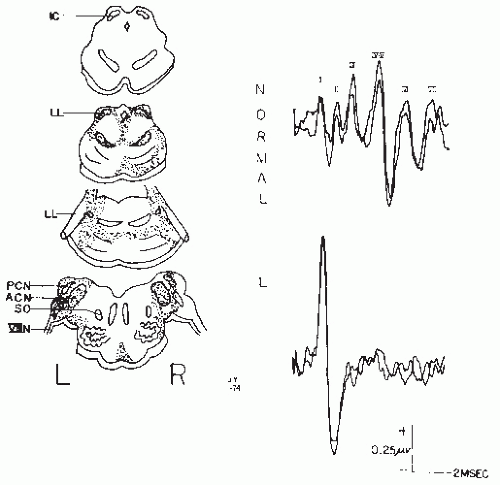
Figure 47.12 The distribution of neuropathology and BAEPs in a patient with anoxic brain damage. The BAEPs were recorded when neurologic examination and EEG were compatible with brain death. Note that the response to a 65 dB HL click consisted of only prolonged latency Wave I, compared to the normal record. (From Starr A, Hamilton AE. Correlation between confirmed sites of neurologic lesions and abnormalities of far-field auditory brainstem responses. Electroencephalogr Clin Neurophysiol. 1976;41:595-608.)


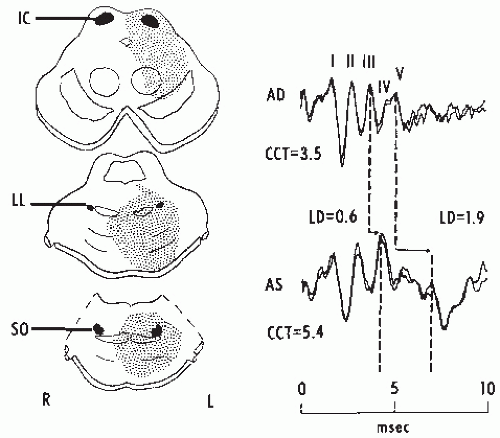
Figure 47.13 Brainstem auditory evoked potentials (BAEPs) in a male, aged 31, with a pontine glioma. The diagrams on the left show the patient’s lesion as seen by computed tomography the same day as the BAEP recordings. Note the progressively increased latencies of Waves III and V with stimulation of the left ear (AS), resulting in a prolonged I to V interval (CCT) of 5.4 msec. Wave V is also markedly depressed. The diagnosis was confirmed postmortem. IC, inferior colliculus; LL, lateral lemniscus; SO, superio-olive; AD, right ear; LD, latency difference.

In the past BAEPs have been used for the diagnosis of a variety of neuro-otologic and neurologic disorders (99, 100, 101, 102, 103, 104, 105, 106, 107, 108, 109, 110, 111, 112, 113, 114, 115, 116, 117, 118, 119, 120, 121, 122, 123, 124, 125, 126, 127, 128, 129, 130, 131, 132, 133, 134, 135, 136, 137, 138, 139 and 140); however, the diagnostic importance of BAEPs has greatly diminished since MRIs have been able to visualize the details of the brainstem. The MRI ability to visualize the anatomy of the brainstem and localize the site of lesions remains undisputable and thus is the preferred test for the diagnosis of expanding and/or destructive lesions of the CPA and brainstem. However, BAEPs remain valuable in the assessment of the functional integrity of the auditory brainstem pathways (101, 102, 103, 104, 105, 106, 107 and 108, 117, 118, 119, 120, 121 and 122,125, 126 and 127,129, 130, 131, 132, 133, 134, 135, 136, 137, 138, 139 and 140). BAEPs can answer the question whether or not the auditory system has been compromised by dysfunction of the auditory pathways. Furthermore, BAEPs retain their diagnostic value in cases of metabolic dysfunction and/or disorders not visualized by MRI or in cases of equivocal MRI findings (129, 130, 131, 132, 133, 134, 135, 136, 137, 138 and 139).

BAEPs abnormalities have been noted in metabolic and toxic encephalopathies (120,126,127,129,133, 134, 135, 136, 137, 138 and 139). Walser et al. (134) studied the effect of uremia on the BAEPs and demonstrated Wave I attenuation consistent with an effect on the cochlea or auditory nerve, as well as slowing of Wave V and the I to V interval consistent with brainstem involvement. Peak latencies of Wave V and interpeak latencies were shorter after dialysis in a group of 38 chronic renal failure patients (135).

Only gold members can continue reading. Log In or Register to continue

Stay updated, free articles. Join our Telegram channel

Sep 9, 2016 | Posted by in NEUROSURGERY | Comments Off on Brainstem Auditory Evoked Potentials (BAEPs) and Other Auditory Evoked Potentials

Full access? Get Clinical Tree

Get Clinical Tree app for offline access