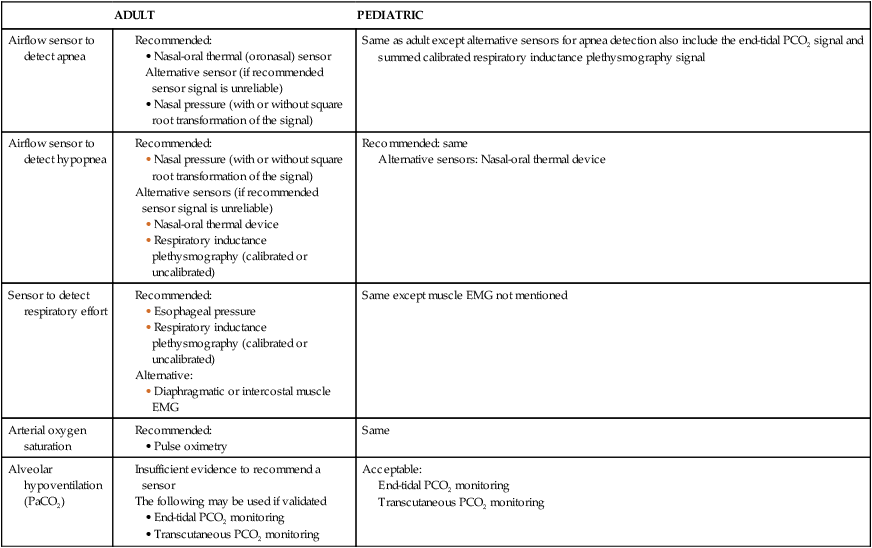
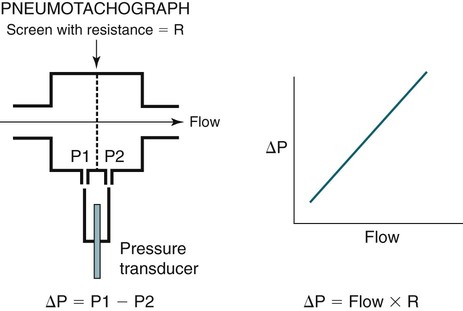
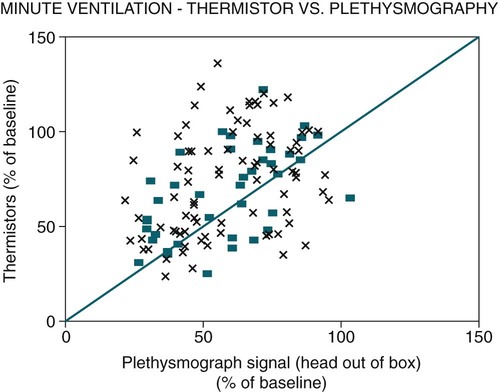
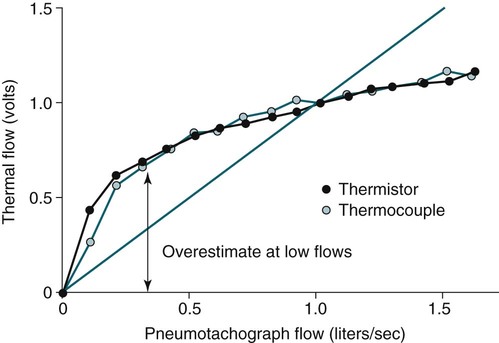
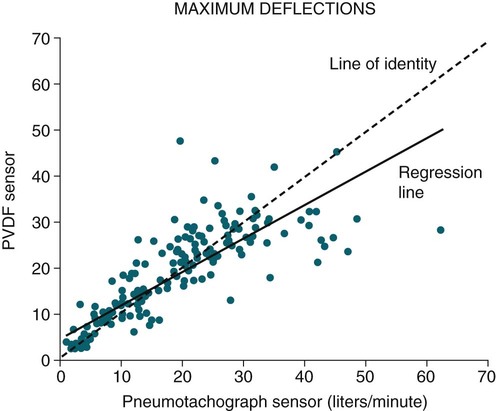
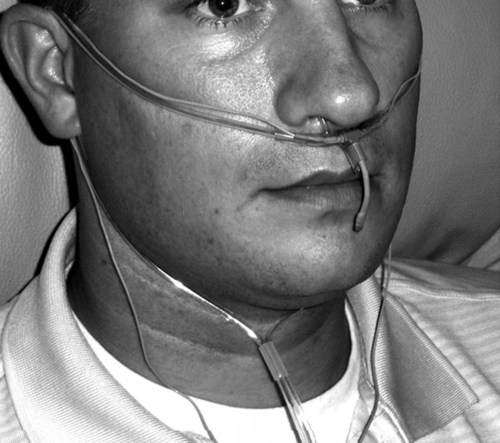
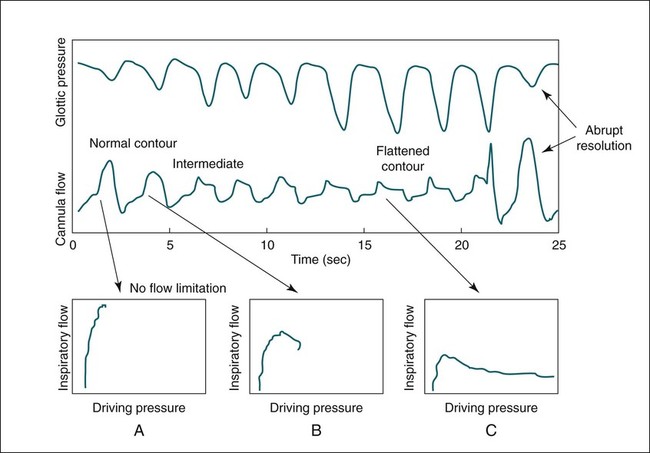
• The recommended sensor to detect apnea is a nasal-oral (oronasal) thermal device. • The recommended sensor to detect hypopnea is the NP signal (with or without square root linearization). • The NP signal is proportional to the flow squared. The NP signal tends to underestimate low flow and overestimate high flow. Flattening of the inspiratory portion of the NP tracing is suggestive of airflow limitation and high upper airway resistance. • Although the most sensitive method to detect respiratory effort is esophageal manometry, RIP is the recommended method used in most clinical studies. • The RIPsum is an estimate of tidal volume (more accurate when calibrated). • The relationship between the SpO2 and the corresponding PaO2 depends on many factors affecting the position of the oxyhemoglobin saturation curve (including PaCO2, temperature, and abnormal hemoglobin). • A valid PETCO2 measurement assumes that the tracing has an alveolar plateau. • SpO2 utilizes the absorption of two wavelengths of light while co-oximetry utilizes four wavelengths and can determine the true fraction of oxyhemoglobin when significant amounts of COHb or MetHb are present. The three major components of respiratory monitoring during sleep include measurement/detection of airflow, measurement/detection of respiratory effort, and measurement of arterial oxygen saturation (SaO2). Ancillary monitoring may include detection of snoring and recording surrogates of the arterial partial pressure of carbon dioxide (PaCO2) including end-tidal partial pressure of carbon dioxide (PETCO2) and transcutaneous partial pressure of carbon dioxide (TcPCO2). The techniques employed for respiratory monitoring are discussed in detail in this chapter. The criteria for defining important respiratory events are presented in Chapter 9. The AASM Manual for the Scoring of Sleep and Associated Events (hereafter referred to as the “AASM scoring manual”)1 outlines rules for scoring respiratory events. These are discussed in detail in Chapter 9. The AASM scoring manual1 recommends specific sensor types and techniques to be used for recording respiration during sleep (Table 8–1). The recommendations are based on consensus and evidence from an accompanying systematic review of the validity and reliability of scoring respiratory events during sleep.2 This review serves as an update of a previous AASM consensus statement concerning the respiratory definitions and the accuracy of monitoring techniques published in 1999.3 TABLE 8–1 American Academy of Sleep Medicine Recommended Sensors From Iber C, Ancoli-Israel S, Chesson A, Quan SF for the American Academy of Sleep Medicine: The AASM Manual for the Scoring of Sleep and Associated Events: Rules, Terminology and Technical Specifications, 1st ed. Westchester, IL: American Academy of Sleep Medicine, 2007. The techniques used to detect (measure) airflow during sleep studies are listed in Table 8–2. The pneumotachograph (PNT) is the most accurate method to measure airflow during sleep studies (Fig. 8–1).2,3 This device quantifies airflow by measurement of the pressure drop across a linear (constant) resistance (usually a wire screen)3. The relationship between the pressure change, flow rate, and resistance is given by the following equation: TABLE 8–2 Monitoring Airflow or Tidal Volume NP = nasal pressure; PNT = pneumotachograph; RIP = respiratory inductance plethysmography. Thermal devices were the first to be used to monitor airflow during clinical sleep studies.2,3 These devices actually detect changes in temperature induced by airflow (cooler inspired air, warmer exhaled air). The changes in device temperature result in changes in voltage output (thermocouples) or resistance (thermistors). Thermal sensors are generally adequate to detect an absence of airflow (apnea), but their signal does not vary in proportion to airflow.4,5 Therefore, thermal sensors are not an ideal means of detecting a reduction in airflow (hypopnea). Figure 8–2 compares thermal sensor estimates of minute ventilation with those using an accurate measurement of tidal volume (the head out of the box plethysmograph).4 A wide scatter of points illustrates the poor ability of thermal devices to track changes in tidal volume (and flow). Figure 8–3 compares thermistor and thermocouple signals in a nose model with a PNT as the gold standard (accurate measure of flow).5 Note that thermal signals and PNT flow are equal at 1 L/sec (by design). However, as airflow decreases, the thermal signals overestimate flow. This figure illustrates that thermal sensors are not ideal sensors to detect hypopneas (reductions in flow). The same study demonstrated that the thermal sensor signal decreases when the nostrils are large or the thermal sensor is further from the nares. Of note, thermal devices composed of polyvinylidine fluoride (PVDF) film may offer a better estimate of flow6 (Fig. 8–4). Nasal-oral thermal sensors usually have a portion of the device placed within or just outside the nostrils with another portion over the mouth (detection of oral flow) (Fig. 8–5). A major advantage of thermal sensors is that they can detect both nasal and oral airflow without the need for a cumbersome mask covering the face. Measurement of nasal pressure (NP) provides an estimate of nasal airflow that is more accurate than one obtained with most thermal sensors.7–12 NP is measured using a nasal cannula connected to an accurate pressure transducer. Because the cannula tips are inside the nares and the other side of the pressure transducer is open to the atmosphere, the pressure being measured is actually the pressure drop across the resistance of the nasal inlet associated with nasal airflow. The resistance of the nasal inlet is not a constant (nonlinear). The relationship of NP and flow is given by Equations 8–2 and 8–3.7,10 Because NP varies with the square of flow, the NP signal tends to underestimate airflow at low flow rates and overestimate flow at high flows (Fig. 8–6). The NP signal is “linearized” by taking the square root (Equation 8–3) and when calibrated, it very closely approximates the flow from a PNT at least over a short period of time (see Fig. 8–6). However, in clinical practice, the NP signal rather than the square root of the signal is most often recorded as an estimate of nasal airflow. Even when linearized, the NP signal may not provide an absolutely accurate estimate of total airflow over the entire night. Changes in cannula position, periods of partial oral flow, and obstruction of the cannula by nasal secretions make the linearized NP signal a less accurate measure of flow over the entire night.11 Thurnheer and coworkers11 compared the NP and linearized NP signals ( TABLE 8–3 Comparison of Methods for Detection of AHI with the Pneumotachograph (Flowmeter) *NP (50%) hypopnea defined as a drop in NP signal to 50% of baseline with duration ≥ 10 sec. †NP (25%) hypopnea defined as a drop in NP to 25% of baseline with duration ≥ 10 sec. ‡Linearized NP (50%) hypopnea defined as a drop in square root of NP signal to 50% of baseline with duration ≥ 10 sec. §RIPsum hypopnea defined by a 50% drop in RIPsum signal with duration ≥ 10 sec. Adapted from Thurnheer R, Xie X, Bloch KE: Accuracy of nasal cannula pressure recordings for assessment of ventilation during sleep. Am J Respir Crit Care Med 2001;146:1914–1919. Heitman and colleagues12 also compared the NP and linearized NP signals with a full-face mask with PTN for detection of hypopneas during sleep. A hypopnea was defined as either a 50% drop in the device signal or less than a 50% drop in the device signal with an associated arousal or 3% or greater arterial oxygen desaturation. The intermeasurement agreements (kappa) between NP and PNT and linearized NP and PNT signals were both excellent and essentially identical. In addition to the signal amplitude, the shape (contour) of both the PNT and the NP signals during inspiration provides additional useful information7,8,13 (Fig. 8–8). During normal unobstructed flow, the inspiratory shape (contour) of the NP signal is round (see Fig. 8–8A), whereas during airflow limitation (a constant or decreased airflow associated with an increasing driving pressure), the shape of the PNT and NP signals is flattened (see Fig. 8–8C). Of note, airflow limitation is characteristically present during obstructive reductions in airflow (hypopnea) or snoring. In contrast, when reductions in airflow are simply due to a fall in inspiratory effort, the NP signal amplitude is reduced but the shape is round. Airflow limitation is usually associated with an increased pressure drop across the upper airway (more negative inspiratory pressure below the site of upper airway narrowing; see Fig. 8–8C).
Monitoring Respiration—Technology and Techniques
ADULT
PEDIATRIC
Airflow sensor to detect apnea
Same as adult except alternative sensors for apnea detection also include the end-tidal PCO2 signal and summed calibrated respiratory inductance plethysmography signal
Airflow sensor to detect hypopnea
Recommended: same
Alternative sensors: Nasal-oral thermal device
Sensor to detect respiratory effort
Same except muscle EMG not mentioned
Arterial oxygen saturation
Same
Alveolar hypoventilation (PaCO2)
Acceptable:
End-tidal PCO2 monitoring
Transcutaneous PCO2 monitoring
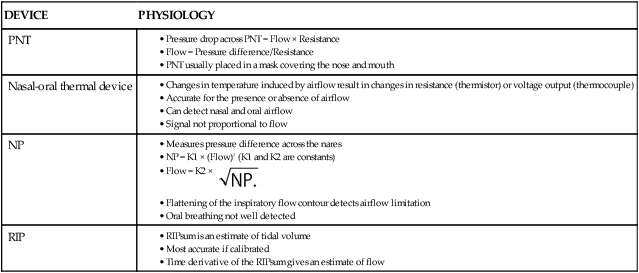
Techniques to Measure Airflow or Tidal Volume
DEVICE
PHYSIOLOGY
PNT
Nasal-oral thermal device
NP
RIP
 Equation 8–1
 Equation 8–2
 Equation 8–3
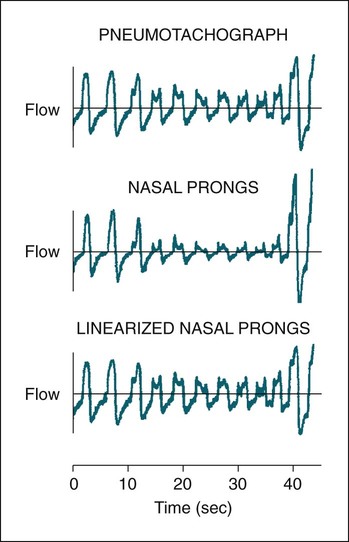
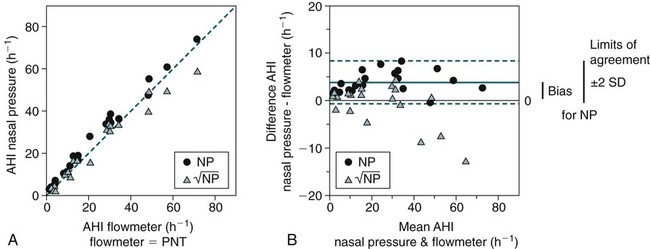
 ) for detection of respiratory events with the PNT (flowmeter) (Fig. 8–7). The number of apneas and hypopneas per hour of sleep (apnea-hypopnea index [AHI]) was determined using each of the three signals (PNT, NP, and linearized NP). A hypopnea was defined as a reduction in signal to 50% or less of the baseline. The bias (mean difference between AHI values) and limits of agreement (±2 SD [standard deviation] of the differences) were determined by comparing the AHI values detected by the NP versus PNT and the linearized NP versus PNT signals in each patient. The AHI values from both the NP and the linearized NP signals showed excellent agreement with the AHI values determined from the PNT (flowmeter) (Table 8–3; see also Fig. 8–7). The AHI values detected by the NP signal tended to be slightly higher than the linearized NP signal, but the differences were usually small. Of note, when a more stringent criteria was used for NP events (signal reduction to ≤25% of baseline), the NP results were essentially identical to the linearized NP results. Recall that NP = K (Flow)2 and, therefore, if flow drops from 1 to 0.5, the NP signal drops to 0.25 NP. Using an AHI of 5/hr by PNT to diagnose obstructive sleep apnea (OSA), all of the 20 patients in the study would have been correctly classified by the linearized NP signal but there would have been two false positives with the AHI determined by NP (50% drop).
DEVICE
BIAS = MEAN DIFFERENCE OF AHI values
(AHI DEVICE—AHI PNT)
(EVENTS/hr)
LIMITS OF AGREEMENT
(±2 SD OF AHI DIFFERENCES)
(EVENTS/hr)
NP (50%)*
3.9
−0.8 to 8.5
NP (25%)†
−0.8
−9 to 9.6
Linearized NP (50%)‡
−0.9
−9.9 to 8.1
RIPsum§
2.6
−3.3 to 8.6
Time derivative
RIPsum
1.0
−5.6 to 7.6
 Time derivative of RIPsum hypopnea defined by a 50% drop in signal with duration ≥ 10 sec.
Related posts:
 Sleep and Neurologic Disorders
Parasomnias
Sleep and Nonrespiratory Physiology—Impact on Selected Medical Disorders
Sleep Architecture Parameters, Normal Sleep, and Sleep Loss
The Technology of Sleep Monitoring: Differential Amplifiers, Digital Polysomnography, and Filters
Cardiac Monitoring during Polysomnography
Sleep and Neurologic Disorders
Parasomnias
Sleep and Nonrespiratory Physiology—Impact on Selected Medical Disorders
Sleep Architecture Parameters, Normal Sleep, and Sleep Loss
The Technology of Sleep Monitoring: Differential Amplifiers, Digital Polysomnography, and Filters
Cardiac Monitoring during Polysomnography
![]()
Stay updated, free articles. Join our Telegram channel

Full access? Get Clinical Tree


Neupsy Key
Fastest Neuropsychology Insight Engine

