Schematic representation of static autoregulation (Lassen’s) curve. Cerebral blood flow is maintained constant between 50 and 150 mmHg of mean ABP. These are known to be the lower (thinner arrow) and upper (thicker arrow) limits of cerebral autoregulation. Notice that below the curve the circles are representing active vasomotor changes in reaction to blood pressure variations. Toward the lower limit, the vasodilation reaches its maximum and vascular collapse occurs beyond 50 mmHg. Toward the upper limit, cerebral vasoconstriction can no longer accommodate high transmural pressures and passive vasodilation leads to vasogenic cerebral edema.
In the dawn of CBF studies in humans, the investigators had to rely on the cumbersome indicator-dilution techniques, such as 133xenon or N2O, which required several minutes and expert pharmacological manipulation of ABP to yield a single value of CBF. As a consequence, the classical CA curve, showing a plateau between certain values of ABP (Figure 17.1), represents a “static” depiction of CA [5]. This is not feasible in clinical grounds. With the advent of transcranial Doppler (TCD) [6], with its noninvasiveness and remarkable temporal resolution (around 5 ms), the study of CA in humans reached a new paradigm. Thus, it became possible to evaluate continuously the CBF adaptations to more rapid changes of ABP. With this in mind, in 1989 Aaslid et al. [7] coined the term dynamic CA to describe the characteristic transient response of cerebral blood flow velocity (CBFV) to a standardized provoked sudden change in ABP. Notwithstanding the central role played by TCD in the expansion of this field, it is also important to acknowledge the simultaneous development of instruments for noninvasive continuous recording of ABP, such as the Finapres® or Portapres® devices.
Physiological control of cerebral autoregulation
Under normal conditions, CA seems to maintain CBF constant within a mean ABP ranging from 50 to 150 mmHg [5]. Within this interval, cerebral vasculature adapts to lower values of ABP by promoting vasodilation, that is, diminishing cerebral vascular resistance (CVR), and to higher ABP levels by vasoconstriction (increasing CVR). Beyond these two limits, CA is lost and CBF responds to each pressure level in a linear fashion. Consequently, with values of mean ABP below 50 mmHg the CBF decreases, putting the brain at risk of ischemia. On the other hand, at upper levels of mean ABP, beyond 150 mmHg, cerebral vessels are unable to accommodate, leading to increased CBF, resulting in vasogenic edema and hypertensive encephalopathy. Although this is still an old static interpretation of CA, our clinical attitude continues to be based on it. The dynamic assessment of CA brought a new view regarding the limits of CA, which might be different among individuals, might be influenced by their pathological status and might change over time within the same subject [4,7,8].
Many factors can interact in CA control [9]. CA is dependent on rapid myogenic responses. ABP changes lead to variations in transmural pressure at the level of resistance vessels (cerebral arterioles and small pial vessels). This causes alteration of vascular membrane permeability to ions, and change in membrane potentials that leads to augmented sensitivity to pressure variation [10]. Also, shear stress induced by pulsatile blood flow promotes flow-mediated vasodilation which might be the link between the effects of cardiac output and CBF [11]. The endothelium is physiologically coupled with a smooth muscle cell layer of the vascular wall, mediating vasoconstriction through paracrine and autocrine release of endothelin, and vasodilation through nitric oxide-mediated mechanisms [10]. Other metabolic factors also affect autoregulation in several ways. The most powerful mediators of dilation are hypoxia and hypercapnia [11]. Hypocapnia augments the CA efficacy while hypercapnia has the opposite effect [7]. Finally, neurogenic control of CBF can exert its influence by extracerebral sympathetic, parasympathetic and sensory innervation, as well as intrinsic innervation [12], although there is still some debate about the role of this factor under physiological conditions [13].
Directly linked to CA is the concept of critical closing pressure (CrCP) of the cerebral circulation. It indicates the value of ABP at which CBF approaches zero. Figure 17.2 depicts how to calculate CrCP and its related parameter, resistance-area product (RAP). It has been shown to be an important factor regulating cerebrovascular tone [14]. Compared to single CVR index (mean ABP/mean CBFV), a two-parameter model of CrCP and RAP can represent an added value, in studying cerebral hemodynamics. It is influenced by arterial PCO2, ICP, CA, intrathoracic pressure, and mean ABP [14,15].
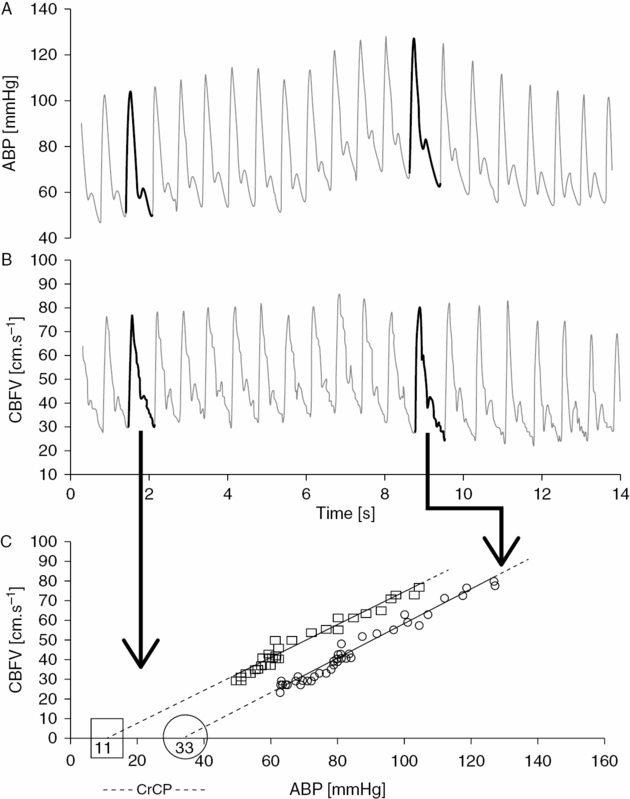
Estimation of critical closing pressure (CrCP) and resistance-area product (RAP) from continuous recordings of ABP (A), and CBFV (B). For each cardiac beat, the waveform of CBFV is plotted against ABP (C). For the sake of simplicity, the previous transformation of the waveforms into their first harmonic is not shown. The interception of the regression line in the x-axis determines the value of estimated CrCP (CBFV is mathematically zero). The inverse of the inclination of the curve gives the value of RAP.
Another physiologic mechanism of cerebral vasoregulation, the cerebral neurovascular coupling, which adapts the evoked cerebral regional perfusion to the metabolic needs driven by cortical neuronal activation, also depends apparently on the vasoreactivity of the same small vessels as CA. The interplay of the simultaneous activation of CA and neurovascular coupling has been shown to be unaffected in healthy subjects [16], while neurovascular coupling seems to be not as effective in conditions of extreme adaptation of CA, as in patients with autonomic failure [13].
What is needed to measure cerebral autoregulation?
CA can be measured in various ways. In most instances we will use TCD to record continuously CBFV, as a surrogate of CBF, and peripheral ABP pressure noninvasively with a device such as Finapres®, or with an arterial line in acute intensive care settings. From TCD we can record the envelope of the insonated vessel (usually MCA around 50 mm of depth). Blood pressure and CBFV continuous beat-to-beat time series are then recorded synchronously to be evaluated off-line by dedicated software. CA studies with TCD always rely on the assumption that MCA diameter doesn’t change during the monitoring time. This has been shown to be true for ABP and orthostatic challenge [17,18].
During every test of CA, it is desirable to have constant CO2 levels, as it immensely interferes with CBF. This can be achieved by estimating PaCO2 from EtCO2, as measured by capnography. Also, continuous electrocardiogram co-registration (e.g., lead II) can be used to detect cardiac cycles and extra-beats, as some professional software requires it, although most machines are able to calculate systolic, diastolic and mean values of CBFV and ABP from correspondent waveforms, and indirectly the heart rate.
A different approach was implemented by Czosnyka et al. [19]. Instead of CBFV, his team uses ICP variations, by recording continuous measurements from intracranial probes to assess pressure-reactivity index (PRx). New methods such near-infrared spectroscopy (NIRS) and brain tissue oxygen (PtiO2) are also being tested to provide measures of CA [4].
How do you measure cerebral autoregulation?
Static cerebral autoregulation
This is mainly an investigational and infrequently used method. It is usually tested by a modified Oxford technique which uses slow continuous infusion of phenylephrine and/or sodium nitroprusside to increase and/or decrease ABP. This method is otherwise known to assess baroreflex responses [20]. Tiecks et al. [21] used only the hypertensive protocol and calculated static CA between baseline [1] and the higher ABP level [2] by the formula:

If the protocol includes resting, hypotensive and hypertensive values, then CA can also be quantified by taking the slope of the linear regression between CBFV and mean ABP – the slope being inversely proportional to the efficacy of CA. This means that a slope of zero would imply perfect autoregulation, where CBF remains constant across the entire range of mean ABP, while a steeper slope of linear relationship would reflect the absence of autoregulation.
Dynamic cerebral autoregulation
After the seminal communication of Aaslid in 1989 [7], a profusion of techniques to assess dynamic CA were introduced and continue to evolve. For practical purposes, we can separate dynamic CA assessment methods in those which require a particular maneuver to elicit an ABP change, and those which are able to measure it from spontaneous oscillations of ABP (resting conditions). While the first ones use more rigorous and standardized ABP challenges, the latter seem more appellative since no specific collaboration of subjects or hemodynamic manipulation is needed, with obvious advantages in clinical settings, and a closer approximation to physiological conditions. From a theoretical and mathematical perspective, dynamic CA evaluation is separated in time and frequency domain methods. In the next paragraphs, each method is explored, underlining major pros and cons.
Associated with specific maneuvers
Thigh cuffs release test
The thigh cuffs release test (TCRT) was introduced by Aaslid et al. [7] using the deflation of pneumatic cuffs. The original apparatus was composed of two modified conventional tight cuffs with larger tubings connected by a Y-piece. Cuffs are inflated to a suprasystolic level for at least 2 minutes (baseline), after which a sudden deflation of the cuff is provoked by disconnecting the Y-piece. This causes a rapid decline in ABP (over 200 ms). CBFV immediate response is also a rapid decline but returns to basal levels before ABP restoration, reflecting active CA. This transient response is depicted in Figure 17.3. The rate of regulation (RoR) as a surrogate for more or less efficacious CA, could be then calculated from the rate of change of CVR (ΔCVR) for each unit of ABP drop (ΔABP) within the interval of 1–3.5 seconds (ΔT) after cuff release:

All values are normalized to baseline values. The baseline control values are defined by their means during the 4 seconds before thigh-cuff release. An example is shown in Figure 17.3.
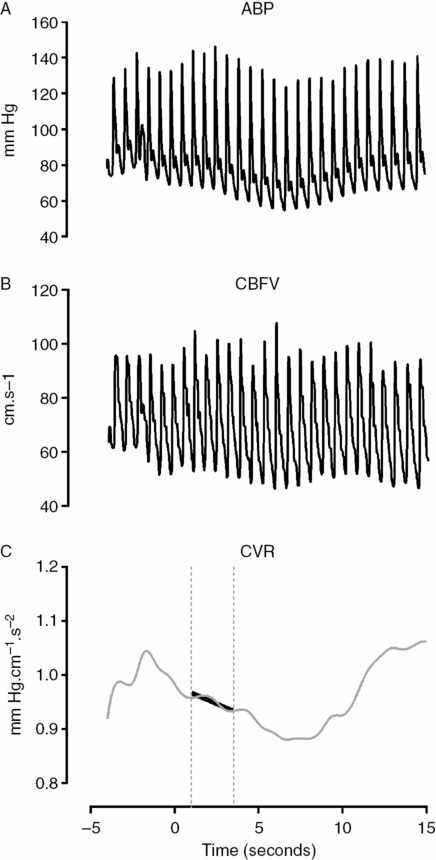
Thigh-cuff release test showing ABP (A) and CBFV (B) waveforms in response to sudden bilateral thigh cuff release. Normalized CVR changes (relative to baseline mean value between −4 and 0 s) are plotted (C) in order to calculate the RoR. It corresponds to the inclination of the line (black line) obtained by linear regression between 1 and 3.5 seconds.
Based on the same maneuver, Tiecks et al. [21] proposed to calculate an autoregulatory index (ARI) based on a mathematical refinement of the RoR responses obtained by the leg-cuff release test. In practice, the test protocol remains the same. However, this author observed that the CBFV responses obtained to ABP step change could be nicely predicted by a second-order linear function using three predefined parameters: T (time constant), D (damping factor) and k (the autoregulatory dynamic gain). He proposed that ARI could be represented by an integer from 0 to 9 based on ten templates of computer-generated CBFV idealized responses (Figure 17.4) by solving the equation with ten prespecified combinations of the parameters (Table 17.1). The coefficients are given by:


where dPn is the normalized change in mean arterial ABP (MAP) relative to baseline, MAP (MAPbase) and adjusted for estimated critical closing pressure (CCP); x2n and x1n are state variables (equal to 0 at baseline); mVn is the modelled mean velocity; MCAvbase is baseline mean CBFV of MCA; f is the sampling frequency, and n is the sample number. A value of 0 represents no autoregulation where CBV passively follows perfusion pressure, and a value of 9 represents perfect and faster CA, where changes in perfusion pressure produce no alteration to CBF. Following this method, we get the index of dynamic CA (i.e., the ARI) of a given subject by finding the model that best fits his actual MCA CBFV response.
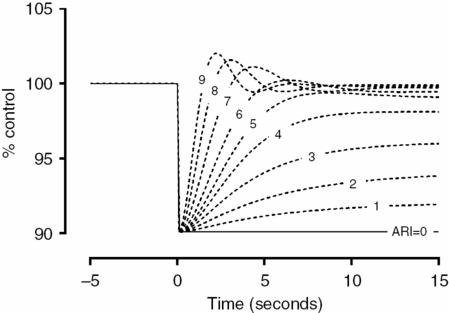
Tiecks’ model. Ten templates of CBFV response (A) to ABP drop after cuff release are constructed based on a second-order linear equation by combining three different variables (T, time constant; D, dampening; and K, gain) as enumerated in Table 17.1. The actual CBFV response is compared to this templates and the ARI is given by the ARI that best fits this curve.
| T, s | D | K | ARI | dROR, %/s |
|---|---|---|---|---|
| 2.00 | 0.00 | 0 | 0 | 0 (No autoregulation) |
| 2.00 | 1.60 | 0.20 | 1 | 2.5 |
| 2.00 | 1.50 | 0.40 | 2 | 5.0 |
| 2.00 | 1.15 | 0.60 | 3 | 10.0 |
| 2.00 | 0.90 | 0.80 | 4 | 15.0 |
| 1.90 | 0.75 | 0.90 | 5 | 20.0 (“Normal” autoregulation) |
| 1.60 | 0.65 | 0.94 | 6 | 30.0 |
| 1.20 | 0.55 | 0.96 | 7 | 40.0 |
| 0.87 | 0.52 | 0.97 | 8 | 60.0 |
| 0.65 | 0.50 | 0.98 | 9 | 80.0 (Fastest autoregulation) |
A latter advance was introduced by Panerai et al. [22], showing that it is possible to calculate ARI in resting conditions by monitoring spontaneously oscillations (natural step increases and decreases) between ABP and CBFV. This method includes transfer function analysis (TFA, see “Transfer function analysis”) in first place, and then its inverse discrete Fourier transform of amplitude and phase to estimate CBFV impulse and step responses.
Valsalva maneuver
The Valsalva maneuver, which is often used to assess autonomic function, can be used to study CA. The maneuver should be performed in the recumbent position by asking the patient to blow into a mouthpiece connected to a mercury manometer for 15–20 seconds, maintaining a level of pressure of 40 mmHg. There should be a small air leak in the system to prevent closing of the glottis. This test should be repeated several times to ensure a reproducible response. The typical ABP variations are depicted in Figure 17.5.
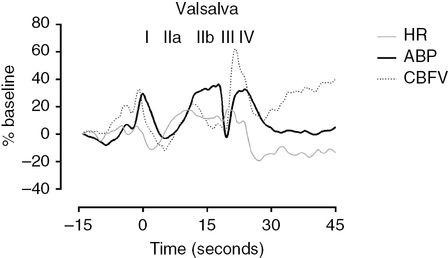
Valsalva maneuver. The phases of the Valsalva maneuver are clearly identified with roman numerals on top of the ABP curve. All values are normalized and expressed as % of baseline values. Notice that heart rate (HR) is also shown to represent the tachycardia during the maneuver. The CA indexes can be easily calculated by the formulas explicit in the text. CA-II is 1.21 and CA-IV is 1.23 which means that CA is preserved as values area higher than 1.
After an initial phase of sudden increase in intrathoracic pressure (phase I), ABP drops (phase IIa) until peripheral vasoconstriction, brought by sympathetic activation, exerts its effects in restoring ABP levels (phase IIb). After cessation of expiratory effort, a sudden fall in ABP is produced by a rapid drop in intrathoracic pressure, after which there is an overshoot of ABP against a previously constricted systemic vascular bed (phase IV). By inspecting the discrepancy between continuous CBFV and ABP changes during each phase, Tiecks et al. [23] concluded that this response in Valsalva manoeuver was indicative of an active CA and proposed it to be used as an index. Similarly to what happens with the TCRT, CA is preserved if CBFV responds ahead of ABP, leading to partial restoration of CBFV between phase IIb and IIa. For phase II, an autoregulatory index (AI-II) could be defined as:

The cerebral vasodilatory counteraction should be also detected in phase IV, and that second index (AI-IV) is:

All values are mean values of CBFV and ABP. For phase IIa, minimum values are considered, while for IIb, I and IV, maximum values should be considered. For both indexes, values >1 are synonymous of a preserved CA and values <1 are interpreted as non-effective CA [23].
Since their initial description, these indexes have been rarely reported in clinical studies, mainly due to the limits to their interpretation and applicability in the presence of confounders, such as autonomic dysfunction, or contraindications (e.g., intracranial hemorrhage, hypertension).
Transient hyperemic response test
This method was firstly introduced by Giller [24] and later standardized by Smielewski et al. [25]. The Transient hyperemic response test (THRT) comprises a brief, <5-second, compression of the common carotid as low as possible in the neck, whilst TCD insonates the ipsilateral MCA. An intact CA will provide vasodilatation during the period of carotid compression. Releasing the carotid compression results in a transient hyperemic overshoot due to perfusion pressure restore in a dilated vascular bed. If autoregulation is lost, the response is absent. Calculation is simple:

One should pay attention to the fact that FVS denotes systolic CBFV, baseline corresponds to the average value of systolic CBFV of the last five heart cycles before applying the maneuver (excluding the one that immediately precedes compression), and hyperemia corresponds to the average systolic value of two heart cycles after the compression release (Figure 17.6). THRT >1.09 is taken as intact CA, that is, it is expected at least a 10% increase in peak systolic flow velocity after release of the common carotid.
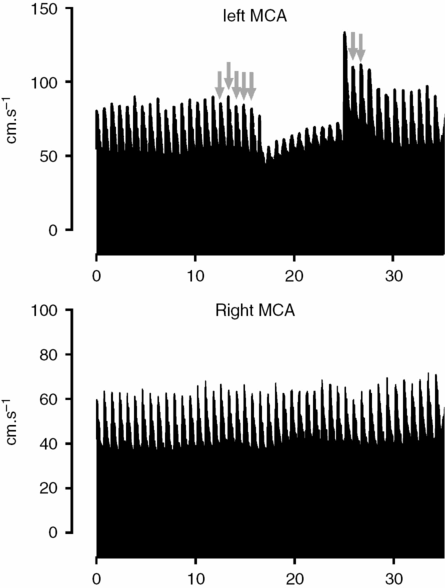
Example of testing of cerebral autoregulation by THRT. The left common carotid is compressed as low as possible in the neck while TCD records bilateral MCA flow velocities. The right MCA is shown as visual control for the changes occurring at left side. Immediately after the release of pressure there is as hyperemic response. The gray arrows indicate the peak systolic CBFV points used to calculate the baseline and hyperemic values of the THRT as described in the text. This is used to calculate the THRT (in this case 1.31, meaning that there was around a 30% increase of CBFV from baseline values). It’s a normal response as far as it is higher than 10% (THRR >1.09).
Many studies have used THRT as a surrogate test for CA, but safety concerns have been raised and it is debatable if this test fully represents the complexity of CA [4,25].
Stay updated, free articles. Join our Telegram channel

Full access? Get Clinical Tree


