EEG Event-Related Desynchronization (ERD) and Event-Related Synchronization (ERS)
Gert Pfurtscheller
Fernando H. Lopes Da Silva
EEG desynchronization or blocking of alpha band rhythms due to sensory processing or motor behavior was first reported by Berger (1), Jasper and Andrew (2), and Jasper and Penfield (3). This desynchronization reflects a decrease of oscillatory activity related to an internally or externally paced event and is known as event-related desynchronization (ERD) (4). The opposite, namely the increase of rhythmic activity, is termed event-related synchronization (ERS) (5). ERD and ERS are characterized by their fairly localized topography, phasic behavior, and frequency specificity. Both phenomena can be studied as functions of time and space (ERD/ERS maps). There is general agreement that EEG alpha desynchronization is a reliable correlate of the increased cellular excitability in thalamocortical systems during cortical information processing (6).
EVENT-RELATED POTENTIALS VERSUS EEG-INDUCED REACTIVITY
Two types of changes in the electrical activity of the cortex may occur on sensory stimulation: one change is time- and phase-locked (evoked) and can be extracted from the ongoing activity by simple linear methods such as averaging; the other is time-locked but not phase-locked (induced) and can only be extracted through some nonlinear methods such as envelope detection or power spectral analysis. Which mechanisms underlie these types of responses? The time- and phase-locked response can easily be understood in terms of the response of a quasi-stationary system to an external stimulus that can be accounted for, in a first approximation, by a process of addition of the evoked response to the ongoing activity of the neural networks, albeit the latter may undergo some degree of reorganization as well (see also discussion in Chapter 44). Whether or not this occurs is a matter of debate, but Mazaheri and Jensen (7) using a measure called phase-preservation index showed that the phase of alpha oscillations after a visual stimulus was the same as before the stimulus, which argues against a role of a phase-setting mechanism at least in this type of conditions. The induced changes can be understood as resulting from changes in the dynamic state of the neural networks. These changes can be due to a variety of factors; in particular they may depend on modulating influences arising from neurochemical brain systems, leading to changes in the strength of synaptic interactions, or affecting intrinsic membrane properties of the local neurons.
A typical example of the occurrence of both phase-locked (evoked) and non-phase-locked (induced) EEG activities is found with visual stimulation; induced EEG oscillations around 40 Hz are found in parallel with the phase-locked visual evoked potentials (VEPs) (8). Averaging over a number of EEG trials improves the signal-to-noise ratio of the VEP, but not of the oscillatory response.
QUANTIFICATION OF EEG REACTIVITY
The ERD/ERS can be quantified in time and space. For the quantification, a number of event-triggered EEG trials are necessary, including some seconds before and some seconds after the event (Fig. 45.1). The event can be externally paced (e.g., acoustical, visual, or somatosensory stimulation) or internally paced (e.g., voluntary finger movement). The procedure of processing, once the frequency band has been selected, includes the following steps: (i) bandpass filtering of each event-related trial, (ii) squaring of each amplitude sample to obtain power samples, (iii) averaging over all trials, and (iv) averaging over a small number of consecutive power samples to reduce the variance. An alternative method is based on the calculation of the intertrial variance (9,10). Absolute band power is converted into percentage power by defining the power within a reference interval as 100%. By convention, a power decrease corresponds to an ERD and a power increase to an ERS (5).
SELECTION OF EEG FREQUENCY BANDS
One way of defining the EEG frequency bands of interest is to search for the most reactive frequency components. This search involves the comparison of two 1-second power spectra to identify frequency bands showing statistically significant differences. The first 1-second power spectrum is calculated during the reference interval (i.e., during rest), while the second is calculated during the period of interest, for example, before movement onset to investigate pre-movement ERD, or after movement to investigate
post-movement beta ERS (Fig. 45.2). A frequency band with a significant power decrease is selected for ERD calculation (e.g., 8 to 12 Hz in Fig. 45.2), while a band with a significant power increase (e.g., 12 to 19 Hz in Fig. 45.2) is defined for ERS calculation (13, 14 and 15). Theoretically, the frequency band can be defined for each derivation. In practice, a few derivations overlying the areas of interest—depending on the specific study being performed—are used to determine the frequency bands for all electrodes; for example, temporal and parietal electrodes are selected in a memory task and central electrodes in a movement study. Another method of frequency band selection can be applied specifically to subdivide the alpha band into sub-bands, as used by Klimesch et al. (16). The dominant alpha peak in the power spectrum calculated for the whole trial is first detected. The upper alpha band is then defined as consisting of the frequencies between this alpha peak frequency and the upper edge of the classically defined alpha band, while the lower alpha band is defined as those frequencies between the alpha peak frequency and the lower edge of the alpha band.
post-movement beta ERS (Fig. 45.2). A frequency band with a significant power decrease is selected for ERD calculation (e.g., 8 to 12 Hz in Fig. 45.2), while a band with a significant power increase (e.g., 12 to 19 Hz in Fig. 45.2) is defined for ERS calculation (13, 14 and 15). Theoretically, the frequency band can be defined for each derivation. In practice, a few derivations overlying the areas of interest—depending on the specific study being performed—are used to determine the frequency bands for all electrodes; for example, temporal and parietal electrodes are selected in a memory task and central electrodes in a movement study. Another method of frequency band selection can be applied specifically to subdivide the alpha band into sub-bands, as used by Klimesch et al. (16). The dominant alpha peak in the power spectrum calculated for the whole trial is first detected. The upper alpha band is then defined as consisting of the frequencies between this alpha peak frequency and the upper edge of the classically defined alpha band, while the lower alpha band is defined as those frequencies between the alpha peak frequency and the lower edge of the alpha band.
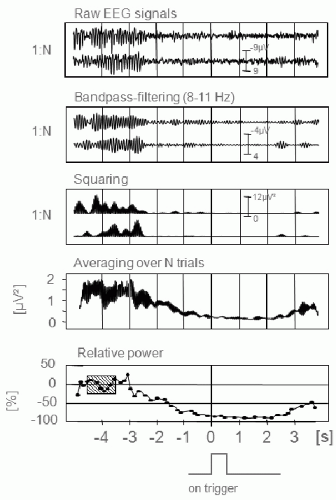 Figure 45.1 Schema for ERD processing showing an example of movement-related mu desynchronization. The raw EEG signals (0.5 to 50 Hz) are first bandpass filtered (8 to 12 Hz); thereafter, all samples are squared and averaged over all N trials. After averaging over consecutive power samples (compression) and specifying a reference interval (e.g., −3.5 to −4.5), the relative band power values are displayed. Power decrease corresponds to ERD. |
To obtain a dynamic representation of changing activity within a broad frequency range, the calculation of time-frequency maps using bandpass filtering (17) (Fig. 45.3) and wavelet transformation (5,18) is recommended. A method with high time-frequency resolution is the matching pursuit with stochastic Gabor dictionaries as estimator for the signal’s energy density (19).
EVENT-RELATED DESYNCHRONIZATION (ERD) AND EVENT-RELATED SYNCHRONIZATION IN ALPHA AND BETA BANDS
The alpha band rhythm displays a relatively widespread desynchronization (ERD) in perceptual, judgment, and memory tasks (20,21). An increase of task complexity or of attention demand results in an increased magnitude of ERD (22,23). Moreover, it has been shown that there is a relationship between the P300 event-related potential and ERD of alpha band activity (24,25). It has to be kept in mind, however, that the ERD is measured as a percentage of power relative to the reference interval, and therefore it depends on the amount of rhythmic activity in this interval. To make a reliable estimate of the power at the resting level (reference epoch), the intervals between consecutive events (e.g., cues, self-paced movements, etc.) should be randomized and not shorter than about 8 seconds.
It is important to note that alpha desynchronization is not a unitary phenomenon. If different frequency bands within the range of the extended alpha band are distinguished, two distinct patterns of desynchronization can be observed. Lower alpha desynchronization (in the range of about 8 to 10 Hz) is obtained in response to almost any type of task. It is topographically widespread over the entire scalp and probably reflects general task demands and attentional processes. Upper alpha desynchronization (in the range of about 10 to 12 Hz), in contrast, is topographically restricted and is rather related to taskspecific aspects (26,27).
It is of interest to note that blocking of alpha band rhythms occurs not only in response to specific stimulation, but also during anticipation of the stimulus. Modality-specific ERD patterns, for instance, have been demonstrated, during anticipatory attention to a feedback stimulus presented in different modalities. Examples are the occipitally maximal ERD preceding visual stimuli and temporally maximal ERD (in magnetoencephalogram [MEG] data) prior to an auditory feedback stimulus (28).
In a Sternberg-type auditory memory task, where first a memory set consisting of four vowels is presented followed by a probe (one vowel) 3 seconds later, the subject had to judge whether the probe was present in the memory set (29). The presentation of the memory set (auditory encoding) elicited a significant ERS in both alpha frequency bands. In contrast, the presentation of the probe (auditory retrieval) elicited a bilateral ERD over centroparietal areas, also in both alpha frequency bands. This ERD can be related to memory scanning processes. The absence of an ERD during the memory set presentation can be explained by the anatomical localization of the auditory
cortex below the scalp surface. Desynchronization due to direct auditory processing alone, therefore, is hard to detect in scalprecorded EEG. The finding that encoding elicits ERS whereas retrieval elicits ERD in the broad alpha frequency band has been reproduced in subsequent studies (30, 31 and 32). In recent studies, ERD/ERS was further investigated in relation to cognitive processes involved in the perceptual and semantic analysis of verbal and nonverbal auditory stimuli (33) and in relation to emotional stimulus material (34,35).
cortex below the scalp surface. Desynchronization due to direct auditory processing alone, therefore, is hard to detect in scalprecorded EEG. The finding that encoding elicits ERS whereas retrieval elicits ERD in the broad alpha frequency band has been reproduced in subsequent studies (30, 31 and 32). In recent studies, ERD/ERS was further investigated in relation to cognitive processes involved in the perceptual and semantic analysis of verbal and nonverbal auditory stimuli (33) and in relation to emotional stimulus material (34,35).
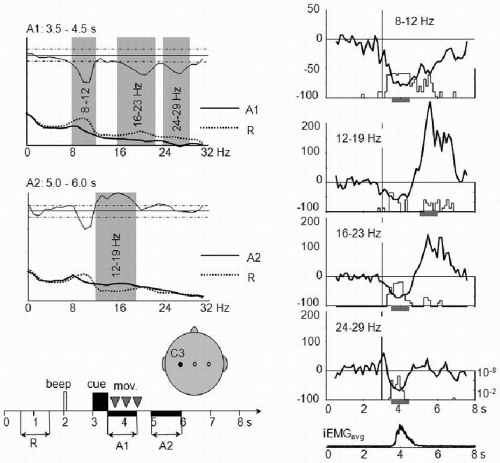 Figure 45.2 Left side: Superimposed logarithmic 1-second power spectra calculated in the reference period (R) and in the activity periods A1 and A2 in a cue-paced right finger movement experiment. A1 and A2 correspond to two 1-second time intervals; one is selected during the cue-triggered finger movement (A1) and the other after termination of the movement (A2). In addition, the differences between the two superimposed spectra are displayed with 95% confidence intervals indicated by the dotted lines. The frequency ranges displaying significant power decrease or increase are marked. Right side: Band power time course calculated for the frequency bands indicated in the spectra on the left. Data are triggered according to cue-onset (vertical line). The integrated and averaged EMG shows the beginning and end of the movements. The step function indicates the significance level (sign test p from 10-2 to 10-8) for the respective power changes. The horizontal line marks the band power in the reference period. Downward deflection indicates power decrease or ERD; upward deflection indicates power increase or ERS. (Modified from Neuper C, Pfurtscheller G. Event-related dynamics of cortical rhythms: frequency-specific features and functional correlates. Int J Psychophysiol. 2001;43:41-58, with permission.) |
In addition to sensory and cognitive processing, voluntary movement also results in a circumscribed desynchronization in the upper alpha and lower beta bands, localized over sensorimotor areas (4,13,36, 37, 38, 39, 40 and 41). The desynchronization starts over the contralateral rolandic region and becomes bilaterally symmetrical with execution of movement. It is of interest that the time course of the contralateral mu desynchronization is almost identical in case of brisk and slow finger movements, and it starts more than 2 seconds prior to movement onset (42). Finger movement of the dominant hand is accompanied by a pronounced ERD in the contralateral hemisphere and by a very low ERD in the ipsilateral side, whereas movement of the nondominant finger is preceded by a less lateralized ERD (43).
Different reactivity patterns have been observed with mu rhythms in the lower and upper alpha frequency bands (44).
Different reactivity patterns have been observed with mu rhythms in the lower and upper alpha frequency bands (44).
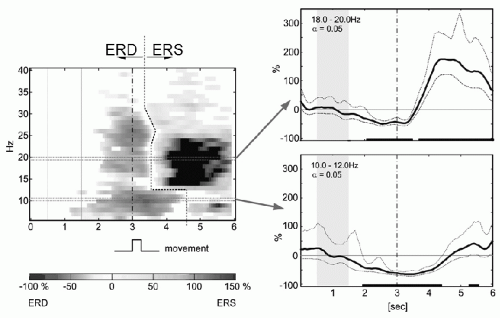 Figure 45.3 Left side: Example of an ERD/ERS time-frequency map based on an ERD/ERS analysis of partially overlapping frequency bands covering the entire frequency range of interest (e.g., 5 to 40 Hz). This ERD/ERS map is a matrix the rows of which correspond to ERD/ERS calculations for specific frequency bands. In this example, the ERD/ERS map was constructed from ERD/ERS curves with a bandwidth of 2 Hz and an overlap of 1 Hz. The trigger time point is marked by a dashed-dotted vertical line. The reference interval is indicated by two dotted vertical lines. Right side: Examples of corresponding ERD/ERS time curves for two selected frequency bands (10 to 12 and 18 to 20 Hz). |
In addition to motor preparation, also mental imagery can produce replicable EEG patterns over primary sensory and motor areas (e.g., Refs. 45, 46 and 47). This is in accordance with the concept that motor imagery is realized via the same brain structures, which are involved in programming and preparing of movements (48,49). For example, imagination of right and left hand movements results in desynchronization of mu and beta rhythms over the contralateral hand area, very similar in topography to planning and execution of real movements (Fig. 45.4) (50).
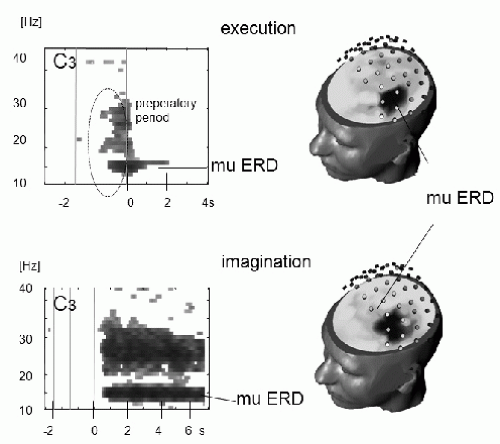 Figure 45.4 ERD/ERS time-frequency maps (left side) and topographical maps of mu ERD (right side) of a representative subject during execution (upper panel) versus imagination of a right hand movement (lower panel). Time-frequency maps are recorded from electrode position C3; time point 0 indicates movement onset and the onset of cue presentation in the execution and imagination task, respectively. |
During repeated training sessions with the motor imagery task, the pattern of contralateral desynchronization of alpha band components becomes even more pronounced, and a concomitant power increase (ERS) over the ipsilateral side can develop. These findings strongly indicate the existence of activity of primary motor cortex during mental simulation of movement. Hence, we can assume that the pre-movement ERD and the ERD during motor imagery reflect a similar type of readiness, or presetting of neural networks, in sensorimotor areas. An involvement of the primary sensorimotor cortex in motor imagery was further supported by functional brain imaging (e.g., Refs. 51, 52 and 53) and by transcranial magnetic stimulation (TMS) studies that showed an increase of motor responses during mental imagination of movements (54).
The observation that, in parallel with the contralateral ERD, movement imagination also triggers a significant ipsilateral ERS supports the concept of antagonistic behavior of neural networks (“focal ERD/surround ERS”) (55) described in the next subsection. A comparable effect, induced alpha oscillations in the hand area during foot movement, is demonstrated in Figure 45.5. It is of interest to note that the antagonistic behavior of alpha components (ERD/ERS) is a dominant feature of the upper alpha band and is not seen with lower frequency components.
INTERPRETATION OF DESYNCHRONIZATION AND SYNCHRONIZATION IN THE ALPHA BAND
Increased cellular excitability in thalamocortical systems results in a low-amplitude desynchronized EEG (6). Therefore, ERD can be interpreted as an electrophysiologic correlate of activated cortical areas involved in processing of sensory or cognitive information or production of motor behavior (56). An increased and/or more widespread ERD could be the result of
the involvement of a larger neural network or of more cell assemblies in information processing. Factors contributing to such an enhancement of the ERD are increased task complexity, more efficient task performance (22,23,57,58), and more effort and attention that may be needed in the case of some patients, elderly, or low-IQ subjects (38,59, 60 and 61).
the involvement of a larger neural network or of more cell assemblies in information processing. Factors contributing to such an enhancement of the ERD are increased task complexity, more efficient task performance (22,23,57,58), and more effort and attention that may be needed in the case of some patients, elderly, or low-IQ subjects (38,59, 60 and 61).
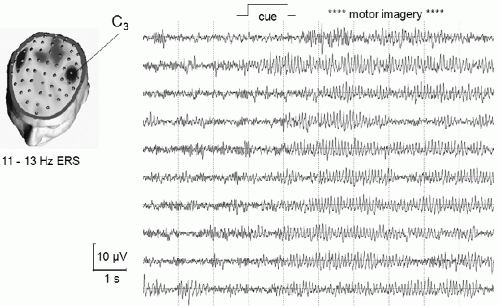 Figure 45.5 Left side: Topographic map indicating the localized 10-Hz ERS on electrode positions C3 and C4 during foot motor imagery. Right side: Examples of single EEG trials, recorded from electrode position C3, in a cue-based motor imagery experiment. Note the enhancement of mu rhythm during the imagination of foot movements. |
Explicit learning of a movement sequence, for example, key pressing with different fingers, is accompanied by an enhancement of ERD over the contralateral central regions. Once the movement sequence has been learned and the movement is performed more automatically, the ERD is reduced. These ERD findings strongly suggest that the activity in primary sensorimotor areas increases in association with learning a new motor task and decreases after the task has been learned (62). The involvement of the primary motor area in learning motor sequences was also suggested by Pascual-Leone et al. (63) who studied motor output maps by TMS.
The opposite phenomenon to desynchronization (ERD) is synchronization (ERS); in this case the amplitude enhancement is likely mediated by the cooperative or synchronized behavior of a large number of neurons. When the summed synaptic events become sufficiently large, the field potentials can be recorded with macroelectrodes not only within the cortex, but also over the scalp. To be recorded at the scalp it is necessary that cortical activity is coherent over an appreciable surface of cortical tissue (64, 65 and 66). When patches of neurons display coherent activity in the alpha band, a depressed state of active processing of information in the underlying cortical neuronal populations can be assumed to exist.
It is of interest to note that about 85% of cortical neurons are excitatory, with the other 15% being inhibitory (67). Inhibition in neural networks, however, is very important, not only to optimize energy demands, but also to limit and control excitatory processes. Klimesch (68) suggested that synchronized alpha band rhythms may introduce powerful inhibitory effects, which could act to block a memory search from entering irrelevant parts of neural networks.
Adrian and Matthews (69) described a system that is neither receiving nor processing sensory information as an “idling system.” Localized synchronization of 12- to 14-Hz components in awake cats was interpreted by Case and Harper (70) as a result of “idling cortical areas.” Cortical idling can thus denote the dynamic state of a cortical area, of at least some square centimeters, which is not involved in processing sensory input or preparing motor output (71). In this sense, occipital alpha rhythms can be considered as “idling rhythms” of the visual areas, and mu rhythms as “idling rhythms” of sensorimotor areas (72). Also sleep spindles during the early sleep stages can also correspond to a blockage of synaptic transmission through the thalamus (6).
Related posts:


Stay updated, free articles. Join our Telegram channel

Full access? Get Clinical Tree


