Electroencephalography and Evoked Potentials


Electroencephalography and Evoked Potentials


Nicolas Gaspard

Emily J. Gilmore


ELECTROENCEPHALOGRAPHY


INTRODUCTION

Electroencephalography (EEG) and evoked potentials (EPs) measure the electrical activity generated by neural structures. They allow for the functional assessment of the central nervous system and are often complimentary to imaging studies. Electrophysiologic studies are especially important to the differential diagnosis when neurologic disorders are unaccompanied by detectable alterations in brain morphology. This chapter is an overview of the current capabilities and limitations of these techniques in clinical practice.


NORMAL ELECTROENCEPHALOGRAPHY

The EEG measures electrical potentials resulting from the summation of the postsynaptic activity of cortical neurons. Although generated by cortical cells, these potentials are influenced by ascending projections from subcortical structures such in the thalamus and upper brain stem. Most commonly, the EEG is recorded with electrodes placed on the scalp. The scalp EEG presents a very low resolution view of electrical activity of the brain that favors contributions from the lateral convexities due to attenuation and blurring from overlying tissue layers.

The EEG varies greatly with the state of arousal. The main feature of the normal EEG during wakefulness in adults is the posterior dominant rhythm (PDR), also called alpha rhythm. This rhythm consists in an 8- to 13-cycle-per-second (cps) sinusoidal activity that is best observed over the parietal and occipital regions bilaterally (Fig. 25.1). In a relaxed individual, the alpha rhythm manifests with eye closure and attenuates with alerting or eye opening.


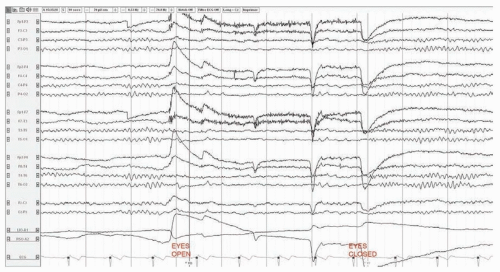
FIGURE 25.1 Normal EEG in an awake 37-year-old man. The posterior dominant rhythm attenuates with eye opening.

Sleep is divided in four stages on the basis of EEG, eye movements, and muscle activity. Stage N1, or drowsiness, is characterized by the disappearance of the posterior dominant rhythm, which is replaced by low-voltage slower activity. Sharp waves maximal at the vertex, called vertex sharp waves, also occur. Stage N2 is defined by the presence of sleep spindles (12 to 14 cps sinusoidal activity that is maximal over the central regions) but also features vertex sharp waves, K complexes (large amplitude diphasic slow waves usually brought up by auditory stimulation and often occurring in close temporal proximity to a spindle [Fig. 25-2]), and positive occipital sharp transients of sleep (POSTS; surface-positive check mark-like waveforms occurring singly or in trains in the occipital regions). Slow waves of sleep (0.5-1 cps) progressively occupy most of the recording during stage N3. During REM sleep, the EEG resembles the EEG of drowsiness, but rapid eye movements and general atonia are present. In adults, REM occurs about 90 minutes after sleep onset and thus is not usually seen on routine studies.

EEG activity undergoes major changes with age. In neonates, these changes occur on a nearly daily basis and knowledge of the conceptional age is required for proper interpretation. Sleep-wake cycles can be identified on the basis of characteristic EEG patterns that are beyond the scope of this chapter. A PDR that is reactive to eye opening becomes visible in most children by 4 months of age. With increasing age, the frequency of the PDR progressively increases, reaching 6 cps in most children at 1 year and 8 cps in
most children at 4 years. Sleep spindles appear at 2 months but do not become synchronous in most children until the age of 2 years. Normal delta activity persists during wakefulness through childhood, adolescence, and early adulthood but becomes progressively less prominent and more intermittent and restricted to the posterior regions (posterior slow wave of youth).


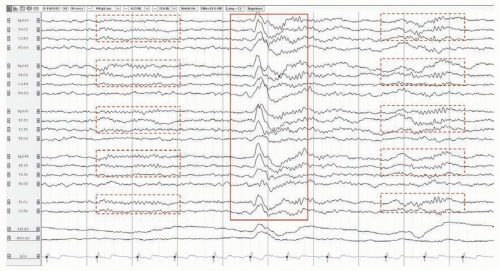
FIGURE 25.2 Normal EEG in a 25-year-old man during stage N2 sleep. Sleep spindles (dashed boxes) and K complex (solid box).


ABNORMAL ELECTROENCEPHALOGRAPHY


Epilepsy

The EEG is the most single important ancillary test for the diagnosis of epilepsy. Epileptiform discharges include spikes (< 70 ms), polyspikes, sharp waves (70-200 ms), spike-and-slow-wave complexes, sharp-and-slow-wave complexes. Other nonspecific findings in epilepsy include focal polymorphic slowing and intermittent rhythmic delta activity.

Not only can the presence of epileptiform discharges (EDs) confirm a clinical suspicion of epilepsy, but the localization and type of discharge also helps to identify the diagnosis of a specific syndrome (Table 25.1). A proper syndromic classification is paramount to ensure adequate management, as different syndromes may call for different treatments. It should be noted that EDs may occasionally be absent in a minority of patients who have epilepsy. The first routine EEG obtained after an inaugural seizure demonstrates EDs in approximately 30% to 50% of cases. This proportion increases to a maximum of 80% to 90% after the third routine EEG and subsequent EEGs do not raise this proportion further. Longer recordings, sleep recordings, and so-called activation procedures, such as hyperventilation, intermittent photic stimulation, and sleep deprivation can be performed to increase the sensitivity of the EEG.

Conversely, EDs are seen in 1% to 2% of EEGs of individuals without a history of epilepsy. This proportion is higher in children and in siblings of patients with epilepsy.

In addition to diagnosis, EEG results also help with the management of epilepsy. A finding of interictal EDs after a single seizure increase the likelihood of seizure recurrence and therefore influences the decision about whether to treat with antiepileptic drugs. Similarly, the presence of interictal EDs increases the likelihood of seizure recurrence when consideration is being given to discontinuing antiepileptic drugs after a period of seizure control. Finally, in the setting of convulsive status epilepticus, EEG can be extremely helpful in determining whether individuals with prolonged postictal cognitive impairment (usually >30 minutes) are experiencing electrographic seizures (up to 50%) or nonconvulsive status epilepticus (up to 14%).

Finally, so-called benign epileptiform variants should not be confused for bona fide EDs. These variants are physiologic activity with a somewhat sharp morphology that may resemble spikes or sharp waves but can be readily dismissed after careful inspection. This distinction is important, as it is not uncommon to encounter patients who carry a diagnosis of medically refractory epilepsy but turn out to have nonepileptic spells and in whom a normal variant has been mislabeled as an ED.


Focal Brain Lesion or Dysfunction

With the advances of brain imaging, the usefulness of EEG for the diagnosis of focal brain injury has significantly decreased. However, EEG remains the only way to assess the epileptogenic potential of a cerebral lesion. The hallmark of focal brain injury is the presence of localized nonrhythmic delta (1 to 4 cps) or theta (5 to 7 cps) activity, referred to as focal polymorphic slowing (Fig. 25.3). As a rule of thumb, delta activity is associated with more destructive lesions than theta activity. Focal attenuation of fast activity, the absence of normal alpha or beta (14 to 30 cps) activity over a region of the scalp indicates focal cortical injury. Both focal slowing and attenuation can be seen in the absence of a focal lesion (Fig. 25.4). In this case, they represent the presence of focal cerebral dysfunction as a result of a postictal state or, rarely, migraine. Lateralized periodic discharges (LPDs; also referred to as periodic lateralized epileptiform discharges or PLEDs) usually indicate the presence of an acute destructive lesion with a high epileptogenic potential, usually stroke, neoplasm, or encephalitis, as up to 85% of patients will experience seizures during the acute phase of their illness (Fig. 25.5). They
can occasionally be seen in the aftermath of a seizure in patients with chronic epilepsy or with a remote brain injury. Rarely, LPDs are associated with clinical manifestations (time-locked contralateral myoclonus, visual hallucinations, etc.).


TABLE 25.1 Electroencephalography Features of Major Epileptic Syndromes


Syndrome


EEG Features


Ohtahara syndrome


Suppression-burst pattern during sleep and wakefulness


Early myoclonic encephalopathy


Suppression-burst pattern during sleep


West syndrome


Hypsarrhythmia (highly disorganized background with arrhythmic and asynchronous high-amplitude slow waves and multifocal spikes)


Lennox-Gastaut syndrome


Slow (≤2.5 cps) generalized spike-and-wave complexes


Generalized paroxysmal fast activity


Slowed background


Benign idiopathic focal epilepsy of childhood


Focal (often bilateral independent or multifocal) sharp waves or spikes


Normal background


Childhood absence epilepsy


≥3 cps generalized spike-and-wave complexes


Normal background


Juvenile myoclonic epilepsy


≥3 cps (often up to 6 cps) generalized spike-and-wave and polyspike-and-wave complexes


Normal background


Localization-related epilepsy


Focal spikes, sharp waves, or spike-and-wave complexes


Sometimes focal polymorphic or rhythmic slow activity


EEG, electroencephalography.


Diffuse Brain Dysfunction or Injury

Toxic, metabolic, diffuse hypoxic-ischemic, and other global insults to the brain result in generalized nonspecific EEG changes. Mild encephalopathy is characterized by slowing of the posterior dominant rhythm and a generalized excess of polymorphic theta activity. With more pronounced brain dysfunction, the posterior dominant rhythm is lost and replaced by a mixture of theta and delta activity. These changes are described as generalized polymorphic slowing. In more severe cases, cerebral activity consists mostly of delta activity, which may become monotonous. At this point, reactivity to external stimulation (noise, noxious stimuli) may be lost. In the most severe forms of encephalopathy, there is attenuation (< 20 µV) or even suppression (< 2 µV) of all cerebral activity.
A suppression-burst pattern in which periods of suppression alternate with bursts of high amplitude activity, can also be seen in severe cases (Fig. 25.6). Generalized rhythmic delta activity (GRDA; often frontal and intermittent; FIRDA) is another nonspecific finding of encephalopathy, although it can be seen with lesions in the frontal lobes. Generalized periodic discharges (GPDs) are repetitive waveforms that occur either at periodic or quasiperiodic intervals of 0.5 to 3 cps. They can be encountered in any type of encephalopathy, at a moderate to severe stage, and are associated with an increased risk of seizures. Triphasic waves are a subtype of GPDs with a typical morphology (Fig. 25.7). They were initially thought to be specific of hepatic encephalopathy. They can in fact be seen in most metabolic or toxic encephalopathies and even during or after status epilepticus. A major role of the EEG in patients with acute confusion and obtundation is to identify those who suffer from nonconvulsive status epilepticus.


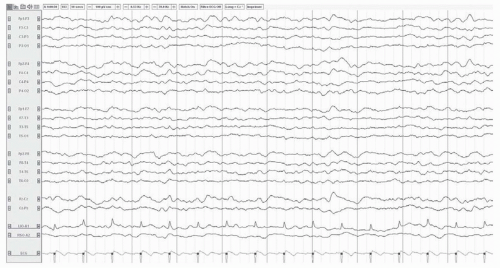
FIGURE 25.3 Diffuse slowing in a 72-year-old woman with sepsis. The posterior dominant rhythm is not visible. The background consists of admixed theta and delta activity.

Only gold members can continue reading. Log In or Register to continue

Stay updated, free articles. Join our Telegram channel

Jul 27, 2016 | Posted by in NEUROLOGY | Comments Off on Electroencephalography and Evoked Potentials

Full access? Get Clinical Tree

Get Clinical Tree app for offline access