Electromyography, Nerve Conduction Studies, and Magnetic Stimulation
Louis H. Weimer
Clifton L. Gooch
Thomas H. Brannagan III
Seth L. Pullman
INTRODUCTION
Advances in electronics enabled clinical assessment of peripheral nerve and muscle physiology in the mid-20th century, spawning the neurologic specialty of clinical neurophysiology. Electrodiagnostic techniques have become increasingly computerized and are indispensable for the proper diagnosis and management of patients with neuromuscular disease. Despite technologic improvements, a basic understanding of the principles, potential errors, and disease-specific effects are essential for meaningful interpretation and conclusions. This chapter provides a brief overview of nerve conduction studies (NCS), needle electromyography (EMG), special neuromuscular junction, and central motor function techniques.
NERVE CONDUCTION STUDIES
SENSORY AND MOTOR NERVE CONDUCTION STUDIES
NCS measure the speed and strength of an electrical impulse conducted along a peripheral nerve. Typically, the impulse is generated using a bipolar stimulator placed on the skin surface over the anatomic course of the tested nerve. The intensity and duration of this transcutaneous stimulus is gradually increased until all available axons within that nerve are depolarized, sparking an action potential that travels down the nerve to the recording site. For sensory NCS, the recording electrodes are placed on the skin surface overlying the nerve (usually over a pure sensory branch) at some distance from the stimulation site (Fig. 26.1).
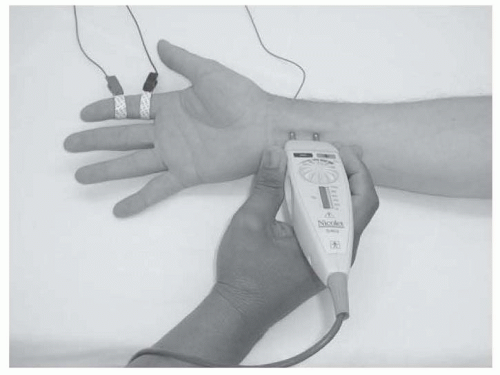 FIGURE 26.1 Setup for sensory NCS. A bipolar stimulator is placed over the median nerve at the wrist, and self-adhesive recording electrodes are placed over the median sensory branches over the index finger, ensuring that only sensory nerve responses are recorded. A self-adhesive ground electrode is placed over the dorsum of the hand. |
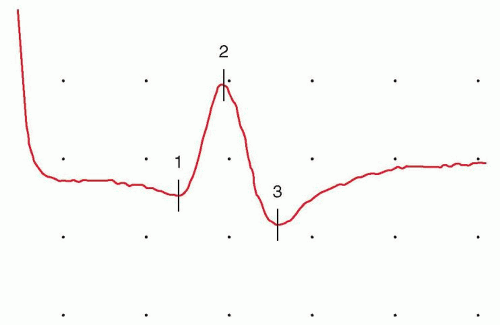 FIGURE 26.2 SNAP, recorded using the setup depicted in Fig. 16.1. The horizontal space between two dots, or graticules (one division), is assigned a specific value (the time base shown is 1 millisecond per division) to enable time measurements. Vertical divisions are also assigned a specific value to enable measurement of stimulus strength (the gain or sensitivity; 10 µV per division as shown). The time between the stimulus artifact and the waveform peak (the sensory peak latency) is 2.75 milliseconds, and the peak-to-peak waveform amplitude is 13.2 µV, within the normal range. Onset latency is needed to calculate a conduction velocity. |
When an action potential passes under these bipolar recording electrodes, a sensory nerve action potential (SNAP) waveform is recorded and displayed (Fig. 26.2). The SNAP is produced by large Ia sensory axons and not small-diameter A or C fibers.
Motor NCS are performed similarly, except that the recording electrodes are placed over the motor endplate region of an innervated muscle, rather than over the nerve itself (Fig. 26.3).
For motor NCS, the action potential passes down the nerve, triggers acetylcholine release at the neuromuscular junction, and produces muscle membrane depolarization. The recording electrodes capture the electrical potential generated by depolarization of the innervated muscle, subsequently generating a waveform known as the compound motor action potential (CMAP) (Fig. 26.4). Care must be taken to maximally but not excessively stimulate nerve axons at each stimulation site. Multiple other technical considerations can impede quality NCS and must be controlled as much as feasible, including standardized procedures, temperature maintenance, accurate electrode placement and measurement, interference avoidance, detection of anatomic anomalies, and stimulation of unintended nerves.
Although modern equipment is computerized with digital processing and storage to capture and analyze the data, the waveform display owes its origins to the cathode ray oscilloscope. By convention, the x-axis of the tracing is the time base (or sweep speed) in milliseconds, whereas the y-axis measures the impulse strength.
The waveform amplitude, measured either in microvolts (sensory waveforms) or millivolts (motor waveforms), reflects the summated number of responsive nerve axons. The time difference between the stimulus and the waveform onset, one of several measures of nerve speed, is the distal latency. Using this value and the measured distance between the stimulating and recording points, a nerve conduction velocity may be calculated for sensory nerves (m/s). Some prefer to measure the latency to the sensory waveform peak instead of the onset and to compare this value to controls. Similarly, the distal motor latency is measured from the stimulation point to the waveform onset and compared to control values; some laboratories use a standard distance from the stimulation point and the muscle to improve reliability. Because of the non-nerve-related components of the motor system including the neuromuscular junction and muscle membrane depolarization, motor NCS require additional stimulation sites to calculate conduction velocity. A waveform from a second, typically more proximal, stimulation site is captured and the time difference between the two waveforms is measured. This step subtracts out the time for the nonnerve factors and assesses only the motor nerve components. The distance between the two sites (mm) divided by the time difference (ms) provides the conduction velocity of that segment (m/s). Additional segments may be added by stimulating further sites along the nerve course. Accuracy is reduced, however, if the stimulation points are too close together. A difference of 10 cm is typical except for special circumstance, such as short-segment studies across the elbow in the assessment of ulnar neuropathy. Another consideration is the accessibility of the nerve to surface stimulation.
The waveform amplitude, measured either in microvolts (sensory waveforms) or millivolts (motor waveforms), reflects the summated number of responsive nerve axons. The time difference between the stimulus and the waveform onset, one of several measures of nerve speed, is the distal latency. Using this value and the measured distance between the stimulating and recording points, a nerve conduction velocity may be calculated for sensory nerves (m/s). Some prefer to measure the latency to the sensory waveform peak instead of the onset and to compare this value to controls. Similarly, the distal motor latency is measured from the stimulation point to the waveform onset and compared to control values; some laboratories use a standard distance from the stimulation point and the muscle to improve reliability. Because of the non-nerve-related components of the motor system including the neuromuscular junction and muscle membrane depolarization, motor NCS require additional stimulation sites to calculate conduction velocity. A waveform from a second, typically more proximal, stimulation site is captured and the time difference between the two waveforms is measured. This step subtracts out the time for the nonnerve factors and assesses only the motor nerve components. The distance between the two sites (mm) divided by the time difference (ms) provides the conduction velocity of that segment (m/s). Additional segments may be added by stimulating further sites along the nerve course. Accuracy is reduced, however, if the stimulation points are too close together. A difference of 10 cm is typical except for special circumstance, such as short-segment studies across the elbow in the assessment of ulnar neuropathy. Another consideration is the accessibility of the nerve to surface stimulation.
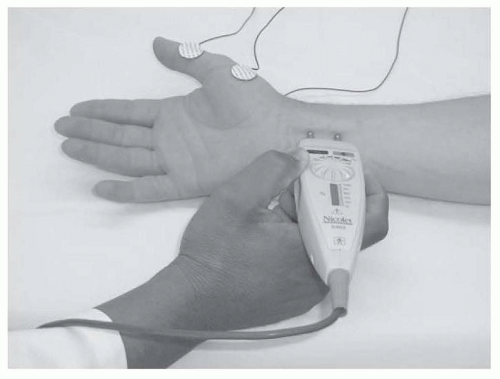 FIGURE 26.3 Setup for motor NCS. The bipolar stimulator is placed over the median nerve at the wrist and recording electrodes are placed over the median-innervated abductor pollicis brevis. The resultant muscle depolarization produces the recorded waveform. Note that sensitivities are in the millivolt, rather than microvolt, range. |
It is important to measure and control limb temperature; cold limbs influence many electrodiagnostic measures. The most significant effect is on conduction velocity, with a conduction velocity fall on average of 2 m/s/°C and latency increase of approximately 0.2 ms/°C below ideal.
Because muscle tissue is much more electrically potent than nerve fibers, the CMAP is approximately 3 orders of magnitude larger than the SNAP, and its amplitude is measured in millivolts rather than microvolts. Otherwise, latency and amplitude measures are similar to the SNAP.
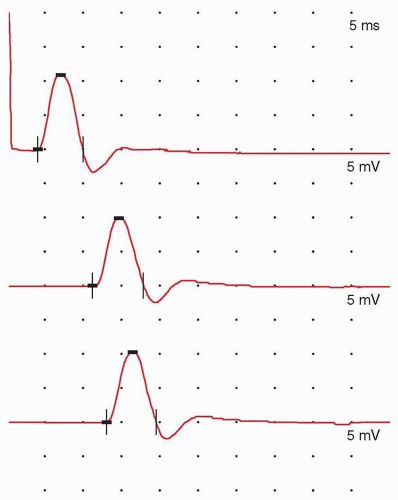 FIGURE 26.4 A CMAP. These three responses were recorded from the extensor digitorum brevis muscle of the foot following stimulation of the peroneal nerve at three different sites: the ankle (top waveform), just below the fibular head (middle waveform), and above the knee (bottom waveform). The recording sensitivity was 5 mV per division, and the sweep speed was 5 milliseconds per division. Onset latencies are 4.0, 11.1, and 13 milliseconds, respectively, predictably increasing as the distance between the stimulating and recording electrodes increases. Subtracting one onset latency from another yields the time for the impulse to travel from one stimulation point to the other. The measured distance is divided by this value to produce the segmental conduction velocity in meters per second. The amplitude is measured from baseline to peak. |
Both latency and conduction velocity depend on an intact, myelinated nerve; myelin and the saltatory conduction it fosters are essential for rapid action potential propagation. In contrast, the waveform amplitude depends primarily on the number of functioning axons within the nerve. Significant slowing of conduction velocity or prolongation of latency usually implies demyelinating injury, whereas loss of amplitude usually correlates with axonal loss or dysfunction. However, axonal loss also may mildly slow conduction velocity by eliminating the fastest conducting axons. When demyelination is severe enough, a complete block of transmission in most axons can occur; demyelination results in a loss of local current and an insufficient charge to activate the next node of Ranvier. NCS may be used to demonstrate the conduction block. In this situation, recordings made from nerve stimulation above the site of injury produce waveforms with a much lower amplitude and area than recordings made from stimulation below the site of demyelination of the same nerve. When severe enough, this loss of waveform amplitude due to block of impulse transmission in a
group of axons at a single site is known as a conduction block and is an important diagnostic feature of acquired demyelinating neuropathies (Fig. 26.5). If some but not all fibers show reduced conduction velocity without a conduction block, the increased range of velocities may produce temporal dispersion, a broadened waveform that demonstrates increased waveform duration but a lesser reduction in waveform area. Despite the fact that certain accessible nerves dominate most NCS, techniques are described for most recognized peripheral nerves; studies for uncommon procedures are performed on the basis of clinical necessity.
group of axons at a single site is known as a conduction block and is an important diagnostic feature of acquired demyelinating neuropathies (Fig. 26.5). If some but not all fibers show reduced conduction velocity without a conduction block, the increased range of velocities may produce temporal dispersion, a broadened waveform that demonstrates increased waveform duration but a lesser reduction in waveform area. Despite the fact that certain accessible nerves dominate most NCS, techniques are described for most recognized peripheral nerves; studies for uncommon procedures are performed on the basis of clinical necessity.
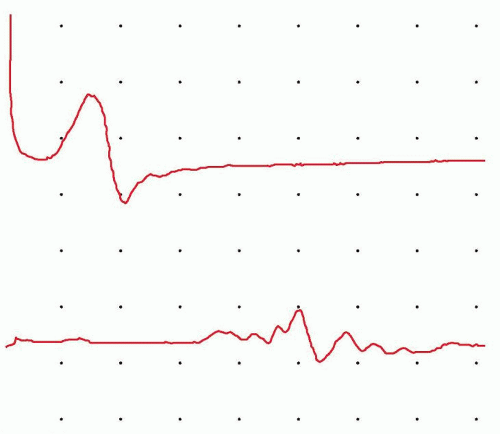 FIGURE 26.5 Conduction block with temporal dispersion. Two CMAPs recorded from the abductor hallucis muscle of the foot following stimulation of the tibial nerve at the ankle and the knee (top and bottom, respectively) in a patient with demyelinating neuropathy. The sensitivity was 1 µV per division, and the sweep speed was 5 milliseconds per division. When stimulation is moved from the ankle to the knee, the recorded waveform decreases in amplitude (from 1.1 to 0.5 mV, a 54% decline); its duration lengthens; and its morphology becomes irregular and complex. These findings suggest significant demyelination of the nerve segment between the stimulation sites, with partial conduction block. An increased range of axonal conduction times between different axons, caused by differential involvement, produces increased waveform duration as the distance between stimulation and recording sites increases (temporal dispersion). A 30% increase is considered to be significant in motor axons. |
LATE RESPONSES
Routine NCS are limited to accessible segments in the proximal and distal arms and legs. Nerve roots are not easily stimulated and long-latency reflex tests are typically used to assess these most proximal segments. When a stimulus is delivered to the distal nerve, action potentials are propagated both proximally and distally. The impulse traveling up the motor axons (in a direction opposite to the normal flow or antidromic) eventually reaches the anterior horn cells. The anterior horn cells then generate a second nonsynaptic action potential that travels back down the axon into the muscle (in the direction paralleling the normal flow or orthodromic), where it is recorded as a much smaller waveform known as the F wave, named because it was originally recorded foot muscles (Fig. 26.6).
The time required for this round trip up and down the motor nerve is measured as the F-wave minimal latency. Although pathology at any point along the nerve may prolong the F-wave latency, if normal function of the distal nerve is documented by motor NCS in the more distal nerve sites, F-wave prolongation must be the result of slowing in the proximal segment.
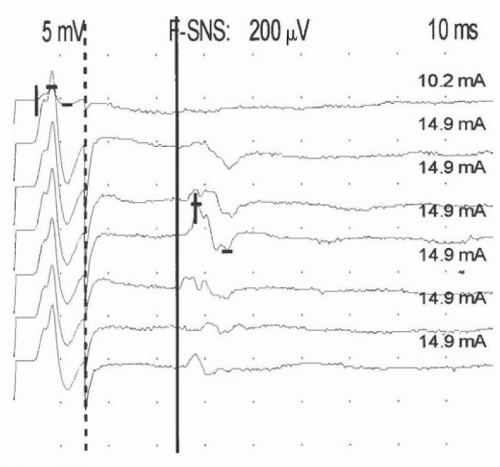 FIGURE 26.6 A series of F waves recorded from the thenar eminence following repeated median nerve stimulations in a patient with cervical radiculopathy. The screen is split with lower sensitivity (5 mV per division) to the left of the dotted line to show the full CMAPs generated by distal stimulation and higher sensitivity (200 µV per division) to the right to allow visualization of the much smaller F-wave responses. The sweep speed is 10 milliseconds per division. The dark vertical line marks the latency of the earliest F-wave potential in the group (minimal F latency). |
A different long-latency response, the H reflex (named after Hoffmann, who first described it in 1918), may be elicited in the legs by electrical stimulation of the Ia sensory nerve afferents in the tibial nerve at the knee while recording over the soleus muscle. (The type Ia sensory fiber [also called the primary afferent fiber] is a component of the muscle spindle that monitors stretch velocity.) The contraction resulting from soleus activation is analogous to the monosynaptic stretch reflex pathway elicited by testing the tendon reflex. Thus, the H reflex is the electrical equivalent of the ankle jerk reflex and aids primarily in the assessment of S1 nerve root disease and involvement of sensory fibers. In adults, the H reflex is not normally found in other muscles except for the flexor carpi radialis. F waves are present in nearly all nerves. By analyzing motor and sensory nerve conductions and long-latency responses in multiple nerves, the nature of a given neuronal injury (axonal, demyelinating, or both) and its geographic distribution may be identified, aiding in the diagnosis of neuronopathy, radiculopathy, plexopathy, mononeuropathy, and polyneuropathy.
OTHER SPECIALIZED REFLEX TESTS
Numerous other reflex tests are described and uncommonly performed. The blink reflex is one exception. This relatively simple to perform test assesses both trigeminal and facial nerve pathways. Recording electrodes are placed on the orbicularis oculi bilaterally
and the supraorbital nerve is stimulated. An ipsilateral R1 response is seen on the stimulated side only. A later R2 complex response is seen bilaterally. Differing patterns are evident in trigeminal or facial neuropathy and central pontine or medullary disease.
and the supraorbital nerve is stimulated. An ipsilateral R1 response is seen on the stimulated side only. A later R2 complex response is seen bilaterally. Differing patterns are evident in trigeminal or facial neuropathy and central pontine or medullary disease.
NEEDLE ELECTROMYOGRAPHY
BASIC CONCEPTS
Complementary to NCS is assessment of clinically relevant muscles using needle EMG. A sterile, disposable, needle recording electrode is placed directly into the selected muscle, which is then activated by voluntary contraction at differing levels of effort. Anterior horn cell action potentials propagate impulses to the end of multiple axonal branches and initiate neuromuscular junction transmission, thereby activating individual muscle fibers; normally every muscle fiber innervated by a motor neuron fires following a nerve action potential. A single motor axon with all of its multiple branches and innervated muscle fibers is known as a motor unit. The strength of a muscle contraction is determined primarily by the number of activated motor units and motor unit firing rates. The recording characteristics of the EMG needle enable live recording and analysis of individual and aggregate motor unit waveforms. Two types of electrode are most commonly used. Monopolar electrodes are flexible solid stainless steel needles coated with inert material so that only the bare tip can record activity. The reference point is typically a surface electrode on the skin. Concentric electrodes are a rigid stainless steel cannula that includes a specialized central wire. The activity is recorded from the wire and referenced to the cannula. Monopolar needles record from a larger territory, which is slightly better for spontaneous activity discussed later. Concentric electrodes record from a smaller area and are better for motor unit analysis also discussed later. Some consider monopolar electrodes to be less painful but the difference is minimal when ultrasharp disposable electrodes are used. Either electrode is acceptable for use.
INSERTIONAL AND SPONTANEOUS ACTIVITY
During the needle EMG examination, three major categories are assessed: spontaneous activity, motor unit configuration, and motor unit recruitment, including the interference pattern. Different areas of the muscle are explored to ensure a representative sample and to detect focal changes. Insertional activity is the brief burst of electrical activity provoked by the EMG needle as it moves through the muscle, generating a cluster of transient high-frequency spikes lasting from 50 milliseconds to a few hundred milliseconds. In some disorders, the insertional activity is consistently prolonged or reduced with each movement of the needle, but the distinction is often subjective and not considered by most to be diagnostic. Once needle movement has ceased, no other electrical activity should normally appear as long as the muscle remains at rest. Reduced insertional activity is present in muscle replaced by nonexcitable tissue, such as fat or connective tissue.
Muscle fibers that have lost innervation through motor axon injury or muscle degeneration or necrosis may undergo spontaneous depolarization, generating brief spikes (fibrillations) and positive sharp waves in the resting muscle; sharp waves usually fire in a regular pattern with a frequency of 0.5 to 15 Hz (Fig. 26.7). This activity is generated by individual myocytes. Waveforms similar to fibrillations normally occur at the muscle endplate region and must be distinguished; the endplate spikes also fire at faster semirhythmic rates. Also recorded at the endplate region is endplate noise, a disturbance of the baseline that correlates with miniature endplate potentials.
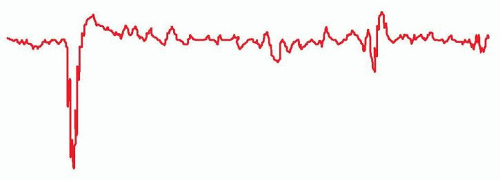 FIGURE 26.7 Spontaneous activity in a resting muscle. This tracing was recorded from the triceps muscle of a patient with cervical radiculopathy. A positive sharp wave, named for its sharp initial positive (downward) deflection, is seen on the left. On the right, a smaller triphasic fibrillation is seen. These potentials are markers of active denervation and result from the random, spontaneous depolarization of denervated single muscle fibers. |
Abnormal spontaneous activity is the hallmark of denervating axonal injury at any point from the anterior horn cell to the nerve terminal (e.g., radiculopathy, plexopathy, axonal polyneuropathy, mononeuropathy) but is also prominent in inflammatory myopathies, such as polymyositis or dermatomyositis because of isolation of section of muscle from the endplate region producing functional denervation. Lesser degrees of spontaneous activity may be observed in other myopathies with muscle fiber necrosis (e.g., myotonic dystrophy, Duchenne or limb girdle muscular dystrophy) and in some toxic, metabolic, and infectious myopathies (e.g., myoglobinuria [rhabdomyolysis] or viral myositis). Spontaneous activity typically begins to initially occur at 10 to 14 days after denervation but is more evident 3 to 4 weeks after onset and may persist for a protracted time unless that muscle fiber is reinnervated.
Related posts:

Stay updated, free articles. Join our Telegram channel

Full access? Get Clinical Tree


