Qualitative and quantitative effects of white screen and checkerboard stimulation on intracranial flow patterns of the PCA (P2-segment). General experimental procedure. Envelope curve of the Doppler frequency spectra (I), mean flow velocity (MFV) determined from consecutive heart cycles (II), continuous blood pressure recording (III), end-tidal CO2 concentration (IV) and respiratory excursions (V) registered during a 10-Hz checkerboard stimulation of a 27-year-old subject.
The present chapter will give an overview of the current understanding of the neurovascular coupling, explain basic principles of the technique of functional TCD imaging tips and steps of investigation and summarize relevant findings of clinical and physiological neurovascular coupling-based functional TCD studies. The brain activation studies are grouped in accordance with the vessel territory studied, PCA territory, middle cerebral artery (MCA) territory and anterior cerebral artery (ACA) territory. Studies are further subdivided in accordance with the type of stimulus used, that is, activation of only one sensory modality (visual, acoustic or sensory), and in studies with stimulation through associative tasks in which, in addition to sensory processing, associative centers were also involved in the task performance (e.g., viewing a picture with a complex scene, reading, tactile differentiation between different objects).
Focused questions
Is the functional TCD an appropriate tool for measuring neurovascular coupling?
What are suitable stimuli?
What are the best FV indices?
Which methodical procedure may be necessary to certainly distinguish task-related CBF velocity changes from spontaneous velocity oscillations?
How do the methodical procedures differ between PCA and MCA considering the functional cortical heterogeneity of the MCA territory and the fact that the PCA mainly supplies the visual cortex?
What are the shortest latency periods between stimulus onset and FV increase?
Physiology: physiological mechanism of neurovascular coupling
Cerebral perfusion is closely coupled to cerebral metabolism and neural activation [4,5,6]. Neurovascular coupling describes an effective, intrinsic, fast and fine-tuned vasoregulative mechanism of the brain that adapts the local CBF in accordance with the underlying neuronal activity. Historically, the term neurovascular coupling hypothesized a direct connection between the neurons and their surrounding vessels. However, it is evident that the mechanisms constituting the coupling are more complex than assumed in the classic definition and that even non-neuronal cells (i.e., astrocytes) participate in the cerebral vasoregulation [4,7].
Presently, there are three main hypotheses about the involved mechanisms of neurovascular coupling [8].
The first hypothesis assumes that activity-related shifts in ion contents (mainly potassium and hydrogen ions), related changes in energy substrates (i.e., extracellular adenosine levels) or the neurotransmitters themselves (i.e., glutamate, nitric oxide) influence the vasomotor tone [9].
The second hypothesis assumes that special interneurons mediate the flow coupling by directly ending on arterioles. The axons of these neurons project into the entire hemisphere with terminals not only on neurons but also on brain vessels. The axons secrete acetylcholine, which is an endothelial-dependent vasodilator. Recent research has shown that a certain cholinergic tonus is necessary for the synthesis of the endothelial nitric oxide synthase (eNOS); eNOS plays an important role in maintaining sufficient vasodilation in the arterioles and is also assumed to participate in neurovascular coupling [10].
The third and perhaps most popular hypothesis addresses the role of astrocytes in neurovascular coupling [4,7]. Astrocytes have a direct contact on neurons as well as endothelial cells. They are relevant for the constitution of the blood–brain barrier but also mediate the facilitated substrate uptake into the brain such as for the energy substrate glucose. Astrocytes also play an important role in the glutamate-glutamine shuttle between neurons. Recently it was shown that the neuronally released glutamate can also mediate the local blood flow via astrocytes. The functional or clinical relevance of the different mediator systems and their interplay has yet to be elucidated. However, it is well accepted that the vasodilatory effects in the microcirculation alone are not sufficient to effectively increase the local blood flow. The vasodilative signals must be back-propagated to the upstream pial arterioles on the brain surface [7] because these vessels offer the greatest resistance to flow (Figure 19.2). The adaptive processes of the vascular tone and vessel diameter are restricted on the arteriolar-microvascular level (Figure 19.3). The large basal cerebral arteries, however, do not contribute to the functionally mediated cerebral vasodilation [11].
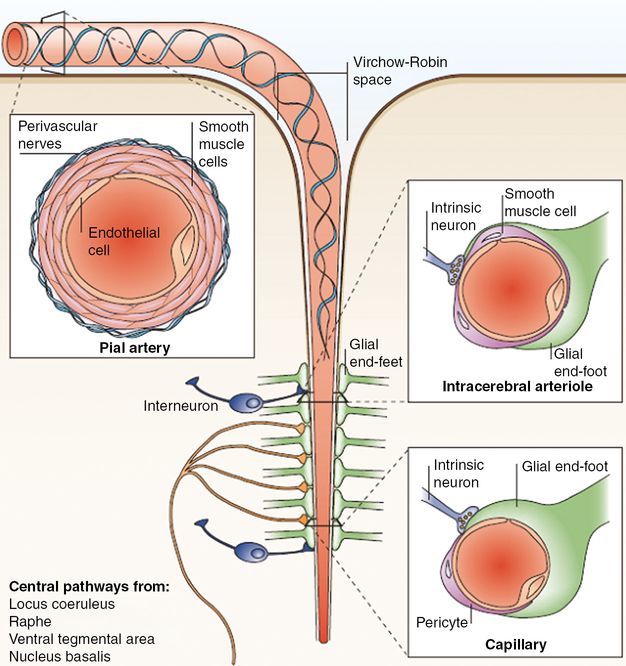
Neurons and astrocytes are in close proximity and are functionally coupled to smooth muscle cells and endothelial cells. Their interaction in the normal state and their coordinated response to injury has led to the concept that these cells constitute a functional unit, termed the neurovascular unit. Large cerebral arteries branch into smaller arteries and arterioles that run along the surface of the brain (pial arteries). These consist of an endothelial cell layer, a smooth muscle cell layer and an outer layer of leptomeningeal cells, termed adventitia, which is separated from the brain by the Virchow–Robin space. As the arterioles penetrate deeper into the brain, this space disappears and the vascular basement membrane comes into direct contact with the astrocytic end-feet (intracerebral arterioles and capillaries).
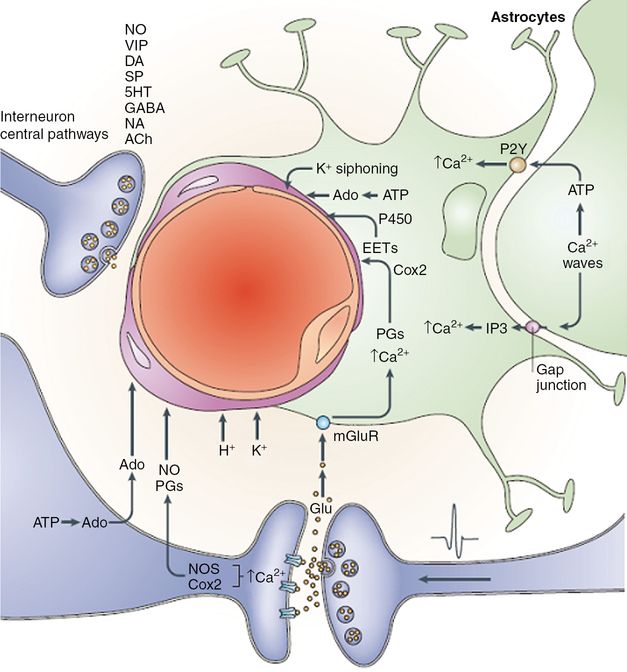
Vasoactive mediators released from neurons and glia by neural activity. Ions (H+ and K+) contribute to the extracellular currents that are associated with synaptic transmission. Adenosine (Ado) is produced through ATP catabolism. Glutamate (Glu)-induced increases in the intracellular concentration of Ca2+ in neurons and glia activate the synthesis of nitric oxide (NO), of the cyclooxygenase-2 (Cox2) products prostaglandins (PGs) and of the cytochrome P450 epoxygenase products epoxyeicosatrienoic acids (EETs). In astrocytes, the [Ca2+] increase is produced by activation of metabotropic glutamate receptors (mGluR) and by propagation of Ca2+ waves from neighboring astrocytes through activation of purinergic receptors (P2Y) or entry of IP3 (inositol (1,4,5)-triphosphate) through gap junctions. Astrocytic lipoxygenase products could also produce vasodilation by inducing NO release from endothelial cells. Spatial buffering currents in astrocytes release K+ from perivascular end-feet, where K+ conductance is greatest (K+ siphoning). Interneurons and projecting neurons with perivascular contacts release vasoactive neurotransmitters and neuropeptides, including NO, vasoactive intestinal polypeptide (VIP), dopamine (DA), substance P (SP), serotonin (5HT), GABA (gamma-aminobutyric acid), noradrenaline (NA) and acetylcholine (ACh).
Anatomy: relevant arteries for functional transcranial Doppler
The relevant arteries for functional TCD (fTCD) are the ACA, MCA and PCA which can be insonated through the temporal bone window. The ACA originates at the termination of the internal carotid artery and curves medially and slightly anteriorly toward the brain midline. Its horizontal segment, referred to as the A1- or precommunicating segment is more easily accessible than its postcommunicating A2-segment. The A2-segment has a more variable orientation, changing from a horizontal to a vertical direction. The MCA is a direct continuation and the main branch of the internal carotid artery coursing in a horizontal plane, laterally and slightly anteriorly. The initial portion of the MCA, referred as the M1-segment gives rise to the lenticulostriatal perforantes before bi- or trifurcating into the M2-segments. The M2-segments turn vertically and posteriorly into the deep portion of the sylvian fissure, where they are less accessible for the Doppler insonation. The P1-segments of the PCAs are the terminal branches of the basilar artery, which join with the posterior communicating artery from the M1-segment of the MCA giving the P2-segment of the PCA [8].
Imaging tips
Functional TCD offers a high temporal resolution; therefore, it can monitor CBF velocity in real time with high accuracy. The technique relies on the Doppler effect. Usually the transmitting and receiving elements are built into the same Doppler probe. The erythrocytes are the dominant corpuscular structures in the blood and therefore have the highest influence on the Doppler signal. The FV of erythrocytes in a vessel is not evenly distributed. Normally it has a parabolic shape with the highest FV in the center of the vessel and the lowest FV at the vessel wall. Accordingly, the reflected acoustic signals have different wavelengths.
The highest FV is obtained from the envelope curve of the Doppler frequency spectra. Although the Doppler technique measures FV rather than flow, relative FV changes can be assumed to resemble flow changes. The relationship exists because basal cerebral arteries remain constant in caliber as they do not contribute to the neurovascular coupling [7,12,13].
Flow velocity indices: mean flow velocity, peak systolic- and end-diastolic flow velocity
Because of the pulsatile characteristic of blood flow, different FV indices can be determined. The peak systolic flow velocity (PSV) denotes the FV signal from the systole, whereas the end-diastolic flow velocity describes the lowest FV signal at the end of a diastole. To give a more continuous parameter of cerebral perfusion, the mean flow velocity (MFV) has been introduced. The MFV is obtained by averaging over a cardiac cycle. When steady-state perfusion changes are of interest, the MFV is usually assumed as most appropriate.
When the FV regulation and its dynamic aspects are of interest, it should be taken into consideration that the peak systolic and end-diastolic indices are regulated differently [14]. The systolic values indicate the FV at high-pressure conditions, whereas the end-diastolic values represent the low-pressure situation. PSV is more actively regulated, whereas the diastolic parameter bears more passive properties [14]. In neuronal activation studies, the typical FV characteristics of a fast increase, overshoot and succeeding stabilization phase are very precisely to recognize in the PSV data as well as in the corresponding PSV curves [15].
Doppler probes
CBF velocity measurements should be performed with TCD monitoring probes. The Doppler probes are usually mounted on an individually fitted headband or fixed on a helmet. To avoid discomfort for the patient, too-tight fixation should be avoided. The probes should be bitemporarelly adjusted, insonating the basal cerebral arteries through the temporal bone window [8].
Steps of investigation (basics)
First fTCD studies demonstrated – as a tool for measuring neurovascular coupling – increased CBF velocities in the PCA in response to visual stimulation already years before similar studies with fMRI using the blood oxygenation level-dependent (BOLD) contrast were published [16,17,18].
Recordings and examination
CBF velocity should be recorded continuously and the envelope curve of the Doppler frequency spectra should be stored in an adequate format for off-line analysis using a sample rate of at least 25 Hz; but 100 Hz is recommended to allow for higher frequency content [8].
Patients should be examined in a separate, quiet and normal-temperature room to prevent coincidental (e.g., ringing telephone) and periodic measurement disturbances (e.g., loud tick of a clock).
Influence of blood pressure, heart rate, ventilation and arterial pCO2
In the physiological range, functional hemodynamic responses are not affected by heart rate (i.e., 60–90 beats/min) or orthostatic condition (supine, sitting, standing) [3,19,20,21]. Of more importance, unspecific influences caused by the stimulus itself should be excluded to avoid misinterpretation. Using emotionally neutral stimulation tasks, no significant changes in FV responses occur in the superior cerebellar artery, chosen as the reference vessel [2]. In the case of a task-related reaction, an unspecific change in blood pressure, blood gas level or heart rate may have resulted in a considerable FV change in all cerebral vessels. In the case of simultaneous bilateral MCA or ACA recordings, systemic influences are eliminated by calculating relative FV differences between sites of both MCAs or ACAs. In general, changes in blood pressure, heart rate or ventilation are small in passive stimulation conditions such as tactile or light stimulation (cf. Figure 19.1). In higher and complex cognitive tasks, such as mental word generation, calculation or mental rotation, a change in blood pressure and respiration may occur and should then be measured [22]. Under physiological conditions, an increase in the arterial pCO2 of 1 mmHg results in an increase in CBF velocity of about 5% [23]. Hypercapnia slows the initial upstroke in fTCD responses, whereas hypocapnia improves the speed of the initial vasoregulation [24,25].
Averaging techniques
While the principle of fTCD is a relatively simple one – in the sense that CBF velocities in the supplying arteries increase with neural activation in the corresponding brain region – a robust differentiation between the specific activation and other unrelated blood flow changes has been problematic [26]. Task-related CBF velocity changes in the MCA or ACA amount to only about 1–5% of the MFV while spontaneous oscillations amount to clearly higher values. Regarding the PCA, this limitation is not as crucial because the vessel mainly supplies the visual cortex. Regarding activation tasks in the MCA and ACA territory, the functional heterogeneity of the cortex has to be taken into consideration.
Therefore, spontaneous fluctuations related to pulsatility, heartbeat, breathing and so-called B-waves could overlay the small evoked MCA or ACA velocity signals and might provide a potential source of pitfalls. One major and very successful step to circumvent the problem of large spontaneous oscillations has been the simultaneous measurement of CBF velocity in two basal arteries and the calculation of the relative regional perfusion increase [22]. The MCAs supply approximately three-fourths of the cerebral hemispheres including the language-relevant areas. Therefore, the comparison of the CBF velocity in the MCAs provides a compound measure of functional brain lateralization.
The second major and very important step has been the application of averaging techniques [27,28,29]. Using averaging techniques, limitations and fluctuations could be effectively reduced by this heart cycle integration algorithm (Figure 19.4). Here, the relative CBF velocity changes – under stimulation conditions compared with the resting FV level – are averaged for several test repetitions to increase the signal-to-noise-ratio and to equalize spontaneous fluctuations of FVs (for details see [22,27,29]). Using these averaging techniques, FV changes as low as 1% can be appropriately detected.
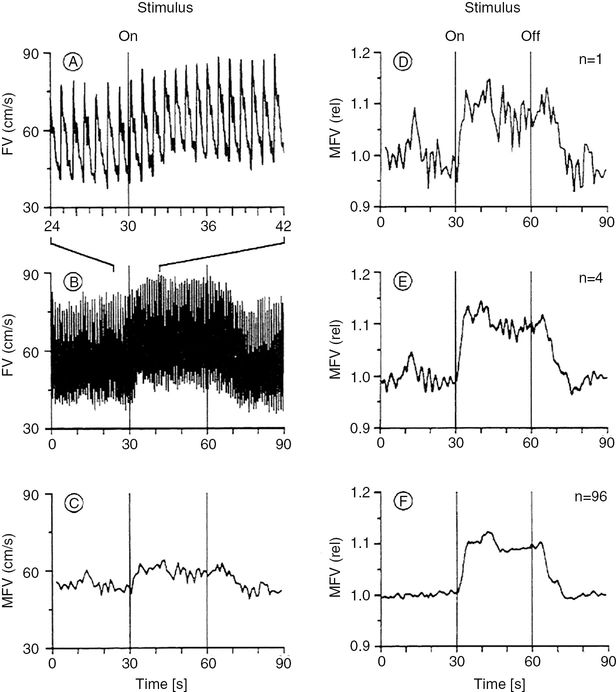
(A) Envelope curve of the TCD spectra of the right MCA during performance of a complex spatial task with the left hand. (B) Envelope curve identical to A at a different temporal resolution. (C) Mean flow velocity (MFV) changes identical to A, calculated for each heartbeat by computerized integration. (D) MFV changes identical to C normalized to 1 (one sweep). (E) MFV changes of one subject’s right MCA during the left-handed complex spatial task (four sweeps). Reference point for the summation (averaging technique) of the four sweeps was the start of the test, indicated with “ON.” (F) Mean reactive MFV changes averaged from 24 subjects with four sweeps per subject and particular test (same test set-up as in (E)). This curve was computed as follows: each subject’s four sweeps were averaged to determine the MFV changes of one individual. The resulting 24 mean curves were then averaged together to determine the overall FV changes of this particular test. The references point for the averaging technique of the curves was the start of the test, indicated with “ON.” (With kind permission of reference [22].)
Applied functional transcranial Doppler in the PCA territories
The visual cortex is ideally suited to allow fTCD recordings. Because the visual cortex is supplied almost exclusively by the P2 segment of the PCA (PCA-P2), relative FV changes in this vessel correlate with relative CBF changes in this cerebral region. Therefore visual-evoked FV increase in PCA-P2 is higher in comparison with velocity increase in MCA and ACA. Changes between rest and activation can be carried out easily by stimulating with flash light or goggles with flicker light diodes or by changing between states of closed and opened eyes.
The very first fTCD study was performed by Rune Aaslid in 1987 [2]. Aaslid assessed the FV responses in the MCA, PCA and superior cerebellar artery (SCA) in 10 volunteers stimulated by a right-angled white screen positioned at a 20° × 30° viewing angle (horizontal × vertical) and horizontal saccadic eye movements between the left and right ends of the screen. The observed average increase in the MFV was 16.4% in the PCA, 3.3% in the MCA and 1.2% in the SCA.
Conrad and Klingelhöfer [3] systematically studied the influence of stimulus complexity on the FV response in the PCA-P2. The MFV increased as the presented images grew more complex, reaching a maximum increase of 38.8 ± 6.5% for the most complex of five pictures. When the subjects focused on the center of the most complex stimulus, the resulting increase was only 19.1 ± 6.5%. These results indicate that the extent of MFV change depends on the type of stimulus as well as its complexity.
Since these first fTCD studies numerous physiological functional studies in the PCA territory have been performed using distinct features of the stimulus: sensory stimulation with white light, with colored light at different viewing angles, using brief presentation times, using different contrast, with half-field stimulation, with intermitted light. Stimulation with associative tasks using complex images, using searching tasks, during imagination or visual imagery tasks [8,16,17].
None of the studies performed up to now have demonstrated any significant side-to-side differences in visually evoked FV increase. Some activation studies have also been conducted to examine cerebral hemodynamics in pathologic conditions. These studies have focused mainly on analyzing changes in cerebral perfusion in the PCA territory during migraine attacks, in migraine patients at rest, in patients with ischemia in the region of the visual cortex, in patients with apallic syndrome, in patients with subarachnoid hemorrhage and in patients under general anesthesia [8,16,17].
Steps of investigation (specifics): typical time course of visually evoked flow velocity responses
The evoked FV responses show a typical time course with the beginning of stimulation. After a short initial time delay, FVs rapidly increase, then overshoot before they stabilize at a constant FV level (Figure 19.5A).
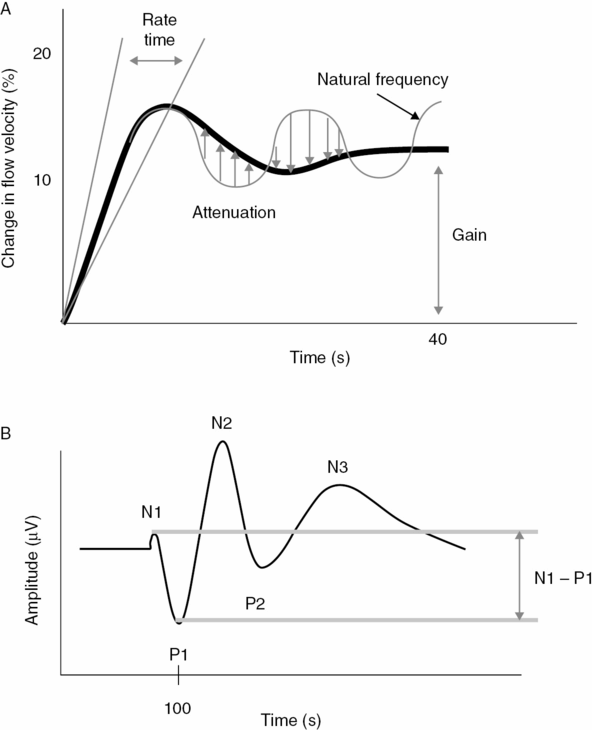
(A) Typical hemodynamic response in the PCA due to visual stimulation. The flow velocity of the resting phase is set to zero. The evoked flow velocity responses are given in relative changes in relation to baseline. With onset of stimulation, flow velocities increase rapidly, overshoot and then stabilize on a constant level. The influence of the different control system parameters is illustrated. The gain parameter describes the difference to baseline at stable flow velocity conditions, whereas the rate time describes the speed of the initial upstroke. The parameters’ natural frequency and attenuation describe the oscillating features of which attenuation describes the dampening, and natural frequency the ideal undampened oscillation of the system. (With kind permission of reference [35]). (B) Transient visual-evoked potential with the typical peaks. Usually the potential differences are specified. The early N1 – P1 amplitude difference is assumed to be generated from the primary visual cortex, whereas later amplitudes stem from higher cortical areas. (With kind permission of reference [35].)
Parameters to quantify the typical time course
Different parameters were used to quantify the visually evoked FV responses. The overshoot or the subsequent constant FV levels describe vascular properties without addressing dynamic aspects of the flow coupling [30]. Using the overshoot parameter, it has to be taken into consideration that the overshoot appears earlier in simple and later in complex stimulation tasks. In case of an earlier ending of stimulation before the overshoot has been reached, the maximal FV data reflect the aborted upregulation of the hemodynamic response but not the overshoot. To prevent misinterpretations, the stimulation duration should be longer than the occurrence of the maximal FV responses. In case of simple visual stimulation tasks, which result in smaller evoked FV changes, a higher number of stimulation cycles can be performed to increase the signal-to-noise ratio, allowing a better differentiation from spontaneous fluctuations.
Evoked FV responses decrease with a delay of 2–3 seconds to the end of a previous stimulation phase. The delay was explained by a restoration of energy levels and substrate buffers. The speed of the decrease was similar to that seen under activation [31].
Using complex visual stimuli, the overshoot appears between 8 and 12 seconds, whereas evoked FV responses stabilize at around 10–20 seconds. In general, it can be recommended that the stimulation duration should be long enough to reach stable hemodynamic conditions.
For determining the stable resting FV level before onset of the stimulation phase, we chose a 20-second resting phase and calculated the mean systolic FV level for 5 seconds before stimulation [8].
The evoked flow velocity adaptation
A relatively new approach addresses a control system approach to characterize the evoked hemodynamic FV adaptation [32]. Setting the resting FV level to zero, the dynamics of the FV regulation can be described in terms of a control system model [32]. The approach uses a second-order model with a differential and a second-times delayed proportional term.
The advantage of the control system approach is that the main hemodynamic features of neurovascular coupling could be described mathematically. Although abstract and mathematical, some parameters describe different characteristics of the hemodynamic response. The parameters are gain, natural frequency, attenuation and rate time (Figure 19.5A). The gain parameter K specifies the FV difference between the resting and stimulation phase under steady-state conditions. The parameter rate time Tv specifies the steepness of the initial upstroke of the evoked FV curve. This parameter characterizes the feed-forward properties of the system which improves the initial speed of the compensative regulatory process. The natural frequency and attenuation parameters describe oscillating features of the regulative system and represent, together with the gain parameter, the feedback characteristics of the neurovascular coupling. Whereas the natural frequency denotes oscillation as if the system were nondampened, the attenuation parameter indicates dampening in accordance with the elastic properties of the vascular system (Figure 19.5A).
The initial time delay
The temporal resolution of FV changes is linked to the length of the cardiac cycle, and it was therefore difficult for researchers to detect the shortest latency periods between stimulus onset and FV response. It has finally become possible to extend the existing rate of temporal resolution resulting from the heart rate by using a pulse-dependent triggering of the visual stimuli. In this study (Figure 19.6A) color slides of complex pictures were used to stimulate 12 healthy subjects [33,34]. Electromagnetic shutters and a quartz-controlled, pulse-triggered timer ensured a defined temporal limit to the stimuli. In these experiments, stimulus onset was triggered pulse-dependently in order to establish precisely the beginning of FV reactive changes. The electronic timer was set in such a way that the FV increase occurred in the subsequent diastole (Figure 19.6A). Using this method, it was possible to determine that the shortest latency periods between stimulus onset and FV increase varied from 520 ms to 1080 ms for each individual (Figure 19.6B). The mean shortest latency period of the whole population was 717.3 ± 190 ms. Measurements from animal experiments show similar latency periods between visual stimulation and the reactive increase of cerebral blood volume in the region of the visual cortex. The discovery of latency periods lasting <1 second shows that the control of cerebral vascular resistance – and the coupling between changes in neuronal activity and rCBF – must be regulated by rapidly acting mechanisms [7].
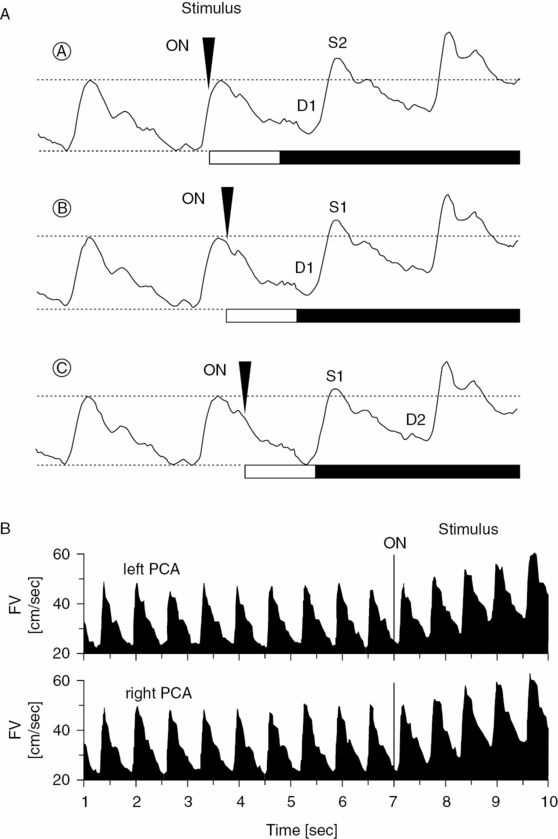
(A) Illustration of the principal procedure using a pulse-dependent triggering of visual stimuli. The relationship between stimulus onset (ON) and the subsequent diastolic (D1)/peak systolic (S1) flow velocity is adjustable through the use of a quartz-controlled, two-level, pulse-triggered timer. The optimal time for stimulus onset B is attained when the individual reaction time ends shortly before the onset of subsequent diastolic flow velocity. The stimulus onset was chosen too early in A and too late in C. (With kind permission of reference [34].) (B) Envelope curves of the Doppler frequency spectra of the P2 segments of the left and right PCA during simultaneous recording and functional activation by means of a pulse-triggered visual stimulus. The first significant flow velocity increase could be established 640 ms after stimulus onset. A significantly divergent latency between left and right hemispheres was not established. (With kind permission of reference [17].)
Combined functional TCD and electroencephalography/visual-evoked potentials
Electroencephalography (EEG) has long been used for determining visual-evoked potentials (VEPs). In most cases, contrast-based pattern reversal stimulation is performed. Using lower pattern reversal frequencies, the typical transient VEP waveform occurs (Figure 19.5B). Since EEG allows continuous monitoring of cortical activity it is possible to apply frequency analysis techniques to correlate between cortical activity and fTCD [35]. Together with a simultaneous EEG recording, the relationship of the electric neuronal as well as vascular responses of the coupling could be investigated. An advantage of this combined EEG-Doppler approach is that both techniques do not interfere with each other. Using pattern reversal stimuli (i.e., checkerboard patterns), contrast-induced VEP could be simultaneously recorded with the resultant hemodynamic responses, which gives the opportunity of an in-detail investigation of the neuronal as well as vascular side of the neurovascular coupling and their relationship. A close correlation between VEP amplitudes and evoked FV responses (gain parameter) was found [36].
An important exception of the close coupling between neuronal and vascular responses exists in case of stimulating with different fixed frequencies of the visual stimulus. It is a result of the averaging techniques in VEP recordings. At higher flicker frequencies around 5–7 Hz, the VEP change from a transient to a steady state configuration, whereas the evoked FV responses show a progressive increase in amplitudes up to 13–14 Hz. One possible explanation might be that the VEP underlies a complex vector integration of differently oriented source vectors from the entire occipital cortex, whereas fTCD integrates all hemodynamic changes in the PCA territory. Detailed considerations for simultaneous EEG/VEP recordings in visual stimulation paradigms are given in [8,35,36].
Topcuoglu et al. [37] evaluated the effect of aging, gender and eye (sighting) dominance on the relationship between visual-evoked FV changes and VEP. The results confirmed a decreased visual-evoked flow response in relation with advancing age. Weakened correlation of visual-evoked flow response and VEP amplitudes along with a significantly decreased defined coupling index found in the elderly subjects supported an age-related disturbance of vasoneural coupling [37].
Literature review: actual functional TCD studies in the territory of the PCA
The aim of an actual study by Yonai et al. [25] was to investigate whether the potent vasodilator agent, acetazolamide (AZ), inhibits the neurovascular coupling, which also requires vasodilation. Therefore, visually evoked flow parameters were examined in 10 healthy subjects before and after AZ administration. To compare the visually evoked FV changes before and after AZ, relative FVs were calculated in relation to the proper baseline value (baseline before (BLbef) or after AZ (BLaft)). Repeated-measures ANOVA did not reveal significant group effects between the visually evoked relative FV time courses before and after AZ, indicating that relative FVs during visual stimulation were not significantly different before and after AZ provocation. The group with time of measurement interaction, however, was significant, which means that the pattern of FV changes was different before and after AZ. Figure 19.7 shows that the steepness of the flow velocity increase was more pronounced before than after AZ provocation. The maximal increase was 23 ± 4% before and 19 ± 4% after AZ administration; this difference disappeared when the FV became stable. These results suggest that maximal cerebral vasodilation cannot be determined by the clinically accepted dose of AZ (15 mg/kg) and prove that neurovascular coupling remains preserved despite AZ-induced vasodilation. Our observation indicates independent regulation of vasodilation during neurovascular coupling, allowing the adaptation of CBF according to neuronal activity even if other processes require significant vasodilation [25].
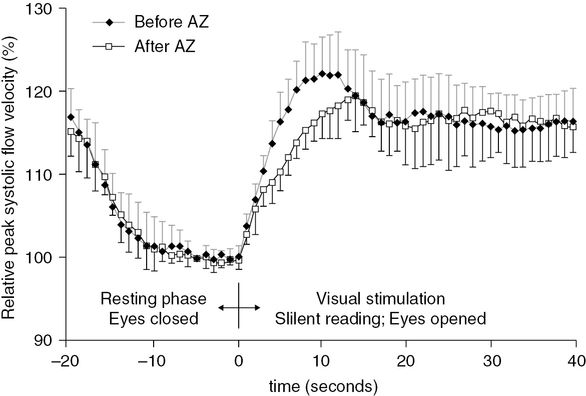
Relative peak systolic flow velocity time courses, measured during the visually evoked flow tests, before and after acetazolamide (AZ) administration. Relative flow velocities were calculated in relation to the proper baseline value (baseline before (BLbef) or after AZ (BLaft)). Repeated-measures ANOVA did not detect significant group (i.e., before and after AZ) main effect between the relative flow velocities during visual stimulation before and after AZ provocation. Error bars indicate standard deviations.
Related posts:


Stay updated, free articles. Join our Telegram channel

Full access? Get Clinical Tree


