Ischemic Stroke Intervention
Etiology
Ischemic stroke affects 500,000 to 700,000 patients annually in the United States.1 The most common etiologies of ischemic stroke are large-artery atherosclerosis (20–30%) cardiac (20–30%), small-vessel or lacunar stroke (20–30%), and cryptogenic stroke. Risk factors associated with atherosclerotic stenoses include hyper-tension, diabetes, hyperlipidemia, and family history. Stroke risk can be stratified through the presence of symptomatology and degree of stenosis (Table 16.1). It is generally thought that atherosclerotic lesions cause stroke through plaque rupture, local platelet aggregation, and finally artery-to-artery embolism. Critical stenoses can lead to cerebral hypoperfusion, resulting in watershed area strokes. Other abnormalities caused by vasculopathies, disorders of coagulation, and systemic conditions can also lead to stroke (Table 16.2).
Large-artery atherosclerotic stenosis of the intracranial vessels (ICAD), most commonly through hypoperfusion, is thought to cause 8–10% of ischemic strokes in the United States, an even higher risk for stroke than cervical stenosis, most often in Asian and African Americans. Symptomatic patients with >50% ICAD have approximately a 10% annual risk of ischemic stroke, even when treated with an appropriate antiplatelet agent. This risk increases to 22% in the first year in patients with >70% stenosis and stroke.2 Atrial fibrillation is the most common cause of cardioembolic stroke, which varies significantly depending on the presence of other comorbid conditions (hypertension, age) and ranges from 2–10%. Other important causes of cardiac embolism are valvular disease, heart failure, and congenital cardiac anomalies. Lacunar infarctions most often occur in the distribution of the perforator arteries of the circle of Willis, commonly as a result of lipohyalinosis, and they are commonly associated with chronic, poorly controlled hypertension. Lacunar infarctions cause dense neurological deficits, due to high density of white matter in small volumes of tissue (<1 cm, brainstem, basal ganglia, and thalamus).3 Other, less common causes of ischemic stroke include arterial dissection, hypercoagulable states, genetic mutations of the mitochondria and enzymes of glycolysis, and fibromuscular dysplasia. A more extensive review of these and other etiologies is beyond the scope of this text.
Symptomatology | Stenosis severity | Stroke risk |
Asymptomatic | >60%3 | 2% annual4 |
Symptomatic* | 50–69% | 4% annual |
Symptomatic* | >70%3 | 13% in the first year after first stroke/TIA5 |
*Symptomatic usually involves neurological changes or transient ischemic attacks (TIAs).
Major etiology of stroke | Specific mechanisms |
Embolism | Atherosclerosis, vasculitis, moyamoya, FMD, connective tissue disease, dissection, infection, cardiac tumor/thrombus, arrhythmia, paradoxical cardiac embolism |
Hypoperfusion | Cardiac failure, congestive heart failure, cardiac arrhythmia, medication overdose, infection, shock, extra/intracranial vascular disease/stenosis |
Focal occlusion | Atherosclerosis of small vessels, vasculitis, vaso-spasm, angiopathies, arteritis, coagulopathies or hypercoagulable states of multiple causes, platelet dysfunction |
Abbreviation: FMD, fibromuscular dysplasia.
Diagnosis
History
The medical history and physical examination taken in the setting of acute stroke, possibly requiring intravenous or intra-arterial thrombolysis, are very different from those taken when evaluating other types of neurological disease. Time is of the essence! The history obtained must be brief and highly focused. The confirmation of an event compatible with an acute vascular event and the time of symptomatic onset are the most crucial pieces of information, as they determine not only the possibility but also the kind of therapy, such as intravenous or intra-arterial thrombolytics or mechanical thrombolysis (see below).
Physical Examination
The physical examination of an acute stroke patient being evaluated for possible endovascular treatment is based on the National Institutes of Health Stroke Scale (NIHSS),6 a quick, fifteen-item scoring system that includes criteria regarding level of consciousness, attention, cranial nerves, and motor, sensory, cerebellar, and language functioning (Table 16.3). If patients have an NIHSS score greater than 10, it is suggestive of large-artery occlusions, with an 80–90% sensitivity and specificity (Fig. 16.1).4,5
In the subacute or chronic phase of ischemic stroke, the modified Rankin scale (MRS) can be used to measure the degree of global disability or dependence in patients (Table 16.4).4,5 In addition to a thorough neurologic assessment, auscultation of the carotid arteries for bruits and an examination of the heart for murmurs (e.g., valve abnormalities) and arrhythmias are also necessary.
Table 16.3 National Institutes of Health Stroke Scales (NIHSS)
Level of consciousness | 0–3 points |
Orientation | 0–2 points |
Responses to commands | 0–2 points |
Eye movements | 0–2 points |
Visual fields | 0–3 points |
Facial motor activity | 0–3 points |
RUE motor activity | 0–4 points |
LUE motor activity | 0–4 points |
RLE motor activity | 0–4 points |
LLE motor activity | 0–4 points |
Sensory function | 0–2 points |
Limb ataxia | 0–2 points |
Articulation | 0–2 points |
Language | 0–3 points |
Neglect | 0–2 points |
Abbreviations: LLE, left lower extremity; LUE, left uppper extremity; RLE, right lower extremity; RUE, right upper extremity.
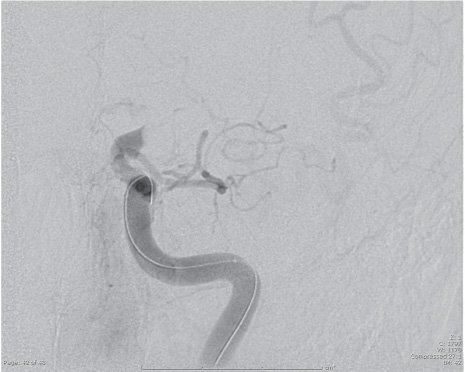
Fig. 16.1 Carotid terminus occlusion.
Table 16.4 Modified Rankin Scale
0 | No symptoms. |
1 | No significant disability. Able to carry out all usual activities, despite some symptoms. |
2 | Slight disability. Able to look after own affairs without assistance, but unable to carry out all previous activities. |
3 | Moderate disability. Requires some help, but able to walk unassisted. |
4 | Moderately severe disability. Unable to attend to own bodily needs without assistance and unable to walk unassisted. |
5 | Severe disability. Requires constant nursing care and attention, bedridden, incontinent. |
6 | Dead. |
Laboratory Studies
Basic laboratory studies, including serum creatinine, glucose, platelet count, and coagulation studies, should be sent immediately (Table 16.5). Because waiting for the results of these tests can delay possible intervention more often than neuroimaging will, they should therefore be prioritized.
Imaging
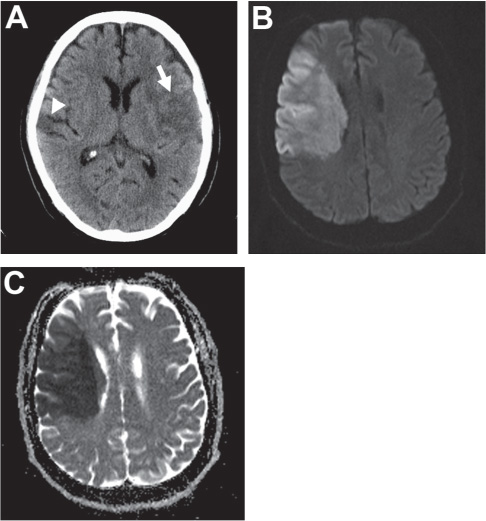
Computed tomographic (CT) imaging is usually the most readily available and economical mode of acute stroke imaging. Non-contrast imaging allows rapid differentiation between ischemic and hemorrhagic stroke. It is able to detect ischemia with a sensitivity of 65% and specificity of 90% after 6 hours of stroke onset but appears normal in over one third of patients with acute ischemia.7–9 Early ischemic changes are also weakly correlated with poor outcome after IA chemical thrombolysis. These changes include blurring of the gray-white junction in the cortex or basal ganglia and/or subtle sulcal effacement in the ischemic territory. In large-artery occlusive stroke, it is sometimes possible to identify a linear or circular hyperdensity corresponding to the thrombosed artery (hyperdense to middle cerebral artery [MCA]/basilar artery [BA] sign or hyperdense dot sign). When a large (>1/3 MCA territory or complete brain stem) area of hypodensity is noted, thrombolysis should not be attempted (Fig. 16.2). A CT angiogram (CTA), which should span from the aortic arch to the vertex, can also confirm the presence and location of large-artery occlusions (Fig. 16.2A). This imaging adds little time to the study when it is performed on a modern multi-detector scanner, but it can save significant time in the angiography suite by focusing the angiographer on the vessel in question. CTA has up to a 98% sensitivity and specificity for large-artery occlusion.10 One concern over the routine use of contrast CT scans in acute stroke patients is dye-induced nephropathy. However, Josephson et al. found only a 0.37% incidence of dye-related renal failure among 1075 patients with acute stroke.11 Further, newer generation contrast agents with higher relaxivities allow lower contrast loads and are associated with lower incidences of nephrotoxicity.
Table 16.5 Laboratory and Alternative Imaging Orders Under Consideration for Patients with New Onset Ischemia
Laboratory or diagnostic test | Reason for investigation; alternatives |
Laboratory |
|
Basic metabolic panel, including glucose and A1C | Metabolic abnormalities, uncontrolled diabetes |
Lipid profile and hepatic function profile, including ammonia | Dyslipidemias, hepatologies causing coagulopathies, encephalopathies |
Complete blood count with differential; platelet function | Hematologic abnormalities, platelet dysfunction, infection, systemic conditions |
Coagulation profile | Coagulopathies, medication effects or therapeutic levels |
Arterial blood gas | Pulmonary/renal exchange pathology |
Cardiac enzyme profile | Cardiac injuries or dysfunction |
Erythrocyte sedimentation rate (ESR) and C-reactive protein levels | Infection, inflammatory states |
Antinuclear antibody (ANA) | Connective tissue disorders |
Homocysteine | Systemic vascular disease |
Diagnostic |
|
Electrocardiogram | Cardiac arrythmias |
Transthoracic echocardiogram | Valvular dysfunction, PFO; may need transesophageal echo to identify arch abnormalities if unable to visualize |
Carotid duplex ultrasound | Extracranial stenosis |
Lower extremity Dopplers | Deep venous thromboses |
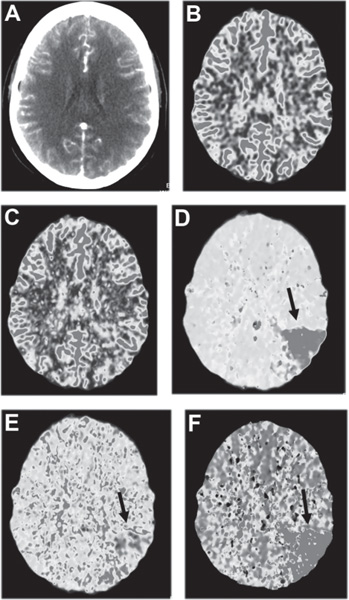
Perfusion imaging, an emerging area of acute stroke imaging, allows differentiation between normal tissues, those at risk for progression to infarct (the ischemic penumbra), and infarcted tissues (the ischemic core). CT perfusion (Fig. 16.3) has been shown to determine areas of hypoperfusion, cerebral blood volume, and time-to-peak measures as markers of tissue viability.12 Intervention criteria based on time-based measurements (mean transit time and time-to-peak) using CT perfusion are currently being determined. MR perfusion studies have been shown to be a quantitative tool to determine cerebral blood flow and can be used to determine the utility of intervention. It has been shown in a small case series that the zone of hypoperfused tissue (salvageable ischemic penumbra) immediately surrounding the DWI abnormality (infarcted tissue) in acute stroke can be returned to a state of normal perfusion with intraarterial recanalization.13 Setting thresholds for core and penumbral tissue has been a major issue in MRI-guided interventional stroke therapy. The development of this modality is at a more advanced stage than CT, and its utility is being tested in the NIH-funded MR REcanalization of Stroke Clots Using Embolectomy (MR RESCUE) trial.
The analysis of clot composition is another potential application of MRI technology to acute stroke intervention. The gradient echo vessel susceptibility vessel sign (GRE-SVS) has been shown to be a very sensitive and specific marker of intravascular thrombus. The intensity of signal on this sequence relates to the amount of paramagnetic deoxyhemoglobin present within red cells and therefore can give some indication of whether the thrombus is composed predominantly of red cells and fibrin (red clot) or is more likely to represent a well organized, platelet-rich thrombus (white clot). Red clot is generally thought to be more susceptible to chemical thrombolysis; therefore, one might select this intraarterial modality in the case of a large-artery occlusion that demonstrated a high GRE-SVS signal. On the other hand, white clot (a low GRE-SVS signal thrombus) may require mechanical disruption or extraction. The preliminary studies testing this hypothesis have been mixed.14
Additional Testing
Once all possible acute treatment has been provided, the focus shifts to identifying the etiology of stroke and therefore preventing recurrence. Transthoracic and/or transesophageal echocardiography is performed to look for vegetations, mural thrombus, valve abnormalities, cardiomyopathy, akinetic or hypokinetic segments, and intracardiac shunt. Transthoracic studies are noninvasive and effective at evaluating the left ventricular system, while the transesophageal route is invasive and is preferred for the evaluation of the left atria.14,15 Carotid duplex Doppler ultrasonagraphy may be used to assess quickly and inexpensively carotid stenosis or dissection if no arterial imaging was performed in the acute phase. Continuous cardiac monitoring (such as telemetry or Holter monitoring) is useful in identifying occult arrhythmias. A fasting lipid profile is performed to evaluate patients for hypercholesterolemia. A hemoglobin A1C is obtained in diabetics to assess the degree of long-term blood glucose control. If stroke occurs in the young and in patients with a strong family history of cerebrovascular disease or a history of venous coagulopathy (for example, deep vein thrombosis), with or without imaging suggestive of venous infarct, the patients should undergo a coagulation work-up. This typically includes the screening laboratory tests listed in Table 16.6.
Related posts:

Stay updated, free articles. Join our Telegram channel

Full access? Get Clinical Tree


