Polysomnography: Technical and Clinical Aspects


Polysomnography: Technical and Clinical Aspects


Sudhansu Chokroverty

Rodney Radtke

Janet Mullington


Polysomnography (PSG) is the single most important laboratory technique for assessment of sleep and its disorders. PSG consists of recordings of multiple physiologic characteristics during sleep, whereas polygraphy indicates the recording of similar characteristics at any time during the day. An understanding of the importance of the laboratory evaluation of sleep and its disorders has been evolving slowly, but in the last century great advances have been made in this direction. The discoveries of the human electroencephalogram (EEG) by Berger (1) in 1929 and rapid eye movements (REMs) during sleep by Aserinsky and Kleitman (2) in 1953 are the real driving forces behind this understanding. In 1974, Holland and his colleagues (3) during a presentation at the 14th annual meeting of the Association of the Psychophysiological Study of Sleep (later named American Sleep Disorders Association, which was finally changed to the American Academy of Sleep Medicine [AASM]) coined the term PSG. This chapter is divided into several parts: The initial part includes a brief review of the historical milestones, functional neuroanatomy of sleep, physiologic changes emphasizing those pertinent to overnight PSG interpretation and clinical relevance as well as homeostatic and circadian factors, and functions of sleep. Next we deal with laboratory procedures including PSG recording and scoring techniques, indications for PSG, video PSG, ambulatory and computerized PSG, artifacts during PSG recording, and pitfalls of PSG. We then discuss clinical considerations, briefly describing clinical presentation, diagnosis, and treatment but mainly focusing on PSG findings in common sleep disorders as well as sleep-related movement disorders and neurologic disorders, and sleep-related epilepsies. The final part addresses related laboratory procedures for assessment of sleep including multiple sleep latency test (MSLT), maintenance of wakefulness test (MWT), and actigraphy.


HISTORICAL MILESTONES

In 1875, Richard Caton (4), an English neurophysiologist, first recorded electrical activities from rabbit and monkey brains. It was, however, Hans Berger (1), an Austrian psychiatrist, who in 1924 first obtained electrical activities from the scalp surface of a 17-year-old young man with a skull defect and published his findings in 1929. Although sleep was known since antiquity, brain activities in sleep could not have been recorded before the discovery of EEG. It was in 1937 that Loomis and his colleagues classified sleep into five stages (A-E) based on the EEG activities during the deepening stages of sleep (5). It is interesting to note that Kohlschutter (6,7), a 19th century German physiologist, thought that sleep was deepest in the first few hours and became lighter as time went on, and he also described the varying arousal thresholds throughout the night. The REMs of sleep were not known in those days. In 1953, Aserinsky and Kleitman (2) obtained characteristic REMs during sleep using surface electrodes over the eye lids. Over the 4-year period, Loomis and his colleagues (5) published 12 papers, describing the oscillating nature of EEG along with five distinct stages of sleep as well as arousals manifested by increased body movements and respiratory effort. In 1957, Dement and Kleitman (8) described sleep evolving through non-rapid eye movement (NREM) and REM sleep states in a cyclic manner throughout the night. All the components of REM sleep, however, have not been described by them until Jouvet and Michel (9) in 1959 observed markedly decreased muscle tone during REM sleep in cats. In 1961, Berger (10) recorded markedly decreased muscle tone from extrinsic laryngeal muscles during human REM sleep. In order to standardize the scoring of different stages of sleep, an ad hoc committee led by Rechtschaffen and Kales (R-K) (11) in 1968 produced the now-famous sleep scoring technical manual (The R-K Scoring Technique). This remained the “gold standard” until the AASM published the AASM Manual for the Scoring of Sleep and Associated Events (12), which modified the R and K technique and extended the scoring rules. The R and K sleep scoring manual (11) was devised only for normal sleeping adults, but later infant sleep scoring manual was developed. R and K sleep scoring technique is based on three physiologic characteristics: EEG, electro-oculography (EOG), and electromyography (EMG). PSG, however, includes more than just sleep staging, and other physiologic characteristics such as respiration, limb muscle activity, blood oxygen saturation, electrocardiogram (ECG), body position, snoring, and other special recordings have been incorporated, which are described later in this chapter. Since the discovery of REM sleep, dream was thought to be associated with REM sleep during 80% of the time. In 1868 Griesinger (13) suggested that dreaming was associated with eye movements and in 1895, Freud (14) indicated that dreaming was associated with relaxation of the major muscles of the body. Amazingly, centuries ago (ca. 1000 BC), Upanishads (15), the ancient Indian text of Hindu religion, sought to divide human existence into four states: the waking, the dreaming, the deep dreamless sleep, and the superconscious (“the very self”). This is reminiscent of modern classification of three states of existence.


FUNCTIONAL NEUROANATOMY OF SLEEP

The control of sleep is quite complex. Whereas for the most part during the whole sleep period we are in an unconscious state, changes occur that are physiologically quite distinct. During slow wave sleep, the cortical neurons fire in relative synchrony, producing what is described as slow wave sleep, so named after the polygraphic pattern of this brain activity. During REM sleep, the eyes show phasic, rapid conjugate movements, whereas at the same time skeletal muscle tone is at its lowest levels. Brain activity during REM sleep is rapid and desynchronous, almost like waking, which is why it is also referred to as “paradoxical sleep.”


ASCENDING AROUSAL SYSTEM

There are two major branches to the ascending arousal or reticular activating system (ARAS) (16). One is an ascending pathway from pedunculopontine (PPT) and laterodorsal tegmental (LDT) nuclei to the reticular nucleus and thalamic relay nuclei in the thalamus. These thalamic relay neurons transmit signals to the cortex. Neurons in the PPT and LDT fire most rapidly during REM and wakefulness, and are at their most inactive state during NREM.

The second branch of the ARAS comes from locus coeruleus (LC), dorsal and median raphe nuclei, periaqueductal gray matter, and tuberomammillary neurons. Cortical input goes through lateral hypothalamic neurons and basal forebrain neurons. The neuron groups in the two branches of the ARAS are shown in Figure 41.1 along with their respective neurotransmitters (17).

The Hypocretin (Orexin) peptidergic system (18) located in the lateral hypothalamic and perifornical regions with its widespread ascending and descending projections is thought to play an important role in the control of arousal and wakefulness. A reduction of activities of the hypocretin projections to the LC, midline raphe, mesopontine, and posterior hypothalamic and tuberomedullary regions will cause sleepiness.


REM-Generating Neurons

The existence of REM sleep-generating neurons in the pons has been proved by transection experiments in cats through different regions of the midbrain, pons, and medulla (19) (Fig. 41.2). A transection of the pontomesencephalic (A) and pontomedullary (B) junctions produced an isolated pons that shows all the signs of REM sleep (see Fig. 41.2). There are mainly two animal models available to explain the mechanism of REM sleep. McCarley-Hobson (20) reciprocal interaction model based on reciprocal interactions of REM-on and REM-off neurons is the earliest and most well-known model. A reciprocal interaction in the brainstem between REM-on neurons (the cholinergic pedunculopontine tegmental and LDT nuclei in the pontomesencephalic region) and REM-off neurons (the aminergic LC and dorsal raphe [DR] nuclei) is responsible for REM generation and maintenance. The role of gamma-aminobutyric acid (GABA) in the REM sleep generation has been emphasized in the latest modification of the reciprocal interaction model by McCarley (20). Lu and co-workers (21) described a “flip-flop” switch interaction model in rats between GABAergic REM-off neurons in the deep mesencephalon, ventral periaqueductal gray, and lateral pontine tegmentum, and GABAergic REM-on neurons in the sublaterodorsal (SLD) nucleus (equivalent to perilocus coeruleus alpha in the cat) and the dorsal extension of the SLD named precoeruleus to explain REM sleep mechanism. Ascending glutamatergic projections from precoeruleus neurons to the medial septum are responsible for the hippocampal EEG theta rhythm during REM sleep. Muscle atonia during REM sleep is related to descending glutamatergic projections from the ventral SLD directly to the spinal interneurons inhibiting spinal ventral horn cells by both glycinergic and GABAergic mechanisms. Cholinergic and aminergic neurons play a modulatory role in this model and are not part of the “flip-flop” switch. Brooks and Peever (22) recently challenged the glycinergic and GABAergic neurochemical mechanisms of REM motor atonia based on experimental evidence in rats that REM atonia persisted even when glycine and GABA receptors were blocked. These authors suggested that multiple biochemical pathways are responsible for controlling muscle tone in REM sleep.


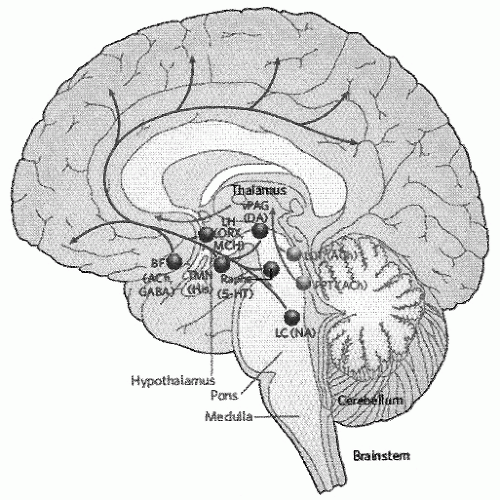
Figure 41.1 The ascending arousal system. Two major pathways are shown. One (shown in light gray) providing upper brainstem input to the thalamic-relay nuclei and to the reticular nucleus of the thalamus coming from the pedunculopontine and laterodorsal tegmental (PPT/LDT) nuclei, which are acetylcholine (ACh)-producing neuronal groups. The second major group of neurons (shown in dark gray) come from the noradrenergic (NA) locus coeruleus (LC), serotoninergic (5-HT) dorsal and median raphe nuclei, dopaminergic (DA) periaquiductal gray matter (vPAG), and histaminergic (His) tuberomamillary neurons (TMN). Additional cortical input merges from the basal forebrain (BF) neurons containing GABA or ACh, and by lateral hypothalamic (LH) peptidergic neurons that contain melanin-concentrating hormone (MCH) or orexin (hypocretin) (ORX). (Reproduced from Saper CB, Scammell TE, Lu J. Hypothalamic regulation of sleep and circadian rhythms. Nature. 2005; 437:1257-1263, with permission.)


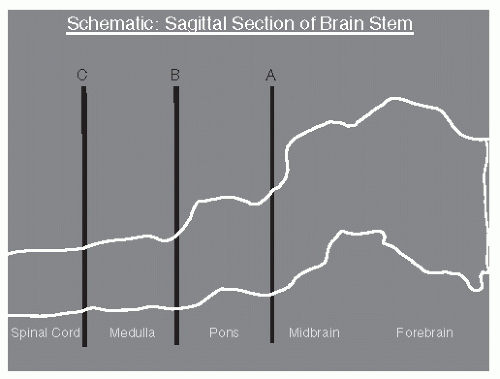
Figure 41.2 Schematic sagittal section of the brainstem of the cat. A: Junction of midbrain and pons. B: Junction of pons and medulla. C: Junction of medulla and spinal cord. (Reproduced from Chokroverty S. Sleep Disorders Medicine: Basic Science, Technical Considerations and Clinical Aspects. 3rd ed. Philadelphia: Saunders/Elsevier; 2009, with permission.]


Anatomical Substrates for NREM Sleep

NREM sleep-generating neurons are located primarily in the ventrolateral preoptic area (VLPO) of the hypothalamus, the basal forebrain area as well as the solitary nucleus region of the medulla. The reticular nucleus of the thalamus is thought to be responsible for sleep spindle generation. Both passive and active mechanisms play a role in the generation of sleep. The contemporary theory (23) for the mechanism of NREM sleep suggests a reciprocal interaction between two antagonistic neurons in the VLPO region of the anterior hypothalamus and wake-promoting neurons in the tuberomammillary nuclei of the posterior hypothalamus and the hypocretinergic neurons in the lateral hypothalamus, as well as the LC, DR nuclei, basal forebrain, and mesopontine tegmentum. The extended VLPO input to LC and DR is thought to be involved in regulating REM sleep. Reciprocal interaction between sleep-promoting neurons in the region of the solitary nucleus and the wake-promoting neurons within the ARAS of the brainstem independent of the reciprocal interaction of the neurons of the forebrain also plays a minor role in the generation of NREM sleep. It has been suggested that adenosine, a neuromodulator, may act as a physiologic sleep factor modulating the somnogenic effects of prolonged wakefulness (24).


PHYSIOLOGIC CHANGES DURING SLEEP

A vast number of physiologic changes take place during sleep in humans, affecting almost every system in the body (Table 41.1) (25). It is important to have a basic knowledge about these changes during sleep and how they affect various sleep disorders. These changes may be documented in the Polysomnography. A case in point is obstructive sleep apnea syndrome (OSAS) causing dramatic changes in the respiratory control of the upper airway muscles during sleep, directing our attention to a very important pathophysiologic mechanism and the therapeutic intervention for this disorder. These physiologic changes are most commonly noted in the respiratory, cardiovascular, gastrointestinal, and endocrine systems. Respiration is controlled by the automatic or metabolic and behavioral systems complemented by the third system known as the arousal system or the system for wakefulness stimulus. These respiratory systems receive inputs from various peripheral and central neural structures to maintain acid-base regulation and respiratory homeostasis. The location of the respiratory neurons makes them easily vulnerable to a variety of neurologic disorders, particularly those involving the brainstem. Some conditions may affect control of breathing only during sleep, causing undesirable, often catastrophic, results including cardiorespiratory failure or even sudden death. The two control systems (metabolic and voluntary) are active during wakefulness, but during NREM sleep, the voluntary system is inactive and respiration is entirely dependent upon the metabolic controller. The behavioral mechanism is probably responsible for controlling breathing, at least in part during REM sleep. Tidal volume and alveolar ventilation decrease during sleep. Arterial oxygen tension is slightly decreased and arterial carbon dioxide tension is increased during both NREM and REM sleep. Hypoxic ventilatory response is impaired in NREM sleep in adult men but not in women. Hypoxic ventilatory response during REM sleep is significantly decreased in both sexes. Hypercapnic ventilatory response is also decreased during NREM and further decreased during REM sleep. Thus, ventilation is unstable during sleep and few periods of apneas may occur particularly at sleep onset and during REM sleep in normal individuals. Respiratory homeostasis is thus relatively unprotected during sleep, making those individuals with intrinsic respiratory disease, such as chronic obstructive pulmonary disease (COPD) or bronchial asthma, highly vulnerable for respiratory failure during sleep.

As a result of increased parasympathetic and decreased sympathetic activity during sleep, heart rate, blood pressure, cardiac output, and peripheral vascular resistance decrease during NREM sleep and decrease still further during REM sleep. In REM sleep, however, there is an intermittent activation of the sympathetic nervous system accounting for rapid fluctuations in blood pressure and heart rate. Cardiac output falls progressively during sleep and the greatest decrement occurs during the last sleep cycle, particularly during the last REM sleep cycle early in the morning. This may explain why normal individuals and patients with cardiopulmonary disease are most likely to die during the early morning hours. Cerebral blood flow and cerebral metabolic rates for glucose and oxygen decrease during NREM sleep but increase to that of the waking values during REM sleep. Because of these hemodynamic and sympathetic changes during REM sleep during the last third of the sleep cycle in the early hours of the morning, there could be increased platelet aggregability, plaque rupture, and coronary arterial spasms possibly triggering thrombotic events causing myocardial infarction, ventricular arrhythmias, or even sudden cardiac death. These circadian variations in cardiovascular and cerebrovascular events with the highest rates of events occurring during the early morning hours have been documented by meta-analysis of epidemiologic studies.


Table 41.1 Physiologic Changes during Wakefulness, NREM Sleep, and REM Sleep


Physiology


Wakefulness


NREM Sleep


REM Sleep


Parasympathetic activity


++


+++


++++


Sympathetic activity


++


+


Decreases or variable (++)


Heart rate


Normal sinus rhythm


Bradycardia


Bradytachyarrhythmia


Blood pressure


Normal


Decreases


Variable


Cardiac output


Normal


Decreases


Decreases further


Peripheral vascular resistance


Normal


Normal or decreases slightly


Decreases further


Respiratory rate


Normal


Decreases


Variable; apneas may occur


Alveolar ventilation


Normal


Decreases


Decreases further


Upper airway muscle tone


++


+


Decreases or absent


Upper airway resistance


++


+++


++++


Hypoxic and hypercapnic ventilatory responses


Normal


Decreases


Decreases further


Cerebral blood flowa


++


+


+++


Thermoregulation


++


+


Gastric acid secretion


Normal


Variable


Variable


Gastric motility


Normal


Decreases


Decreases


Swallowing


Normal


Decreases


Decreases


Salivary flow


Normal


Decreases


Decreases


Migrating motor complex (a special type of intestinal motor activity)


Normal


Slow velocity


Slow velocity


Penile or clitoral tumescence


Normal


Normal


Markedly increased


a There is, in general, global decrease in cerebral blood flow with regional variation during NREM sleep, but this is not homogeneous. It may not decrease in some areas and may even show phasic increase in certain areas.


NREM, non-rapid eye movement; REM, rapid eye movement; +, mild; ++, moderate; +++, marked; ++++, very marked; +, absent.


Reproduced from Chokroverty S. Sleep and its disorders. In: Bradley WG, Daroff RB, Fenichel GM, et al., eds. Neurology in Clinical Practice. Philadelphia: Elsevier; 2008:1960, with permission.


There are profound changes in endocrine secretions during sleep. There is a pulsatile increase of growth hormone during NREM sleep in the first third of the normal sleep period. Prolactin secretion also rises 30 to 90 minutes after sleep onset. Cortisol secretion is inhibited by sleep, whereas thyroid-stimulating hormone reaches a peak in the evening and then decreases throughout the night. Testosterone levels in men increase during sleep, rising from low levels at 8 PM to peak levels at 8 AM, but there is no clear relationship noted between levels of gonadotrophic hormones and sleep-wake cycle in children or adults. Melatonin, the hormone of darkness released by the pineal gland, reaches its highest secretion level between 3 AM and 5 AM and then decreases to low levels during the day. Thermoregulation is maintained during NREM sleep, but it is nonexistent in REM sleep. Body temperature begins to fall at sleep onset and reaches its lowest point during the third sleep cycle.


Homeostatic and Circadian Factors and Functions of Sleep

The normal sleep-wake rhythm is controlled by both the circadian and the homeostatic systems. The circadian system is entrained by the normal light-dark cycle and the hormone controlling the circadian timing of physiologic systems is the pineal hormone, melatonin. Bright light suppresses melatonin and it is released during the dark phase. Human circadian rhythm has a cycle close to 24 hours (24.2). The paired suprachiasmatic nuclei (SCNs) of the hypothalamus above the optic chiasm serve as the master biologic clock. SCN receives afferent information from the retinohypothalamic tract sending signals to multiple synaptic pathways including other parts of the hypothalamus and the pineal gland where melatonin is released. Remarkable progress including identification of many genes and their protein products within the circadian clock in both
fruit flies (Drosophila) and mammals has been made (26). Dysfunction of the circadian rhythm results in several important sleep disorders including delayed sleep phase syndrome and advanced sleep phase syndrome.

During wakefulness, it is thought that a build up of some sleep factor, or process “S,” occurs and is burnt off or dissipated at night through sleep (27). In the morning after waking, cognitive and physiologic functioning takes a while to get to a full waking state due to an inertia from the sleep system (28). The wake system takes a while to fully prime and synchronize all components for optimal output. This mechanistic framework has explanatory utility and does a reasonable job of providing a framework for much of the physiologic and cognitive data. Notably, the concept of homeostasis is exemplified by the finding of recovery sleep following a period of sleep deprivation that is intensified with respect to slow wave activity. This suggests that physiologic systems need slow wave sleep and therefore attempt to catch up for what was lost by intensifying and lengthening the sleep bout as well (29).

The function of sleep remains the greatest biologic mystery of all times. Sleep is essential and sleep deprivation leads to impaired attention and decreased performance in addition to sleepiness. Sleep is thought to have restorative, conservative, adaptive, thermoregulatory, and consolidative functions, as well as maintenance of synaptic and neuronal network integrity. Recent scientific data have strengthened the theory that memory reinforcement and consolidation take place during sleep.


SLEEP ARCHITECTURE

The term “sleep architecture” refers to the pattern of sleep stages that cycle through the night in what is referred to as the REM-NREM cycle. During development, there are changes that occur in the general pattern of sleep stages, but the adult shows a pattern of stages N1, N2, and N3 followed by REM sleep, and the periodicity of this REM-NREM cycle throughout the night is generally 90 to 120 minutes in duration. The first REM period of the night is very often brief and may even be missed in young healthy sleepers.

During infancy, the sleep-wake cycle is approximately 50% dominated by REM sleep, and the sleep pattern involves frequent napping through the day. As the infant matures, there is a consolidation of sleep into the night period. During infancy, the mother’s melatonin rhythm is conveyed to the infant through breast milk, helping to consolidate the sleep period into the nocturnal dark phase. The last sleep to be given up during the day period is generally the afternoon nap.


POLYSOMNOGAPHIC TECHNIQUE

In 2007, the AASM (12) published a new manual for the scoring of sleep and associated events, almost 40 years after the first consensus on the technical standards for the field was published by Rechtschaffen and Kales in 1968 (11). The AASM has a Web site (http://www.aasmnet.org/) with links to resources for sleep medicine clinicians, scientists, technical personnel, and laboratory managers, and to several position papers.


TECHNICAL PERSONNEL

The hiring of technologists who are mature and competent and highly motivated is a critical step in the operations of a sleep laboratory. A feeling of trust between the patient and technologist is very important for sleeping in an unusual environment because electrodes and other devices attached to the body can put the patient in a somewhat uneasy state. Coupled with the fact that they are in the laboratory for reasons of disturbed sleep and/or wakefulness, and that continuous positive pressure may be tested, even on their first night in the laboratory, it is very important that they have a trusting professional interaction with the technologist.

In addition to professionalism, maturity, and excellent bedside manner, the technologist needs to be able to function well at night, and, as much as possible, maintain a consistent shift. Frequent rotations from night to day lead to stress and result in unnecessary sleep loss and misalignment of biologic rhythms. This can in turn lead to impaired performance and mood dysregulation.

Technologists chosen for performing diagnostic and treatment initiation sleep recordings frequently have full EEG technician training and/or training as a respiratory therapist. In addition, they require well-supervised training in specialized polygraphic recording methods and in visual sleep staging, including identification and classification of arousals, leg movements, and respiratory disturbance. Technologists are responsible for the maintenance of equipment and for the identification and fixing of technical problems at night during a recording if they should arise. Although most recordings are now performed with commercially available digital systems, the technologists still need to quickly and correctly identify problems and swap out parts as necessary. Therefore, they need to be able to make sure that adequate supplies and back up equipment are available. The “American Association of Sleep Technologists” has developed standards of training, practice, and certification for registration of technologists in North America (http://www.aastweb.org/).


SETTING: EQUIPMENT AND RECORDING ROOM

A report for the technologist including the patient’s presenting symptoms and reason for the referral needs to be provided. The technologist should also have access to list of medications and other information pertinent to the care of the patient through the night in the laboratory. It is most common for patients to be studied outside of a hospital setting, but even within the hospital setting, it is important for the technologist to have explicit instructions for when and whom to call with respect to critical levels of oximetry, abnormal ECG, or other medical needs of the patient. As in any hospital ward setting, it is not desirable for a technologist to work alone, without any back up personnel immediately available, for safety reasons.

The equipment and technologist are usually housed in a room separate from that of the sleeping subject. Rather than an institutional-like bedroom, it is preferable for the patient to have an environment that is as home-like as possible, with a comfortable
mattress, a closet, and night stand. The sleeping room should be quiet and sound attenuated so that noises from outside the sleep laboratory and technologist’s area do not disturb the sleeping patient. An intercommunication system for contact with the patient is essential. Toilet facilities should preferably be attached to the bedroom and a shower should also be readily available.

Patients are generally asked to report to the laboratory facility 1 to 3 hours before their normal bedtimes. They are shown their room and the facility around to let them know they are appropriate. The technician asks them to change into their bed clothes and then they begin to attach the electrodes and recording devices. The technologist turns lights out after he/she conducts a test of the equipment and performs biologic calibrations. Biologic calibrations enable the technologist to demonstrate to the individual, who subsequently will review the recording, the normal waking eye movement pattern, and pattern of gritting teeth, breathing deeply, coughing, and pointing and flexing the toes and feet. All of these need to be documented by the technologist at the outset of the recording, and when lights are turned off for the night, the technologist must document the time, in the recording.


THE ELECTRODE SETUP


EEG

Sleep EEG has always been based on the standard “international 10 to 20 EEG system” derivations originally defined by Jasper in 1958 (30). According to the most recent AASM scoring guidelines (12), the recommended EEG derivations for sleep include scalp EEG derivations (from the frontal, central, and occipital regions) linked to the left mastoid (M1) or right mastoid (M2). Recommendations for sleep stage discrimination are F4-M1, C4-M1, and O2-M1 with back up electrodes placed at F3, C3, O1, and M2 to allow for re-referencing to F3-M2, C3-M2, and O1-M2 if there are problems that develop over the course of the recording with the right hemisphere selections. An alternative montage for stage scoring is Fz-Cz, Cz-Oz, and C4-M1 with back up electrodes Fpz, C3, O1, and M2. The EEG is the most important physiologic information for the determination of sleep stages. Of course, for studies where epileptic discharge during sleep is under investigation, additional electrodes would be included depending on the brain regions of interest.


EOG

For routine EOG, the AASM scoring manual (12) recommends referential recordings from each outer canthus (1 cm below the left and 1 cm above the right) to the ipsilateral mastoid. These derivations show horizontal out-of-phase potentials very well, which are used in the identification of REMs associated with REM sleep. EOG electrodes should be attached with soft tape made for use on skin, and they should be never attached with collodion-soaked gauze because of the potential for corneal damage and also because collodion becomes inflexible when dry, so not only itchy and uncomfortable but prone to lifting and coming off during sleep. A micropore surgical tape maintains good contact for more than 48 hours of continuous recording and can be easily trimmed to needed dimensions. Tape width is usually twice the diameter of the electrode and about 5 to 8 cm along the wire. A length of tape added at right angles over the end of the first tape helps anchor the latter. A high-frequency filter of 35 Hz is used to reduce EMG artifact on the tracing. The low-frequency filter is generally selected at 0.3 to 0.5 second (time constant) and permits recording of both the slow rolling eye movements of drowsiness and the REMs of REM sleep.


EMG

Mylohyoid muscle EMG is recorded with electrodes placed on the skin, secured with flexible sticky tape. It is recommended that three electrodes be attached, one electrode positioned midline just above the inferior rim of the mandible and two other electrodes each 2 cm below the inferior edge of the mandible, to the right and left. The technologist can in this way select the bipolar combination of electrodes giving the best tonic EMG. Pairs of electrodes have also been used on the jaw edge or over the masseter muscles to record axial muscle tone (31,32). There is a great deal of variability in the resting chin tone EMG level that is related to adipose tissue and age, and therefore it is important that the technologist adjusts the EMG amplification such that the background level during drowsiness shows some baseline elevation so that transition into sleep and particularly REM is easily discernable.

In addition to submental EMG, muscle activity is routinely recorded from the legs to document leg muscle activation. These extra long electrodes are placed on the anterior tibialis muscles, again fixed with soft flexible skin tape such as micropore, and need to be well fixed with tape so that they don’t come off with normal leg movements during sleep.


ECG

A single lead that is modified from lead II used in clinical cardiology is used to monitor the heartbeat during sleep, with an electrode placed on the right subclavicle area and left torso over the lower ribcage beneath the heart. Standard EEG electrodes may be used, but ECG electrode applications are preferable in that they are more resistant to artifact. Heart rate, extrasystoles, and other arrhythmias can be monitored using this lead, but due to differences in sampling rate and amplifier characteristics, this tracing is not suitable for detecting PQRST complex abnormalities.


RESPIRATORY MONITORING

The measurement of respiration during sleep is critical to the diagnosis of sleep disorders and includes chest and abdominal excursion, most often using inductance plethysmography or sometimes strain gauges, and also a means of assessing nasal airflow. Syndrome definitions and measurement techniques are described for sleep-disordered breathing in an AASM task force report (33), and a more recent guidelines to the classification and scoring of respiratory events was published in the AASM Manual for the Scoring of Sleep and Associated Events in 2007 (12).

Careful monitoring of both upper airway airflow and thoracoabdominal movement in the respiratory tracings is used to categorize central, mixed, and obstructive sleep apnea (OSA), which is further discussed later. In addition, the monitoring and
quantification of blood oxygen levels are necessary and accomplished using pulse oximetry. Endoesophageal (intrathoracic) pressure recording is also sometimes used in the detection of partial obstructions or upper airway resistance that can exist without actual apneas or hypopneas. The nasal pressure transducer (NPT) is recommended for the measurement of subtle reductions in airflow and can also be used in the identification of absent airflow, characteristic of apnea.


Airflow


Upper Airway Exchange: Thermistors, Thermocouples, and Pressure

Upper airway exchange can be monitored by thermistor resistance fluctuations or by thermocouples, both sensitive to temperature changes of air passing in and out through the mouth and nostrils. Both of these sensors are attached under the nostrils and can also be designed or applied with an additional sensor pointing to the mouth, they are useful for documenting mouth breathing. Thermistors generally use a ceramic or polymer material and detect temperature changes based on a Wheatstone bridge using DC voltage. Thermocouples are constructed of dissimilar metals (e.g., constantin and copper) that generate a potential in response to temperature change and are therefore thermoelectric generators. They can be connected directly to the plug-in box and used with AC voltage for recording.


Nasal Flow Using Nasal Airway Pressure

Nasal flow can be monitored using a simple cannula, typically used to deliver oxygen, attached to a pressure transducer and may be recorded using very low-frequency filters with AC or DC amplifiers. This technique is more informative and reliable than thermistors and thermocouples and is a recommended method for the detection of hypopneas (12). With appropriate filtering of the slow component to reveal the vibration signal using an AC amplifier, nasal pressure can also be used to record snoring. The primary concern in using nasal pressure exclusively to measure upper airway flow is that the signal may drop due to mouth breathing. However, additionally a simple oral thermistor/thermocouple can be used to resolve this problem. The pressure transducer can also be used during continuous positive airway pressure (CPAP) titration to monitor respiratory waveform and mask leak.


CAPNOGRAPHY

Capnography refers to the monitoring of the concentration of carbon dioxide (CO2) in the respiratory gases and is measured in the breath at the end of complete expiration (end tidal). A CO2 analyzer is sometimes used to document CO2 retention in sleep-related respiratory disorders, especially COPD and hypoventilation syndromes.


END TIDAL CO2

End tidal CO2 refers to the measurement of the CO2 in the air exhaled from the lungs, and the normal range is 4% to 6% (equivalent to 35 to 45 mm Hg).


PNEUMOTACHOGRAPHY

This technique is rarely used in diagnostic testing because it involves the placement of an airtight mask on the face and uses a pressure transducer system to measure flow rate, tidal volume, and other respiratory variables. This method is adopted frequently in the sleep testing laboratory during CPAP pressure titration in order to monitor adequacy of pressure and flow (see Nasal Pressure heading above).


RESPIRATORY EFFORT


Piezoelectric Strain Gauges

Thoracoabdominal movement is frequently monitored with piezoelectric crystal sensors incorporated into bands that are fitted around the torso at the level of the chest and abdomen. Generally these sensors can be plugged directly into the headbox and connected to the AC amplifier. Respiratory excursion is monitored and the traces are used in detecting reductions in breathing effort, but it does not produce a measured signal, rather only a relative one.


Inductance Plethysmography

Inductive plethysmography uses wire coils placed around the chest and abdomen, sometimes woven into a vest, to monitor separate movements and then add them together, mimicking total spirometric volume. In contrast to the piezoelectric belts, this measuring technique is not only adjusted for visual characteristics of the wave but also calibrated before the sleep period begins. It produces a measured output for chest movement, abdominal movement, and total volume. This system has an advantage in being able to clearly distinguish paradoxical breathing associated with obstruction in contrast with central cessation of breathing that is reflected in a loss of signal in all three tracings.


INTERCOSTAL EMG

Long electrode leads are sometimes applied on the lower back intercostal muscles to aid in the detection of effort during breathing and the placement is sensitive to muscle activity during coughing.


SNORING MONITOR

In addition to the NPT method mentioned earlier in this chapter, both piezo sensors (encased in a rubber disk attached to the throat and plugged into the headbox) and microphones are used to monitor snoring. Snoring is associated with reduced upper airway diameter, and bursts of loud guttural inspiratory snorting are signs of OSA.


INDIRECT MEASUREMENT OF BLOOD GASES


Transcutaneous (TcCO2) Measurement

Transcutaneous (TcCO2) measurement is the measurement of CO2 gas tension of tissue underlying a specialized electrode that is usually placed on the chest or forearm. The electrode method
uses a Stow-Severinghaus glass/ceramic electrochemical sensor, with a small heater unit to facilitate blood flow. Transcutaneous monitoring of CO2 tension is more reliable than transcutaneous measurement of O2 because CO2 diffuses better through the skin.


Finger Oximetry for Oxygen Saturation

Standard polygraphic diagnostic recording must include monitoring of an index of blood oxygen saturation or the percentage of available circulating hemoglobin that is saturated with oxygen (SaO2). Probes are easily attached to the finger with a specially designed clip or with tape. Measurement is achieved using an optical device that uses a DC channel involving computation of absorption of certain wavelengths of light.


BODY POSITION

Body position is the useful information to have when interpreting a pattern of respiratory disturbance and can be obtained visually through infrared camera monitoring and/or with the aid of a position sensor. Such sensors are available and can be attached to respiratory bands with accurate output of information including prone, supine, right side, and left side.

Table 41.2 lists appropriate filter settings for recording various physiologic characteristics in the PSG.


SLEEP STAGING CRITERIA

In 1968, the publication of the sleep scoring atlas by Rechtschaffen and Kales (11) represented the consensus agreement between sleep researchers of the time to the scoring of sleep stages. Remarkably, this document remains the dominant force in sleep scoring and analysis. With the recent publication of the AASM Manual for the Scoring of Sleep and Associated Events, the standardization of sleep and event scoring has reached a new level of consensus (12). The scoring of sleep in this recent document varies only limitedly from that published in 1968 (11).

The nomenclature of sleep stages has changed with the recent AASM scoring manual with NREM stage 1 now called stage N1, and NREM stage 2 is now stage N2. What had previously been NREM stages 3 and 4 (or slow wave sleep) is now unified into a single stage N3. Stage REM is now labeled as stage R.


Table 41.2 Filter Settings for PSG Recordings


Characteristics


High-Frequency Filter (Hz)


Time Constant (second)


Low-Frequency Filter (Hz)


Sensitivity


Electroencephalogram


70 or 35


0.4


0.3


5-7 µV/mm


Electro-oculogram


70 or 35


0.4


0.3


5-7 µV/mm


Electromyogram


90


0.04


5.0


2-3 µV/mm


Electrocardiogram


15


0.12


1.0


1 µV/cm to start; adjust


Airflow and effort


15


1


0.1


5-7 µV/mm; adjust


A sleep study is scored in 30-second epochs with each stage labeled as stage W (or wakefulness), stage N1, stage N2, stage N3, or stage R. If two or more stages coexist in an epoch, the epoch is labeled as the stage that represents the greatest portion of the epoch. Stage W represents the waking state ranging from full alertness through early drowsiness. Stage W is scored when more than 50% of the epoch demonstrates alpha frequency activity over the occipital region (Fig. 41.3). Stage W is scored in the absence of alpha activity (which occurs in 10% to 20% of individuals) if eye blinks, reading eye movements, or irregular conjugate REMs are identified with accompanying normal or elevated chin muscle tone. The chin EMG during stage W is variable but is usually higher than that seen during sleep stages.

Stage N1 represents late drowsiness and light sleep. It is scored when greater than 50% of an epoch shows alpha attenuation and is replaced by low amplitude, mixed frequency EEG activity (Fig. 41.4). K-complexes and sleep spindles are absent by definition. If an individual does not generate alpha activity, stage N1 is scored when over 50% of the epoch demonstrates theta range slowing (4 to 7 Hz), vertex sharp waves, or slow eye movements. In individuals who do generate alpha activity, slow eye movements are frequently seen before the disappearance of alpha activity, so individuals who do not generate alpha activity may have stage N1 scored slightly earlier than those who do generate alpha activity. During stage N1, chin EMG is variable but usually lower than that seen in stage W.

Stage N2 represents the predominant sleep stage during an overnight recording and is scored when there is the appearance of a K complex or sleep spindle (Fig. 41.5). In sleep medicine, a K complex is defined as a biphasic negative sharp wave maximum at the vertex or frontal regions that lasts greater than 0.5 second. Sleep spindles are 11 to 16 Hz sinusoidal activity lasting at least 0.5 second seen maximally in the central head region. Less than 20% of an epoch of stage N2 can be delta activity (<2 Hz, >75 µV in amplitude). Stage N2 is scored from the first epoch of stage N2 until a clear epoch of stage W or another stage of sleep is identified. Although eye movements are usually absent in stage N2, slow eye movements can sometimes be seen. Chin or axial EMG is variable but usually lower than stage W.

Stage N3 (which encompasses both former stages 3 and 4 of R and K criteria (11)) is the deepest stage of sleep and is

associated with increasing delta activity. Stage N3 is scored when 20% or greater of an epoch is delta activity (Fig. 41.6). For the purposes of sleep scoring, delta activity is defined as activity of 0.5 to 2 Hz that is at least 75 µV in amplitude when measured over the frontal or central regions. Sleep spindles may persist into stage N3, but eye movements are usually absent. Axial EMG is usually lower than stage N2 and may approach that seen in stage R.


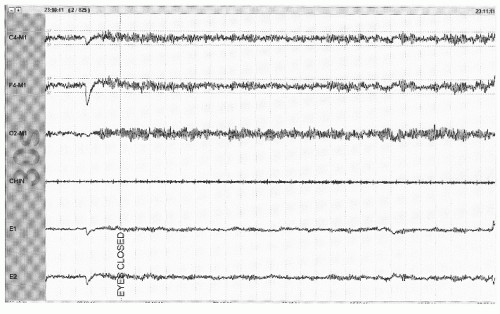
Figure 41.3 The limited PSG montage illustrates alpha activity (well seen after eye closure) consistent with wakefulness or stage W (30-second epoch, chin = submental EMG).


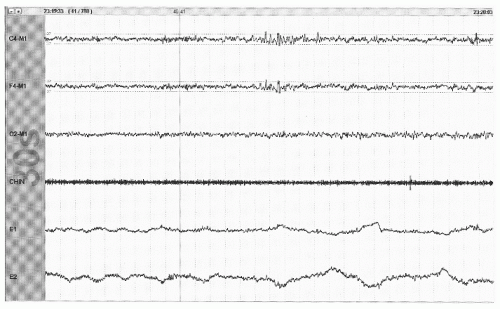
Figure 41.4 The limited PSG montage illustrates the absence of alpha activity and the appearance of slow eye movements (out-of-phase activity in channels E1 and E2) consistent with stage N1 sleep (30-second epoch, chin = submental EMG).


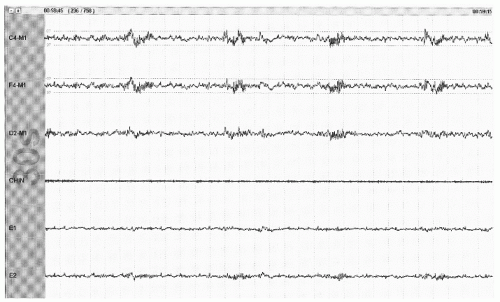
Figure 41.5 The limited PSG montage illustrates sleep spindles (sinusoidal activity in top two channels) and broad vertex waves consistent with stage N2 (30-second epoch, chin = submental EMG).


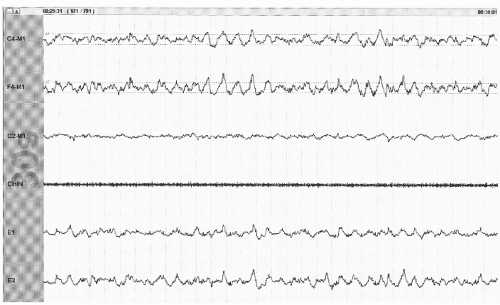
Figure 41.6 The limited PSG montage illustrates high-amplitude delta activity (<2 Hz) occupying greater than 20% of the epoch and represents an example of stage N3. Waveforms that span the two dotted lines in the top two channels identify activity that is at least 75 µV in amplitude (30-second epoch, chin = submental EMG).

Stage R (formerly stage REM) requires three components for it to be scored: low-amplitude mixed frequency EEG, low chin EMG, and the presence of REMs (Fig. 41.7A,B). Phasic EMG activity may occur, but tonic EMG activity must be at a level that is as low as, or lower, than that occurring at any other time during the study. Sleep spindles and K-complexes are absent. Series of 2 to 5 Hz vertex negative “sawtooth” waves occur, particularly just before phasic REM activity.

Movement time (or stage M as described by Rechtschaffen and Kales (11)) is no longer scored. During major body movements that obscure greater than 50% of an epoch, the epoch is scored as stage W if alpha activity is present at any time in the epoch. If no alpha activity is identified, but an epoch of stage W precedes or follows the epoch with a major body movement, then the epoch is scored as stage W. If neither of these requirements can be met, the movement is scored the same as the epoch that follows it.


HYPNOGRAMS

Normal sleep has a clearly defined architecture that occurs each night. Hypnograms are a graphic display of the ultradian cycle within a night’s sleep (34). Sleep stage is depicted in the vertical axis with the hours of sleep on the horizontal axis (Fig. 41.8). Sleep onset begins with a transition to stage N1 sleep followed quickly by stage N2. Stage N3 (formerly NREM stage 3 or slow-wave sleep) comes next and is particularly sustained in this first sleep cycle in children and young adults. Sleep then briefly lightens to stage N2 and transitions into stage R for the first time, usually about 90 minutes after sleep onset. This completes the first sleep cycle, a pattern that repeats itself three to five times during the typical night’s sleep. With each ensuing 90 minute sleep cycle, there is decreasing amounts of stage N3 sleep and an increasing amount of stage R sleep. Predictable changes are noted in sleep architecture with aging and are illustrated by the histograms in Figure 41.8. Beginning in middle age, stage 3 sleep lessens and more wakefulness after sleep onset (WASO) is noted. The number of arousals and awakening continues to increase with aging, becoming particularly notable in the elderly (35,36).


AROUSAL SCORING

The original scoring guidelines of Rechtschaffen and Kales (11) focused primarily on the scoring of the stages of sleep (as discussed above). The R and K criteria defined that the appearance of 30 seconds or more of waking background (which resulted in the epoch being labeled as wake) would be labeled an awakening. The R and K manual made reference to movement arousals, but no other mention of brief EEG frequency changes was made. There was little standardization to the scoring of arousals before the publication of the position paper by the American Sleep Disorders Association (ASDA) task force in 1992 (37). This consensus paper carefully defined rules for scoring an arousal. In the recent AASM scoring manual (12), these rules were distilled to a single rule.

Score arousal during sleep stages N1, N2, N3, or R if there is an abrupt shift of EEG frequency to alpha, theta, or frequencies greater than 16 Hz (but not spindles) that lasts at least 3 seconds, with at least 10 seconds of stable sleep preceding the change in EEG frequency. Scoring arousals during REM requires a concurrent increase in submental EMG lasting at least 1 second (Figs. 41.9 and 41.10).

The use of the 3-second duration of EEG change is not based on any judgment of physiologic impact, rather it is an arbitrary value chosen by the task force partly due to increased interobsever reproducibility of arousal scoring (as compared to shorter duration events). The requirement for an accompanying EMG change in stage R is due to the routine appearance of faster EEG frequencies during normal sustained stage R sleep.


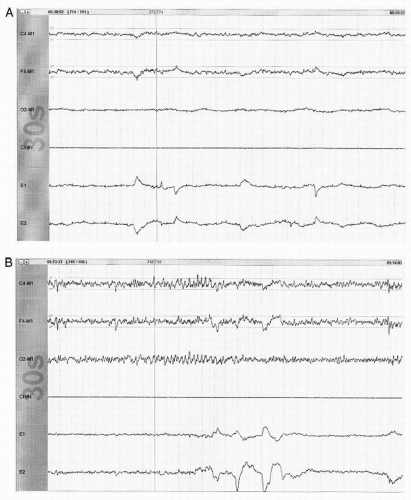
Figure 41.7 A: An example of stage R sleep with low-amplitude mixed frequency EEG activity, absent axial EMG activity (chin channel represents submental EMG), and REMs (out-of-phase activity in channels E1 and E2). (30-second epoch). B: Another example of stage R sleep. Note 2 to 3 Hz low-amplitude sharp activity (seen in C4-M1 channel) just prior to REMs. This activity represents sawtooth waves, a pattern frequently seen in stage R.


Periodic Limb Movements in Sleep Scoring

Periodic limb movements in sleep (PLMS) (also called periodic leg movements of sleep) are repetitive, stereotyped movements of the legs characterized by tonic extension of the great toe (with occasional superimposed clonic activity) variably accompanied by ankle dorsiflexion and knee flexion (38). These periodic movements can rarely preferentially involve the arm and thus the use of the term PLMS. These periodic movements may sometimes be associated with an accompanying EEG arousal. PLMS are commonly seen on PSGs particularly in the setting of disrupted sleep or in the elderly. The clinical significance of PLMS is often unclear, but may sometimes contribute to insomnia or daytime sleepiness. In 1980, Coleman and co-workers (38) made a major contribution in understanding PLMS and various rules of scoring the movements have been proposed, including that from the ASDA task force in 1993 (39) and the World Association of Sleep Medicine—International Restless Legs Syndrome Study Group (IRLSSG) in 2006 (40). From here on we will focus on the recent guidelines given in the AASM scoring manual.

During PSG, the PLMS are quantified as to how many events occurred and also whether an EEG arousal was associated with them (Fig. 41.11A,B). A significant leg movement is defined as an increase in EMG lasting between 0.5 and 10 seconds. The EMG increase has to be at least 8 µV above the resting EMG. The leg movement is labeled as part of a PLM series if it is one of the four consecutive leg movement events occurring with an interval between 5 and 90 seconds. If each leg movement event is separated by less than 5 seconds, they are considered a single leg movement. Arousals are scored as associated with the leg movement if there is less than 0.5 second interval between the end of one event and the onset of the other regardless of which is first. Limb movements should not be scored if they occur within 0.5 second of the onset or end of an apnea or hypopnea.

Similar periodic leg movements can be seen in wakefulness, particularly in patients suffering from restless legs syndrome (RLS). RLS is a disorder where the patient suffers from an uncomfortable sensation in their legs, which is worse at night, worse while at rest, and relieved with movement. RLS is a
clinical diagnosis made in the clinic based primarily on the history and does not require PSG evaluation. PLMS is a diagnosis made on the PSG as most patients do not have daytime symptoms and observer history is not usually helpful. Most patients with RLS will also have PLMS, but PLMS most commonly occur in the absence of restless legs symptoms. Periodic limb movements in wakefulness (PLMW) are not part of the recently published AASM scoring guidelines (12). However, several investigators have suggested the utility of PLMW in assessing patients with RLS. The scoring criteria are exactly the same as those outlined above for the scoring of PLMS. These investigators have also proposed a SIT test (suggested immobilization test) with associated quantification of PLMW as a diagnostic test for patients with RLS (41).


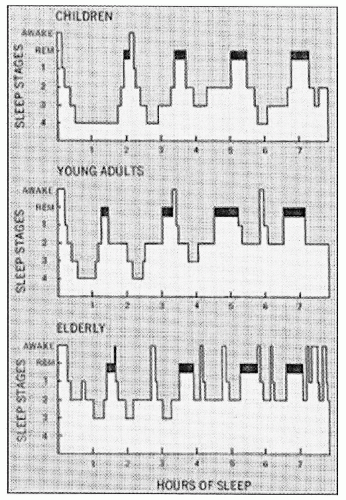
Figure 41.8 Histograms representing normal sleep cycles for age. REM sleep represented by darkened area. Note NREM stages 3 and 4 would now be combined into stage N3. Horizontal axis is hours of PSG recording. (From Kales A, Kales J. Recent findings in the diagnosis and treatment of disturbed sleep. N Engl J Med. 1974;487-499, with permission.)


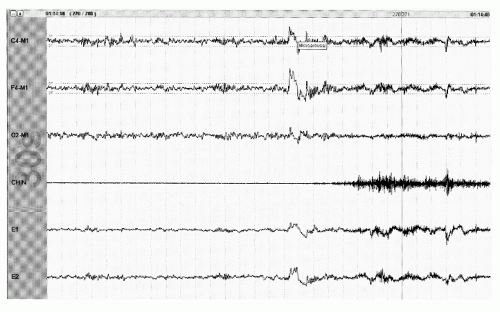
Figure 41.9 Example of arousal from NREM sleep (stage N2) with appearance of fast activity lasting at least 3 seconds. Note increase in EMG activity, which commonly accompanies an EEG arousal pattern but is not required for scoring an arousal from NREM sleep (30-second epoch).


Scoring of Respiratory Events

With the advent of the recognition of apneic events during sleep (42), the cessation of identified airflow for 10 seconds has been the standard definition of an apneic event. With subsequent recognition of the significance of partial airflow interruption (hypopneas), no consistent standard definition was accepted and technical and scoring standards varied widely. The recent AASM scoring manual defines both technical recording requirements as well as scoring rules (12) which hopefully will lead to an improvement in the standardization of quantifying respiratory abnormalities during sleep.

The sensor used to score apnea is the oronasal thermal sensor (thermistor or thermocouple) that has long been used to qualitatively assess airflow during PSG recording. The sensor for detection of a hypopnea is the NPT. The NPT is much more sensitive to the identification of a decrease in airflow and is appropriate to use for the identification of a hypopnea. Frequently during a study, a clear decrease in airflow is identified in the NPT, with no evidence of change in the thermal sensor. Previously, it was common to recognize cyclical arousals associated with loud snoring and oxygen desaturation that were not scorable using the less sensitive thermal sensors. This led to the recognition of the upper airway resistance syndrome in which the patient had a clinical

syndrome consistent with OSA but without scorable apneic events. With the use of NPT and the associated identification of scorable hypopneas, it is much rarer to have a clinical suspicion of unrecognized respiratory events contributing to a patient’s symptoms. However, the NPT is frequently overly sensitive in that it demonstrates no airflow (an apnea) while the thermal sensor continues to demonstrate obvious airflow. As such, the NPT is not to be used for determination of apneic events, which are to be scored off of the thermal sensor recording.


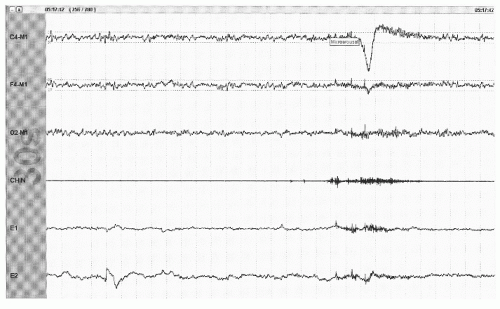
Figure 41.10 An arousal from stage R with appearance of >3 seconds of faster frequencies accompanied by the appearance of EMG in the axial (chin) EMG channel (30-second epoch).


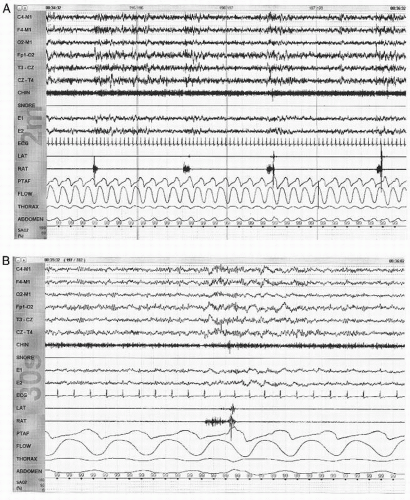
Figure 41.11 A: An illustration of periodic limb movements of sleep. This is a 2-minute epoch with the appearance of EMG activity in the right anterior tibialis (RAT) channel occurring approximately every 30 seconds. The patient is in NREM sleep (which is not able to be confidently determined in this 2-minute epoch). B: A 30-second epoch taken from the time period illustrated in A. Note the appearance of faster frequencies on the EEG demonstrating an arousal associated with this periodic movement.

An apnea is scored using the thermal sensor when there is a >90% decrease in identified airflow lasting at least 10 seconds. The apnea is classified based on the accompanying inspiratory effort identified using the inductive plethysmography belts from the chest and abdomen. An apnea is labeled as obstructive if there is continued or increased respiratory effort throughout the entire period of absent airflow (Fig. 41.12B). The apnea is classified as central if the event has no associated inspiratory effort throughout the entire apneic period (Fig. 41.12A). The event is scored as a mixed apnea if there is initially an absence of inspiratory effort followed by resumption of inspiratory effort in the later portion of the event (Fig. 41.12C). The duration of the absent respiratory effort needed to score a mixed apnea is not defined, but usually would be at least one complete breath cycle (4 to 6 seconds). It should be noted that there is no requirement for any accompanying oxygen desaturation or EEG arousal to score an apnea.

Two separate rules for scoring hypopneas were presented in the AASM scoring manual (12). The “recommended” rule is that used by Medicare and was chosen in an attempt to be in concert with Medicare definitions and decision regarding coverage of CPAP and other therapies. However, the “alternative” set of rules for scoring hypopneas is actually more widely used and captures a larger number of hypopneas, particularly in individuals with healthy lungs where oxygen desaturations occur much less frequently.

The recommended rule for scoring a hypopnea requires the following:


  • NPT signal decreases by >30% for at least 10 seconds.


  • There is an accompanying oxygen desaturation of 4% or more.

The alternative rule for scoring a hypopnea requires the following:


  • NPT signal decreases by >50% for at least 10 seconds.


  • There is an accompanying oxygen desaturation of 3% or more or the event is accompanied by an EEG arousal within 3 seconds of the event.

Either scoring method is acceptable but the rules used should be clearly defined in the PSG report. Most labs do not attempt to classify hypopneic events as obstructive or central due to the inaccuracy of assessing respiratory effort in the absence of more invasive monitoring techniques such as esophageal manometry.

An optional scoring rule outlines the scoring of respiratory effort-related arousals (RERAs). This may be particularly helpful in identifying potential clinically significant respiratory events if only the recommended rule for hypopnea identification is used. A RERA is scored if “there is a sequence of events lasting at least 10 seconds characterized by increasing respiratory effort or flattening of the nasal pressure waveform leading to an arousal from sleep when the sequence of breaths does not meet criteria for an apnea or hypopnea.” Flattening of NPT waveform is thought to identify increased airway pressure reflecting partial airway occlusion. The flattening of the nasal waveform is illustrated in Figure 41.13.

The number of scored respiratory events is then divided by the hours of sleep to yield an AHI (apnea-hypopnea index) which represents the number of respiratory events per hour of sleep. This value is most commonly used to categorize the severity of respiratory abnormality. The consensus statement from the AASM classifies apnea severity as per the following criteria: AHI <5: normal; AHI >5 but <15: mild apnea; AHI >15 but <30: moderate apnea; AHI >30: severe apnea (33). Many observers suggest this categorization of apnea severity may be too severe, particularly given the lack of normative data. Several large studies have demonstrated that nonobese healthy middle-aged adults have an AHI >5 in 20% of individuals, and an AHI >15 in approximately 6% of individuals. The AHI is also recognized to increase with age, even in individuals with no sleep complaint (43, 44 and 45).


Scoring of Cardiac Events

Before the AASM scoring manual (12), there had been no attempt to define or standardize the documentation or scoring of cardiac events during a PSG. The AASM scoring manual defined the use of a modified ECG lead II (recording electrodes placed on torso at approximately second rib to right of sternum and the sixth rib near the apex of the heart on the left chest). The following ECG scoring rules for adults were defined:


  • Score sinus tachycardia for sustained sinus heart rate >90 beats per minute.


  • Score sinus bradycardia for sustained sinus heart rate <40 beats per minute.


  • Score asystole for cardiac pauses >3 seconds.


  • Score wide complex tachycardia for a rhythm of at least three consecutive beats at a rate greater than 100 beats per minute and a QRS duration of > 120 msec.


  • Score narrow complex tachycardia for a rhythm of at least three consecutive beats at a rate >100 beats per minute and a QRS duration of < 120 msec.


  • Score atrial fibrillation if there is an irregularly irregular ventricular rhythm associated with replacement of consistent P waves with variable rapid oscillations.


  • Other significant arrhythmias (such as heart block) should be reported if quality of the single lead is sufficient for accurate identification.


SCORING OF CYCLIC ALTERNATING PATTERN

The cyclic alternating pattern or CAP was first described by Terzano and colleagues in 1985 (46). CAP has been proposed as a tool for the comprehensive analysis of sleep microstructure in both normal and pathologic conditions. Traditional sleep scoring using the criteria of Rechtschaffen and Kales (11) has been the

gold standard for looking at sleep macrostructure. CAP presents another way of looking at NREM sleep within those sleep stages.


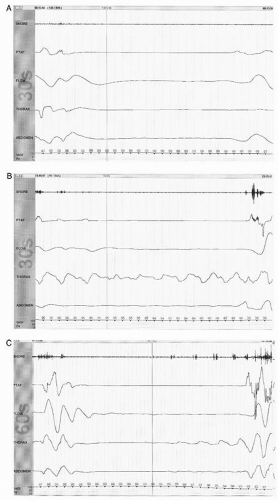
Figure 41.12 A: Limited PSG montage demonstrating no evidence of airflow as measured by nasal pressure transducer (PTAF channel), oronasal thermocouple (flow channel) accompanied by the absence of ventilatory effort in the thorax, and abdominal channels (measured by respiratory inductive plethysmography belts). This is an example of a central apnea lasting approximately 16 seconds. B: Limited PSG montage demonstrating no evidence of airflow as measured by nasal pressure transducer (PTAF channel), oronasal thermocouple (flow channel) accompanied by the evidence of continued ventilatory effort in the thorax channel (measured by respiratory inductive plethysmography belts). This is an example of an obstructive apnea lasting approximately 18 seconds. Note the appearance of snore artifact (in snore and PTAF channel) with resumption of airflow. C: Limited PSG montage demonstrating an apneic event lasting approximately 40 seconds (in this 60-second epoch). No evidence of airflow is noted by the nasal pressure transducer (PTAF channel) or the oronasal thermocouple (flow channel) throughout the event identifying it as an apnea. During the first half of the apneic period, there is no evidence of ventilatory effort, but then increasing evidence of effort in the thorax channel is seen leading up to the termination of the apneic event. This is an illustration of a mixed apnea, having central features at onset but then demonstrating obstructive features as the event progresses.


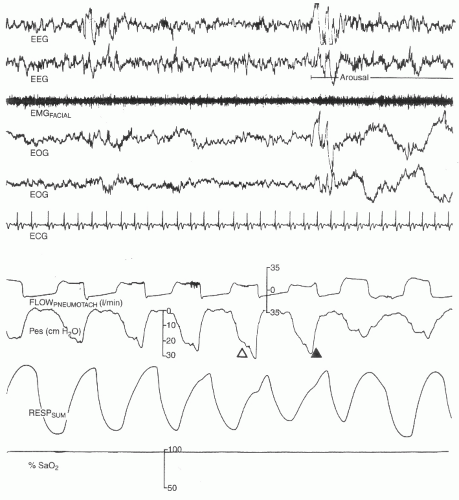
Figure 41.13 Polysomnographic recording showing an example of upper airway resistance syndrome. Note that peak increase in effort (indicated by the solid arrowhead) is associated with a small drop in peak flow and tidal volume, triggering a transient electroencephalographic arousal. ECG, electrocardiogram; EMGFACIAL, facial muscle electromyogram; EOG, electro-oculogram (right and left); FLOWPNEUMOTACH, pnuemotachometer to quantify airflow; Pes, esophageal manometry to record esophageal pressure; RESPSUM, respiratory effort; SaO2, saturation with oxygen. (Reproduced from Chokroverty S. Sleep Disorders Medicine: Basic Science, Technical Considerations and Clinical Aspects. 3rd ed. Philadelphia: Saunders/Elsevier; 2009, with permission.)

NREM sleep has been recognized to have high amplitude EEG bursts such as K-complexes or delta bursts. These are often seen as an arousal response to external stimuli but also occur when sleep disturbance was not evident. An alternative view to this arousal process is that these phenomena are associated with sleep instability (due to an internal or external challenge to the sleep process) and that this type of slow wave activity marks the brain’s attempt to preserve or sustain the sleep state. If sleep becomes too unstable, the preservation attempt fails and the high-amplitude activity is accompanied by a more complete EEG arousal. It is proposed that the addition of a periodicity dimension to the concept of sleep stability and arousal will provide a valuable perspective on sleep and its relationship to underlying physiologic and pathophysiologic mechanisms. CAP represents a slow oscillation of EEG activity that manifests in the appearance of EEG arousal patterns with a periodicity of 20 to 40 seconds.

CAP is represented by three characteristics:


  • The recurring high-amplitude EEG activity (phase A of the period)


  • The intervening background EEG activity (phase B of the period)


  • The period or cycle that is the sum of phase A and phase B

A CAP sequence is composed of repetitive CAP cycles, with each cycle composed of a phase A and a phase B. Each phase of the CAP is 2 to 60 seconds in duration. If there is no phase A activity for >60 seconds, then that portion of NREM sleep is scored an non-CAP. Figure 41.14 illustrates an example of the CAP in stage 2 sleep. Figure 41.15 illustrates a brief period of CAP surrounded by non-CAP sleep on either side. Phase A can take on three patterns: A1 shows primarily slow (<1 Hz) delta activity with a small degree of autonomic activation; A3 demonstrates an increase in fast rhythms with strong autonomic activation (an EEG arousal as per ASDA rules) (37); A2 represents a middle ground between the A1 and A3 subtypes (Fig. 41.16). A summary paper outlining the rules for scoring CAP and including an atlas to illustrate those rules was published by Terzano and colleagues in 2001 (47).

In several studies, the CAP A-phase is identified as the “gate” or “amplifier” that allows the appearance of pathologic events such as PLMS, bruxism, sleepwalking, and sleep-disordered breathing to occur. The majority of nocturnal partial seizures presenting during NREM sleep also occur predominantly in CAP in association with phase A (in particular in association with K-complexes and delta bursts) (48). At this point, the clinical significance of CAP remains unclear but further research is warranted.


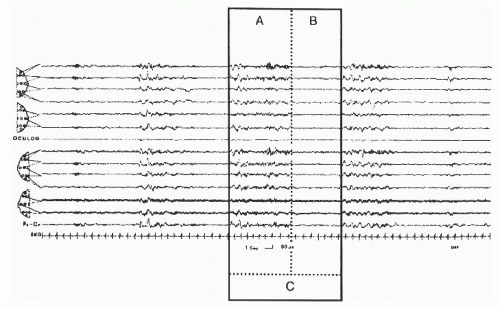
Figure 41.14 An example of CAP in stage N2. The box outlines a CAP cycle (C) composed of phase A and following phase B. Bipolar EEG channels for first six channel top to bottom Fp2-F4, F4-C4, C4-P4, P4-O2, F8-T4, and T4-T6; bottom eight channels are top to bottom Fp1-F3, F3-C3, C3-P3, P3-O2, F7-T3, T3-T5, EOG, and ECG. (From Terzano et al. Atlas, rules, and recording techniques for the scoring of cyclic alternating pattern (CAP) in human sleep. Sleep Med. 2001;2:537-553, with permission.)


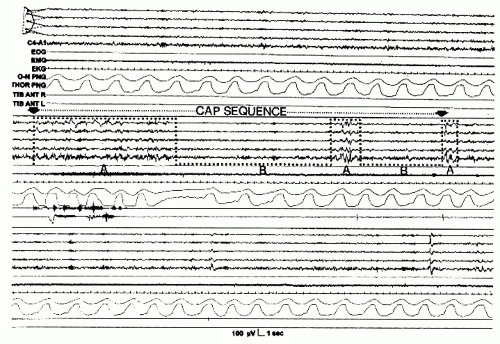
Figure 41.15 Consecutive stretches of non-CAP (top), CAP (middle), and non-CAP (bottom). The middle section illustrates the minimal requirements for definition of a CAP sequence (at least three phase A’s in succession). The CAP sequence occurs between two black arrows and the transition between phases is delineated by the dotted line. EEG derivation is Fp2-F4, F4-C4, C4-P4, P4-O2, and C4-A1. (From Terzano et al. Atlas, rules, and recording techniques for the scoring of cyclic alternating pattern (CAP) in human sleep. Sleep Med. 2001;2:537-553, with permission.)


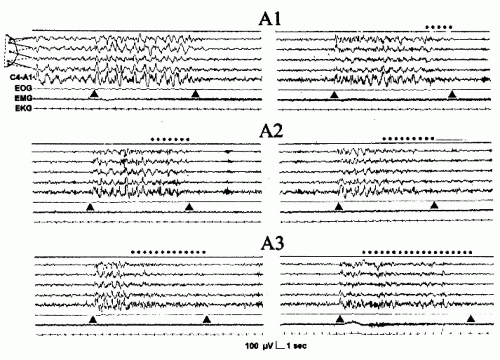
Figure 41.16 The three phase A subtypes. The dotted line indicates the fast low-amplitude portion of phase A. EEG derivation as in Figure 41.15. (From Terzano et al. Atlas, rules, and recording techniques for the scoring of cyclic alternating pattern (CAP) in human sleep. Sleep Med. 2001; 2:537-553, with permission.)


INDICATIONS FOR PSG

The indications for PSG have been summarized by the published practice parameters of the AASM (49,50). The dominant indication for PSG is for the evaluation of sleep-related breathing disorders. The increasing awareness of sleep apnea and its possible impact on long-term cardiovascular health has lead to a marked increase in evaluation of sleep-disordered breathing. While the obese individual who presents with snoring, witnessed apneas, and excessive daytime sleepiness (EDS) represents the obvious candidate for PSG evaluation, there are many others who likely need PSG evaluation. Symptoms of concern for possible sleep apnea include daytime sleepiness, loud snoring, witnessed apneas, and unrefreshing sleep. Additional medical conditions that warrant exploring a possible role of OSA include intractable hypertension, new-onset atrial fibrillation (particularly with onset in sleep), intractable congestive heart failure, and stroke. Once the diagnosis of sleep apnea has been documented, patients usually return for repeat study for CPAP titration. The goal is to document the minimum CPAP pressure that eliminates apnea, hypopneas, and arousals with particular attention to stage R sleep and supine sleep. It is recommended that patients undergoing upper airway surgery to treat snoring or apnea have a study to document apnea severity and ensure appropriate choice of therapy and perioperative management. Similarly, after upper airway surgery to treat apnea, a follow-up PSG is warranted to document the residual degree of sleep apnea and whether additional therapeutic efforts are warranted.

Only gold members can continue reading. Log In or Register to continue

Stay updated, free articles. Join our Telegram channel

Sep 9, 2016 | Posted by in NEUROSURGERY | Comments Off on Polysomnography: Technical and Clinical Aspects

Full access? Get Clinical Tree

Get Clinical Tree app for offline access