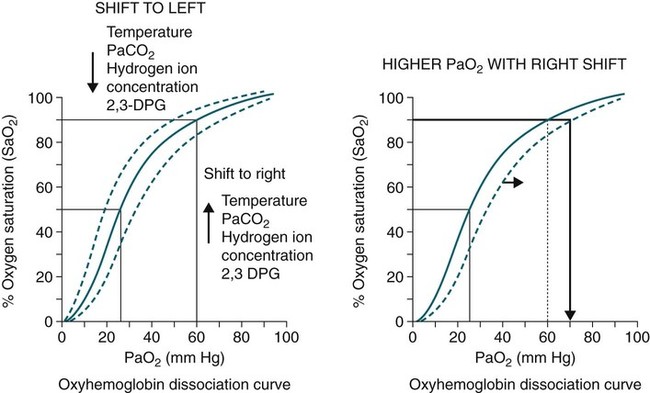
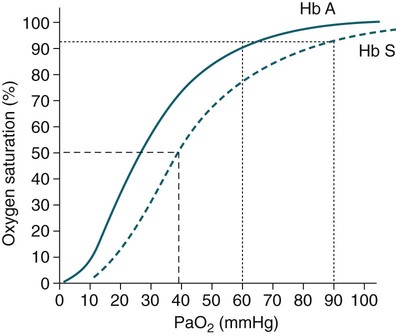
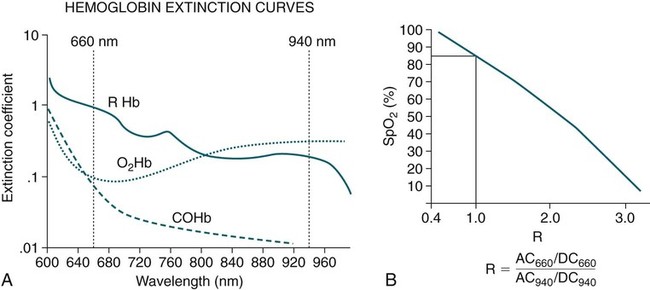
• Mechanisms of hypoxemia include high altitude, hypoventilation, • If hypoxemia is due to hypoventilation alone, the A-a gradient [alveolar PO2 (PAO2) − arterial PO2 (PaO2)] is normal. • Alveolar hypoventilation with a normal A-a gradient suggests that a disorder of ventilatory control or respiratory muscle strength is present. • Patients with alveolar hypoventilation due to parenchymal lung disease have an increased A-a gradient (usually >25). • The PaCO2 = constant × [CO2 production/alveolar ventilation]. If everything else remains the same, a 50% decrease in alveolar ventilation causes a doubling of the PaCO2. • For a given minute ventilation (tidal volume × respiratory rate), the alveolar ventilation is lower with a pattern of higher respiratory rate and smaller tidal volume. • Increases in the dead space–to–tidal volume ratio (VD/VT) from a high VD and/or a low VT reduce the alveolar ventilation for a given minute ventilation. • OVD is characterized by a reduced FEV1/FVC and normal or increased lung volumes (TLC, FRC, RV). If the VC is reduced, this is secondary to a high RV. • RVD is characterized by a normal FEV1/FVC ratio and a reduced VC and TLC. • The most common pulmonary function test abnormality in patients with simple obesity is a reduced ERV (low FRC relative to the RV). • Muscle weakness can cause RVD but must be fairly severe (MIP < 60 cm H2O). • An increased serum HCO3 is a clue that chronic hypoventilation may be present (especially if >27 mEq/L). • The hydrogen ion concentration (pH) is determined by the ratio PaCO2/HCO3. Compensatory mechanisms attempt to normalize the ratio. The goal of this chapter is to present a brief overview of aspects of respiratory physiology useful for the sleep physician. Most patients who have arterial oxygen desaturation in the sleep center do so from apnea or hypopnea. However, patients with respiratory disorders may have sleep-related arterial oxygen desaturation and/or hypoventilation without a significant number of discrete apnea or hypopnea events. These abnormalities in gas exchange can occur because the normal effects of sleep on ventilation and oxygenation are magnified by abnormal function of the lung, chest wall, respiratory muscles, or ventilatory control centers. The effects of lung disease on breathing during sleep are discussed in more detail in Chapters 21 and 22. The alveolar gas equation1 (Equation 10–1) allows one to compute the alveolar (ideal) partial pressure of oxygen (PAO2) from the fractional concentration of oxygen in inspired gas (FiO2), which is 0.21 when breathing room air, and the PaCO2. The respiratory exchange ratio (R) is the CO2 elimination divided by the O2 uptake. At steady state, R is equal to the respiratory quotient (RQ), which equals the CO2 production/O2 consumption ( Breathing room air, Equation 10–1 becomes Equation 10–2. The A-a gradient (Equation 10–3) is the difference between the ideal PAO2 and the actual (measured) PaO2. Equation 10–4 gives the predicted A-a gradient (usually <25 mm Hg). The major causes of hypoxemia are listed in Table 10–1. Causes of hypoxemia include a low FiO2, a low PB (high altitude), hypoventilation (increased PaCO2), and incomplete oxygenation of the blood by the lung (ventilation-perfusion [ TABLE 10–1 Hypoxemia can occur simply as a consequence of hypoventilation. For example, a patient with normal lungs may have an increased PaCO2 due to muscle weakness or abnormal ventilatory control. In this case, the PaO2 is fairly close to the ideal (PAO2) computed from the alveolar gas equation (Equation 10–1) using the known PaCO2. The A-a gradient (Equation 10–3) in such patients is normal. Lung disease severe enough to cause an increased PaCO2 is always associated with an increased A-a gradient. Box 10–1 presents examples of use of the alveolar gas equation (Equation 10–1). In a patient with amyotrophic lateral sclerosis (ALS; Example 1), an arterial blood gas reveals a PaO2 of 60 and PaCO2 of 65 mm Hg. The computed A-a gradient is 8.7 mm Hg (normal). Hypoxemia is due to hypoventilation. In Example 2, a patient with chronic obstructive pulmonary disease has evidence of both hypoxemia and hypercapnia and the A-a gradient is increased. The hypoxemia is due to both Box 10–1 Examples of Computation of the Alveolar Partial Pressure of Oxygen and the A-a Gradient Example 1: Hypoventilation Due to Amyotrophic Lateral Sclerosis (normal A-a gradient) Laboratory: PaO2 = 60 mm Hg and PaCO2 = 65 mm Hg (breathing room air) The majority of the oxygen-carrying capacity of the blood is due to oxygen bound to hemoglobin (Hb) with a small fraction of dissolved oxygen (Equation 10–5).1 When fully saturated, a gram of Hb carries about 1.34 mL/dL of oxygen (1 dL = 100 mL). Oxygen content of arterial blood (CaO2 [mL O2/100 mL]) The arterial oxygen saturation (SaO2) is usually expressed as the ratio of oxygenated hemoglobin (O2Hb) to the total amount of Hb that can bind oxygen (Equation 10–6). The amount of hemoglobin that can bind oxygen is the sum of O2Hb and deoxygenated (reduced) hemoglobin (RHb). The SaO2 value for a given PaO2 depends on the position of the oxygen-hemoglobin saturation curve (also called the oxygen-hemoglobin dissociation curve)1 (Fig. 10–1). At the usual body temperature and pH, a PaO2 of 60 mm Hg corresponds to approximately an SaO2 of 90%. A left shift results in a lower PaO2 being associated with a given SaO2 and vice versa. A shift to the left can occur with decreasing temperature, hydrogen ion concentration [H+], PaCO2, or level of 2,3-diphosphoglycerate (2,3-DPG). Abnormal Hbs can also result in a different relationship between the SaO2 and the PaO2. For example, in patients with sickle cell disease (SCD), the PaO2 for a given SaO2 is higher due to the rightward shift of the O2Hb saturation curve for hemoglobin S (HbS) compared with hemoglobin A (HbA).2 The position of the O2Hb dissociation curve is often defined by the P50, which is the PaO2 corresponding to an SaO2 of 50%. For HbA, the P50 is 26 mm Hg but is 42 to 56 mm Hg in SCD patients.2 The net effect is a rightward shift in the O2Hb dissociation curve for HbS. This means that for a given SaO2, the PaO2 is higher in SCD patients than would be expected based on the normal O2Hb dissociation curve. The amount of right shift varies considerably between SCD patients and can be influenced by transfusion with blood (HbA) (Fig. 10–2). Table 10–2 presents some useful PaO2 and associated saturations. For PaO2 values of 30, 40, and 60 mm Hg, the corresponding SaO2 is 60%, 75%, and 90% values, respectively. The SaO2 is measured noninvasively during sleep studies by pulse oximetry3 (SpO2) to detect arterial oxygen desaturation and hypoxemia. TABLE 10–2 Typical SaO2 Values for Given PaO2 (Assumes Normal pH) PaO2 = arterial partial pressure of oxygen; SaO2 = arterial oxygen saturation. At normal PaO2 levels, only a small amount of oxygen is dissolved in the blood and most of the oxygen-carrying capacity depends on the amount of Hb bound to oxygen. However, determining the oxygen-carrying capacity of Hb is complicated by the fact that both carboxyhemoglobin (COHb) and methemoglobin (MetHb) are forms of circulating Hb that do not bind oxygen. Carboxyhemoglobin occurs when carbon monoxide (CO) binds to Hb. Smokers have increased carboxyhemoglobin. MetHb occurs when the normal ferrous state (Fe2+) of the iron moiety in Hb is oxidized to the ferric stage (Fe3+). Significant methemoglobinemia can occur after exposure to certain medications but is uncommon in the sleep center. The sum of the fractional concentrations of O2Hb, RHb, COHb, and MetHb equal 100% (Equation 10–7). The true fraction of hemoglobin bound to oxygen (FO2Hb) is given by Equation 10–8 and depends on the fraction (%) of carboxyhemoglobin (FCOHb) and methemoglobin (FMetHb) as well as the fraction of reduced hemoglobin (FRHb).4–6 where O2Hb, RHb, COHb, and MetHb are the concentrations of the types of Hb and equal the total Hb concentration (Hbt). For example, if the FO2Hb = 85%, FCOHb = 8%, FMetHb = 1%, then the FRHb is 6%. Using these numbers and Equation 10–6, the SaO2 equals 85 × 100/(85 + 6) or 93%, which is considerably higher than FO2Hb of 85%. The FO2Hb and the amount of Hb are the main determinants of the blood’s oxygen-carrying capacity. When significant COHb or MetHb is present, Equation 10–5 should have SaO2 replaced by FO2Hb. The difference between the SaO2 and the FO2Hb (in %) at normal PO2 values is approximately equal to the sum of FCOHb and FMetHb.4 The FO2Hb is sometimes called the fractional saturation and the SaO2 the functional or effective saturation. Of note, the PaO2 depends on the SaO2, not the FO2Hb. That is, the oxyhemoglobin saturation curve expresses the ratio of oxygenated Hb to the total Hb available for oxygen binding. Neither COHb nor MetHb binds oxygen. However, the position of the oxyhemoglobin saturation curve is shifted to the left by the presence of COHb or MetHb.4,7 The previous four fractions of Hb can be accurately measured by co-oximeters that measure the absorption of 4 or more wavelengths of electromagnetic radiation by blood.1,5 This is possible because the four forms of Hb differ in their absorption for the different wavelengths of radiation. In contrast, pulse oximetry3 uses only two wavelengths: 660 nm (red) and 940 nm (infrared) to measure the O2Hb and RHb. The absorption of radiation at 660 nm is much greater with RHb than O2Hb, whereas O2Hb absorbs more radiation at 940 nm (Fig. 10–3A). SpO2 is based on the empirical observation that the ratio (R) of absorbance at the 2 wavelengths is related to the oxygen saturation (see Fig. 10–3B). This relationship (calibration curve) is calculated experimentally by determining R at varying oxygen saturations. To specifically determine the absorbance of arterial blood, the AC (pulse added absorbance) at each wavelength is divided by the DC (background absorbance) to account for the effect of the absorption of the radiation by venous blood and tissue. COHb has about the same absorbance at 660 as O2Hb and, if present, increases the measured SpO2 value. In normal individuals, FCOHb is 2% or less but can be 8% or more in cigarette smokers. Patients with SCD often have FCOHb values of 4% or more due to production of CO from chronic hemolysis. Based on a canine experiment,3 it has been estimated that a pulse oximeter sees COHb as 90% O2Hb and 10% RHb. For example, from the values FO2Hb = 85%, COHb = 4%, MetHb = 0%, RHb = 11%, one can estimate the SpO2 as 88.6% (85 + 0.9 × 4). This is essentially the same as the SaO2 computed from Equation 10–6 for these values. Thus, the SpO2 is a much better estimate of the SaO2 than the FO2Hb is. In patients who are heavy smokers, it is important to remember that the SpO2 may overestimate the FO2Hb. If a patient has a lower than expected SpO2 while awake in the sleep center, a number of possibilities should be considered including a faulty oximetry probe, poor signal quality due to poor perfusion, a shift in the O2Hb saturation curve due to the factors illustrated in Figure 10–1 or an abnormal Hb. If oximetry issues are ruled out, an arterial blood gas is needed to determine whether hypoxemia is really present. In this situation, co-oximetry analysis could also determine whether significant COHb or MetHb is present and determine a true SaO2 and the fraction of Hb that is oxygenated. Sometimes, the SaO2 reported with an arterial blood gas is simply determined from the measured PaO2 and a nomogram. If clinically indicated, analysis with a co-oximeter will provide more accurate information. The PaCO2 is related to the
Sleep and Respiratory Physiology
 mismatch, and shunt.
Arterial Blood Gases
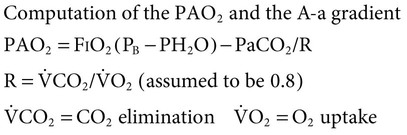
 ). R is usually assumed to be 0.8.1 In Equation 10–1, FiO2 = 0.21 (breathing room air), PB is the barometric pressure (760 mm Hg at sea level), and PH2O is the partial pressure of water vapor (47 mm Hg at 37°C).
 Equation 10–2
 Equation 10–3
 Equation 10–4
 ] mismatch or shunt). In
  mismatch, some alveoli are underventilated for their blood flow (low
  ) and blood is incompletely oxygenated. This can be overcome by increasing the FiO2, thereby increasing the effective oxygen flow to underventilated alveoli. If shunt is causing hypoxemia, blood completely bypasses the alveoli. The deoxygenated blood mixes with oxygenated blood to give a lower than ideal PaO2. Raising the FiO2 has no effect on shunted blood. Most patients with lung disease also have defects in CO2 excretion. This may not result in alveolar hypoventilation because the patient may compensate by increasing the minute ventilation (discussed later).
A-a GRADIENT
RESPONDS TO SUPPLEMENTAL OXYGEN
Low FiO2, low PB
Normal
Yes
Hypoventilation
Normal
Yes
 mismatch
Increased
Yes
Shunt
Increased
No
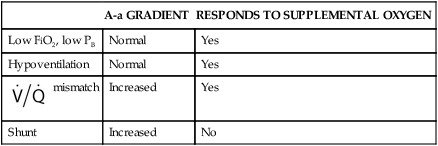
 mismatch and hypoventilation. In patients with hypoventilation of unclear etiology, calculating an A-a gradient can provide an important clue as to whether the hypoventilation is due to lung disease or due totally to hypoventilation. A normal A-a gradient in a patient with hypoventilation would suggest a disorder of ventilatory control or muscle weakness.


Oxygen Transport and Saturation
 Equation 10–5
 Equation 10–6
PaO2 (mm Hg)
SaO2 (%)
30
60
40
75
60
90
 Equation 10–7
 Equation 10–8
Determinants of PaCO2
 and the alveolar ventilation (
 ) (Equation 10–9). For a given
  , if the
  doubles, the PaCO2 decreases by half. The PaCO2 will increase if the
  decreases or the
  increases (Equation 10–9). The
  equals the minute ventilation (
 ) minus the dead space ventilation (
 ). The
  is “wasted ventilation”. The
  = the respiratory rate (RR) Ö tidal volume (VT) (Equation 10-10). The
  can be written as the product of the RR and the dead space (VD). The dead space includes the anatomic dead space (no alveoli) and overventilated areas of the lung (high
  units). The equation for PaCO2 can be written so that PaCO2 depends on the minute ventilation (VT × RR) and the VD/VT ratio (Equation 10–11).
 Equation 10–9
 Equation 10–10
Related posts:
 Obstructive Sleep Apnea Treatment Overview and Medical Treatments
 The Restless Leg Syndrome, Periodic Limb Movements in Sleep, and the Periodic Limb Movement Disorder
 Biocalibration, Artifacts, and Common Variants of Sleep
 Insomnia
 Monitoring Respiration—Technology and Techniques
 Central Sleep Apnea and Hypoventilation Syndromes
![]()
Stay updated, free articles. Join our Telegram channel

Full access? Get Clinical Tree


Neupsy Key
Fastest Neupsy Insight Engine
 age (yr).
 = ventilation-perfusion (ratio).

