Somatosensory-Evoked Potentials: Normal Responses, Abnormal Waveforms, and Clinical Applications in Neurologic Diseases
FranÇOis MauguiÈre
The modern history of clinical somatosensory-evoked potential (SEP) testing began over 50 years ago with George Dawson’s (1) recordings, in patients with myoclonus, of what is known today as a giant somatosensory cortical responses. Because of their relatively large amplitude and low frequency compatible with a slow sampling rate of analog-digital conversion, the cortical SEPs were the first studied in normals and patients. In the 1970s and early 1980s, the spinal potentials and subcortical far-field potentials were identified. Although the origins and mechanisms of far-field SEPs are still debated in the literature, correlations among abnormal waveforms, lesion site, and clinical findings now can be considered well established. The most recent advances in our knowledge of cortical responses to somatosensory stimulation are issued from development of multichannel recordings of evoked potentials (EPs) and evoked magnetic fields coupled with source modeling and source localization in the three-dimensional (3D) images of brain volume, as provided by magnetic resonance imaging (MRI). This approach, based on the resolution of the inverse problem, which consists in modeling sources from the field distribution, results in models of brain activation that may substantially differ from those issued from clinical correlations between the abnormal waveform and the lesion site. In brief, the approach based on electroclinical correlations tended toward the identification of a single generator for each SEP component, which is acceptable for responses reflecting the sequential activation of fibers and synaptic relays of the somatosensory pathways. Conversely, source modeling often suggests that the evoked field distribution at a given moment may result from activities of multiple distributed sources that overlap in time. This model fits better with the parallel activation and the feedback controls that characterize the processing of somatosensory inputs at the cortical level.
This chapter does not aim at exhaustivity, but focuses on recent findings that might be helpful for the recording and interpretation of SEPs in clinical practice.
STIMULATION AND RECORDING PROCEDURES
Only the essential technical requirements for SEP’s recording in clinical practice are given here. More technical details concerning electrodes, amplifiers, stimulators, and safety can be found elsewhere in this book as well as in other books (2, 3, 4 and 5) and in guidelines published by the American Electroencephalographic Society (6) and the International Federation of Clinical Neurophysiology (IFCN) (7,8).
STIMULUS TYPES
Electrical Stimuli
Brevity and strict control in time of stimulus onset and cutoff, and thus of averaging trigger, are the major advantages of electrical stimulation over any other types of stimulus.
SEPs are usually evoked by bipolar transcutaneous electrical stimulation applied on the skin over the trajectory of peripheral nerves. Dermatomal electrical stimulation can also be used to explore root lesions (see below). Monophasic electrical pulses of 100 to 300 µsec can be delivered through rectangular, disk, or needle electrodes connected to the negative (cathode) or positive (anode) pole of the stimulator. Electrical stimuli depolarize nerve fibers directly by generating a potential difference in the medium adjacent to the nerve trunk and thus across the nerve fiber membrane, causing a depolarization close to the site of the cathode. Electrical stimuli thus bypass the peripheral encoding of natural stimuli (pressure, vibrations, joint movements) by the receptors. The different categories of fibers that subserve the different types of sensations can be individualized on the basis of their diameter and thickness of their myelin sheets. There is an inverse relation between the fiber diameter on the one hand and its threshold to electrical stimulation and conduction velocity on the other hand. In most clinical applications of SEPs, electrical stimuli are delivered at intensities equivalent to three to four times the sensory threshold, which produce a twitch in the muscles innervated by the stimulated nerve when it contains a contingent of motor fibers. At this stimulus intensity the rapidly conducting large myelinated fibers, including fibers subserving touch and joint sensation but also muscle afferents, are activated because of their higher resistance.
The contribution of muscle afferents to cortical SEPs after stimulation of upper limb mixed nerves remains a matter of controversy. It is considered negligible by Halonen et al. (9) and Kunesch et al. (10). However, selective intrafascicular stimulation of hand muscle afferents at the wrist and motor-point stimulation were shown to produce short-latency cortical SEPs
with the same waveforms (11,12) and modeled dipolar sources (13) as those obtained by stimulating the trunk of a mixed nerve. These cortical responses were obtained also after motorpoint stimulation of proximal upper limb muscles (11) and muscles of the trunk (14). They are relatively small as compared with potentials evoked from the whole mixed nerve or digital nerves because only relatively few afferents are activated. Their first cortical component peaks later than for median nerve stimulation at the wrist and at approximately the same latency as for stimulation of the digital nerves (15). Therefore, the possibility remains that, when stimulating a mixed nerve of the upper limb such as the median nerve, the cortical response to muscle afferents inputs could be gated by the response to cutaneous and joint inputs. To conclude, the contribution of muscle afferents median nerve cortical SEPs can be considered as weak, compared to that of cutaneous afferents.
with the same waveforms (11,12) and modeled dipolar sources (13) as those obtained by stimulating the trunk of a mixed nerve. These cortical responses were obtained also after motorpoint stimulation of proximal upper limb muscles (11) and muscles of the trunk (14). They are relatively small as compared with potentials evoked from the whole mixed nerve or digital nerves because only relatively few afferents are activated. Their first cortical component peaks later than for median nerve stimulation at the wrist and at approximately the same latency as for stimulation of the digital nerves (15). Therefore, the possibility remains that, when stimulating a mixed nerve of the upper limb such as the median nerve, the cortical response to muscle afferents inputs could be gated by the response to cutaneous and joint inputs. To conclude, the contribution of muscle afferents median nerve cortical SEPs can be considered as weak, compared to that of cutaneous afferents.
The situation is quite different after electric stimulation of lower limb sensorimotor nerves such as the posterior tibial nerve for which muscle afferents have been shown to have a major contribution to cortical SEPs (12,16, 17 and 18). The latency of the earliest cortical response is shorter after stimulation of abductor hallucis muscular fascicle than after stimulation of the posterior tibial nerve, and its amplitude is approximately half that of the tibial nerve response (16). It has been shown that, after stimulation of the tibial nerve, inputs conveyed by muscle afferents, which have the fastest conduction velocity, are able to occlude the response to cutaneous inputs (17). Because of this gating, the cutaneous afferent volley may make little or no contribution to the cerebral potential evoked by electric stimulation of lower limb mixed nerves. Electric simulation of pure sensory nerves, such as digital nerves for the upper limb and sural nerve for the lower limb, activates exclusively skin and joint peripheral and dorsal column (DC) fibers. It is advisable to use this type of stimulus in an attempt to correlate the quality of perception with SEP data in normal subjects as well as in patients with impaired sensation (19). At the upper limb, stimulation of the fingertip (20) or distal phalanx of fingers (21) activates selective skin fibers, while stimulation of digital nerves at the level of the first or second phalanx concern both joint and skin afferents.
Paired electrical stimuli delivered to the same nerve at various interstimulus intervals (ISIs) can be used to characterize distinct components of a given response according to their refractoriness after the response to the first stimulus of the pair (conditioning stimulus) and also to combine SEP testing with psychophysical evaluation of time discrimination performances in detecting the second stimulus of the pair (22). The voltage of the response to the second stimulus of the pair is evaluated by subtracting the response to the test stimulus delivered alone in a separate session.
The effect on SEPs of spatial interference between two electrical stimuli delivered simultaneously but at two distinct sites has been first described by Burke et al. (17) and Gandevia et al. (23). These authors showed that after simultaneous stimulation of both index and middle fingers of the same hand, the size of the early component of the cerebral potential is less than predicted by simple addition of the potentials produced by stimulation of the fingers individually. A procedure based on this observation has been recently applied to the study of somatosensory processing in patients with dystonia (24).
The interfering influences of sensory and motor events on electrically evoked SEPs have been widely used in the context of gating paradigms (see Ref. 25, for a review). In particular, models of centrifugal and centripetal SEP gating during movement programming or execution are based on the results from these studies (see below).
Natural Stimuli
Physiologic stimuli have a higher selectivity than that of electrical stimulation of sensory nerves. SEPs and somatosensoryevoked magnetic fields (SEFs) can be obtained in response to a brief mechanical impact on the fingertip (26, 27, 28, 29 and 30) or air puffs (31, 32 and 33). For skin stimulation, there is some difficulty in getting a consistent, quick, and well-defined movement of the striker using an electromechanical device, which is why stimulators producing fast rise-time (1 msec) and short-duration (4 to 5 msec) air puffs have been developed. However, due to the small population of excited fibers, these mechanical stimuli produce low-voltage responses and are not used routinely in the clinical setting despite their potential advantage over conventional electrical stimuli.
Selective stimulation of joint afferent fibers using passive movements of fingers is difficult to achieve mostly because of possible interference between activations of joint, tendinous, and muscle stretch receptors. Dedicated devices have been developed to activate selectively finger joint afferents (20) or muscle afferents (34). These stimulators produce a small and brisk passive flexion movement of finger II, or fingers II and III, proximal interphalangeal joint, with an amplitude of 2 degrees (21) or 4 degrees (34) in 25 msec. Despite close similarities between stimulation paradigms and evoked responses in these two studies, authors are diverging about the nature of afferent peripheral fibers involved in cortical response genesis, although they discard the hypothesis of a significant participation of cutaneous fibers. Desmedt and Osaki (20) considered that the small 2-degree flexions they applied to the finger with the wrist in slight extension were unlikely to activate the spindle afferents of finger extensor muscles. Mima et al. (34) opposed the argument that joint afferents discharge only in extreme flexion or extension positions while a 4-degree flexion of the finger produces a muscle stretch in the extensor muscle far larger than that needed to record evoked cortical response in monkeys (35). Moreover, they observed that responses to finger flexion were preserved after anoxic ischemia blocking the conduction of joint and cutaneous fibers from the moved finger and concluded that muscle afferents from finger extensor muscles were responsible for corticalevoked responses. Lastly, this latter observation is in partial contradiction to that of an abolition of cortical-evoked responses to larger finger displacements (up to 45 degrees) after anoxia of the hand reported earlier by Papakostopoulos et al. (36).
Pain Stimulation
As performed routinely in clinical neurophysiology laboratories SEPs to electrical stimulation of peripheral nerves do not explore the small myelinated A delta or unmyelinated C afferents to spinothalamic tracts, which subserve temperature and pain
sensation. The early report by Halliday and Wakefield (37) showed that SEPs to electrical stimulation of a peripheral nerve at motor threshold are normal in patients with lesions of the spinothalamic tract and a loss of pain and temperature sensation. The possibility to investigate human pain is attracting increasing attention. There are various methods for evoking pain, including tooth pulp stimulation, cutaneous electrical stimulation, mechanical and electrical stimulation, and cutaneous thermal laser stimulation (38). Bromm and Treede (39,40) have shown that a selective activation of A delta or C fibers can be achieved depending on the energy of brief heat pulses delivered by a CO2 laser beam applied to the skin surface.
sensation. The early report by Halliday and Wakefield (37) showed that SEPs to electrical stimulation of a peripheral nerve at motor threshold are normal in patients with lesions of the spinothalamic tract and a loss of pain and temperature sensation. The possibility to investigate human pain is attracting increasing attention. There are various methods for evoking pain, including tooth pulp stimulation, cutaneous electrical stimulation, mechanical and electrical stimulation, and cutaneous thermal laser stimulation (38). Bromm and Treede (39,40) have shown that a selective activation of A delta or C fibers can be achieved depending on the energy of brief heat pulses delivered by a CO2 laser beam applied to the skin surface.
STIMULUS INTENSITY
In most clinical studies the intensity of electrical stimuli is set at motor threshold or at motor plus sensory threshold (41), for stimulation of mixed sensorimotor nerves, and at three or four times the sensory threshold for stimulation of sensory nerves. At such stimulus intensities all SEP components peaking before 50 msec poststimulus reach their maximal amplitude. The drawbacks of this method are that the physiologic threshold can be drastically modified by the disease process and that some patients are unable to cooperate in the evaluation of sensory threshold.
Stimulus Rate
Stimulus rates of 1 to 10/sec are commonly used in clinical neurophysiology laboratories with no significant changes in the amplitudes or latencies of subcortical or primary sensory cortex Stimulus Intensity (SI) responses. These rates are considered as acceptable for clinical studies in most textbooks (2,3). However, lower rates are recommended to study the amplitudes of cortical potentials peaking more than 25 msec after stimulation of the upper limb.
At rates over 3/sec even early cortical potentials peaking after the initial SI response can be depressed, in particular the frontal N30 potential that is one of the SEPs most often reported as affected in movement disorders. The amplitudes of middleand long-latency responses, in particular those generated in the SII area, reach their saturation level at stimulus rates far below 1/sec (42). The effect of stimulus rates on the amplitude of cortical SEPs can be used as a means to distinguish the components one from another. This approach has been applied to identify short-latency SEPs to median nerve (43) and tibial nerve (44) stimulation.
Analysis Time and Sampling Rate
Most of the SEP components have proved that their clinical utility peak before 50 and 100 msec for upper and lower limb stimulation, respectively. Consequently, there is no necessity to record routinely SEPs over analysis times longer than 100 msec except for the recording of middle-latency responses generated in SII (42,45), posterior parietal (46), and mesial cortical areas (47). Most commercially available devices can calculate 512 sampling points over analysis times in the 10- to 100-msec range. This gives bin widths of 97 and 195 µsec for analysis times of 50 and 100 msec, which are appropriate to obtain far-field and short-latency cortical SEPs without aliasing, respectively (see Ref. 5).
Filters
A broad bandpass, with a high-pass filter set at less than 3 Hz and a low-pass filter set over 2000 Hz, is optimal to record without distortion all SEP components including fast far-field potentials. Analog filter roll-offs should not exceed 12 and 24 dB/octave for low- and high-frequency filters, respectively. Digital filtering of responses acquired with a broad bandpass filter offers the possibility of selecting offline frequencies of clinical interest.
Gain and Number of Sweeps
Gains between 100,000 and 200,000 are adequate. The number of sweeps to be averaged is variable according to the signal-to-noise ratio of the different SEP components. In practice 500 sweeps are enough, in most instances, to obtain the responses at Erb’s point, as well as to extract the main early cortical components. For the recording of spinal and scalp far-field EPs often up to 1000 to 2000 sweeps must be averaged.
Electrode Placement
Recording Electrodes
Standard disk electrodes, well attached on the skin and scalp surface, are suitable for most recordings; needle electrodes can also be used. When recording SEP one usually aims to study during the same run peripheral, spinal, brainstem, and early cortical SEPs. Peripheral nerve volleys of action potentials as well as conducted and segmental spinal SEPs can be recorded by placing cutaneous electrodes along the route of the fiber tracts or close to the fixed generators of segmental spinal responses (near-field recording). Electrodes placed on the scalp pick up both SEPs generated in the cortex and thalamocortical fibers, which are picked up as near-field responses located in restricted areas and far-field positivities reflecting the evoked activity generated in peripheral, spinal, and brainstem somatosensory fibers.
The SEP literature is full of discussions about the most appropriate site for the reference electrode to record each of the components of the response; in fact the knowledge of the field distributions and of supposed source locations and orientations is enough for a correct choice of the recording derivation. Considering the field distribution the optimal recording condition is in theory that in which the reference is not influenced by the activity under study. Most of the far-field potentials that have proved to be clinically useful are widely distributed over the scalp. Consequently, they reach their maximal amplitude in referential recordings in which the reference electrode is placed in a noncephalic position and they are canceled, or drastically reduced, when both recording electrodes are placed on the scalp. Furthermore, a noncephalic reference common to all channels is also adequate for all near-field recordings, and there is no theoretical argument against the recommendation of using this type of montage in all situations. However, the electrical and physiologic (electrocardiogram, electromyogram [EMG], etc.) noise level may be increased by the long distance between the active and reference electrode in noncephalic
reference montages. Conversely, differential amplification between the two maxima of a dipolar potential field on the scalp produced by an identified single generator increases the signal voltage and reduces the noise level. Therefore, montages proposed for routine recordings often stem from a compromise between (i) the theoretical optimum represented by a common noncephalic reference and (ii) practical considerations in terms of pertinent components to be studied in a given clinical condition and electrical environment.
reference montages. Conversely, differential amplification between the two maxima of a dipolar potential field on the scalp produced by an identified single generator increases the signal voltage and reduces the noise level. Therefore, montages proposed for routine recordings often stem from a compromise between (i) the theoretical optimum represented by a common noncephalic reference and (ii) practical considerations in terms of pertinent components to be studied in a given clinical condition and electrical environment.
The routine four-channel montages proposed in the IFCN guidelines (8) explore the afferent peripheral volley (in the supraclavicular and popliteal fossa for upper and lower limb, respectively), the segmental spinal responses at the neck and lumbar spine levels, as well as the subcortical far-field and early cortical SEPs using scalp electrodes placed in the parietal and frontal regions for upper limb SEPs and at the vertex for lower limb SEPs. Since knowledge of the field distributions and source locations is a prerequisite for a correct choice of derivations, recording montages will be proposed after the description of normal SEP components.
Multiple-channel recordings (24, 32, 64, or more) permit assessing the scalp topographic distribution of SEPs; they can be obtained using a cap with electrodes placed according to the modified 10- to 20-electrode system for SEPs or whole-head magnetoencephalography (MEG) devices for SEFs. These multiple-channel recordings, eventually assisted by mapping based on computerized voltage or current fields interpolation, have brought invaluable information on the spatial distribution of each component of the response; moreover, they are indispensable for calculating the evoked fields sources coordinates in a spherical or MRI-based realistic model of the head.
Ground Electrode
The position of the ground electrode is more crucial for SEPs than for the recording of any other type of EPs, due to the electrical artifact produced by the stimulation. To minimize the electrical artifact produced by the stimulation, the ground electrode should be placed on the stimulated limb between the stimulation site and the recording electrodes. Flexible metal strips covered with saline-soaked cloth wrapped around the limb close to the stimulus site are recommended. Electrically isolated stimulators allow the use of a ground electrode on the head, which is adequate for eliminating artifact related to the electrical main and radiofrequency interference.
NORMAL RESPONSES
Short-Latency SEPs to Upper Limb Stimulation (Electrical Stimulation of Median, Ulnar, Radial, or Finger Nerves)
The main early SEP components will be described as they appear on recordings using a noncephalic reference electrode placed at the shoulder on the nonstimulated side after stimulation of the median nerve at the wrist (Fig. 48.1). When necessary we will discuss the modifications of waveform and latency related to the use of other reference electrode sites.
Stimulation of a mixed nerve such as the median nerve elicits a compound action potential (CAP) reflecting the peripheral ascending volley that can be recorded at different levels of forearm and arm. In most routine SEP recordings carried out in
patients with lesions of the central nervous system (CNS), the peripheral ascending volley is recorded only at Erb’s point in the supraclavicular fossa. The CAP appears as a triphasic positive-negative-positive waveform with a negative peak culminating at about 9 msec in normal subjects (N9). If necessary, a CAP with a shape similar to that of the N9 potential peaking at an earlier latency can also be recorded more distally over the trajectory of the nerve. Median nerve CAPs are a mixture of motor antidromic and sensory orthodromic responses and thus are qualitatively different from SEPs generated in the somatosensory pathways. Because of their large amplitude (5 to 10 V at Erb’s point) they are usually obtained using runs of 500 stimuli. The amplitude of peripheral CAPs are unaffected by interfering stimuli applied on the stimulated hand (Fig. 48.1) or when the stimulus rate is increased up to 50 Hz (48).
patients with lesions of the central nervous system (CNS), the peripheral ascending volley is recorded only at Erb’s point in the supraclavicular fossa. The CAP appears as a triphasic positive-negative-positive waveform with a negative peak culminating at about 9 msec in normal subjects (N9). If necessary, a CAP with a shape similar to that of the N9 potential peaking at an earlier latency can also be recorded more distally over the trajectory of the nerve. Median nerve CAPs are a mixture of motor antidromic and sensory orthodromic responses and thus are qualitatively different from SEPs generated in the somatosensory pathways. Because of their large amplitude (5 to 10 V at Erb’s point) they are usually obtained using runs of 500 stimuli. The amplitude of peripheral CAPs are unaffected by interfering stimuli applied on the stimulated hand (Fig. 48.1) or when the stimulus rate is increased up to 50 Hz (48).
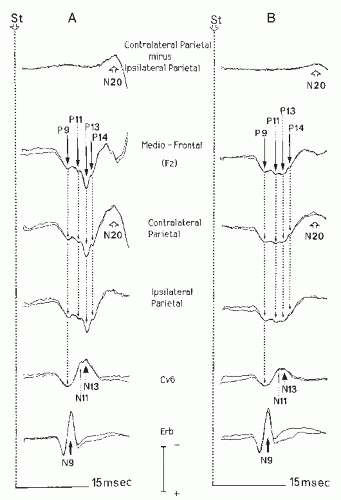 Figure 48.1 Early median nerve somatosensory-evoked potential (SEPs) (noncephalic reference recording). This figure illustrates the Erb’s point N9, spinal N11, N13, far-field P9, P11, P13, P14, and cortical N20 components (A) and the effect of vibrations applied to the stimulated hand (B). The far-field potentials are picked up at all cephalic recording sites. Only the potentials reflecting the moving action potentials in peripheral (N9, P9) and central segments (N11, P11) of the firstorder neuron are unaffected by the interfering vibrations. Conversely, all potentials reflecting activities generated after the first synapse in the cord dorsal horn (N13), brainstem (P13, P14), and SI cortex (N20) are reduced by the interfering stimulus. In this normal subject the N11 spinal potential, reflecting the ascending volley in dorsal column fibers, is discernible in the ascending slope of the postsynaptic dorsal horn N13 potential. Note that the P9 far-field potentials are recorded at all recording sites above Erb’s point. Calibration: 10 µV for Erb’s point trace and 5 µV for all other traces. (From Ibañez V, Deiber MP, Mauguière F. Interference of vibrations with input transmission in dorsal horn and cuneate nucleus in man: A study of somatosensory evoked potentials (SEPs) to electrical stimulation of median nerve and fingers. Exp Brain Res. 1989;75:599-610, with permission.) |
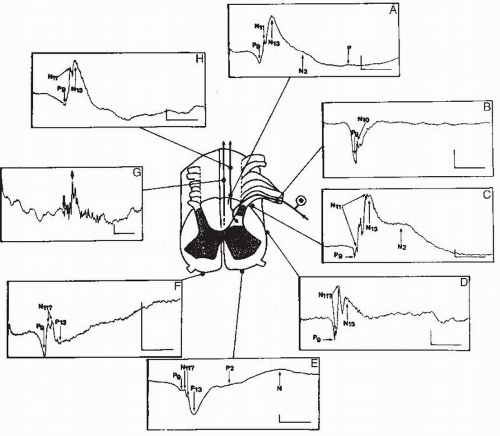 Figure 48.2 Direct recording of spinal potentials on cervical cord surface after stimulation of the median nerve. A cervical cord segment is represented containing one axon from cervical dorsal root ganglion cell on the stimulated side. The dorsal recordings (A and C) show the P9, N11, N13, and later N2 and P waves. The anterior recordings (E and F) show the polarity reversal of the dorsal horn N13 response (P13). The recording close to the root spinal entry zone shows the P9 and N10 dorsal root potentials (B). The ascending action potentials in dorsal columns corresponding to the surface N11 potential are illustrated in G; these fast action potentials are also visible in A, C, and H on the ascending phase of the N13 potential. The origin of fast N11 activities recorded at lateral and anterior electrode sites (D-F) is not firmly assessed (presynaptic afferents in the dorsal horn, spinocerebellar pathways). Calibration: horizontal bars 10 msec, vertical bars 10 µV except in G, where it represents 1 µV. (From Jeanmonod D, Sindou M, Mauguière F. The human cervical and lumbosacral evoked electrospinogram. Data from intra-operative spinal cord surface recordings. Electroencephalogr Clin Neurophysiol 1991;80:477-489, with permission.) |
Spinal Segmental N13 Component
Electrical stimulation of large-diameter myelinated fibers of peripheral nerves produces a dorsal horn (DH) potential with a posterior-negative and anterior positive dipolar field perpendicular to the cord axis. This field distribution of DH potentials has been demonstrated by direct spinal recordings at all segmental levels of the cord (Fig. 48.2), and a comprehensive atlas of these responses is now available (49). The cervical N13 potential is
recorded at the posterior neck, with a maximum voltage at the level of C5 to C7 spinous processes and decreases in amplitude at more rostral or caudal electrode positions. N13 does not show any latency shift between C6 and C2 recordings in normal subjects (50, 51 and 52). When recorded anterior to the cord by an electrode placed at the anterior aspect of the neck (50,53), the cervical DH response is recorded as a spinal P13 positivity. This polarity reversal has been demonstrated with esophageal (54) and epidural (55) recordings and also by direct recordings from the surface of the cervical cord (56,57). Both N13 and P13 spinal components are reduced in amplitude to the same degree when the stimulation rate is increased over 10/sec (48), both persist in brain death or in cervicomedullary lesions (53,58,59) and both are selectively reduced or abolished in lesions of the cervical cord gray matter sparing the spinal somatosensory tracts (60). Thus the most likely generator of the N13-P13 cervical potentials is the compound segmental postsynaptic potential triggered in the DH gray matter by the afferent volley in fast conducting myelinated fibers. Direct recordings on the cord surface have shown that the characteristics of N13 in humans are very similar to those of the N1 spinal potential described in animal studies, which reflects the postsynaptic neuronal response of DH laminae IV and V neurons to inputs conveyed by group I and II peripheral afferent fibers (61, 62 and 63).
recorded at the posterior neck, with a maximum voltage at the level of C5 to C7 spinous processes and decreases in amplitude at more rostral or caudal electrode positions. N13 does not show any latency shift between C6 and C2 recordings in normal subjects (50, 51 and 52). When recorded anterior to the cord by an electrode placed at the anterior aspect of the neck (50,53), the cervical DH response is recorded as a spinal P13 positivity. This polarity reversal has been demonstrated with esophageal (54) and epidural (55) recordings and also by direct recordings from the surface of the cervical cord (56,57). Both N13 and P13 spinal components are reduced in amplitude to the same degree when the stimulation rate is increased over 10/sec (48), both persist in brain death or in cervicomedullary lesions (53,58,59) and both are selectively reduced or abolished in lesions of the cervical cord gray matter sparing the spinal somatosensory tracts (60). Thus the most likely generator of the N13-P13 cervical potentials is the compound segmental postsynaptic potential triggered in the DH gray matter by the afferent volley in fast conducting myelinated fibers. Direct recordings on the cord surface have shown that the characteristics of N13 in humans are very similar to those of the N1 spinal potential described in animal studies, which reflects the postsynaptic neuronal response of DH laminae IV and V neurons to inputs conveyed by group I and II peripheral afferent fibers (61, 62 and 63).
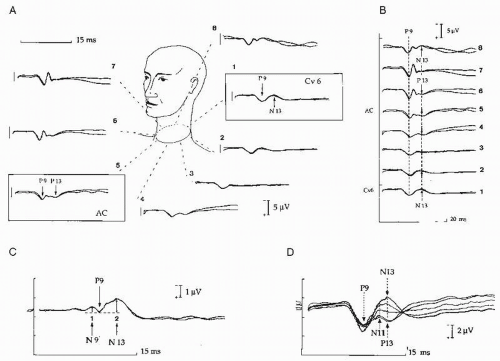 Figure 48.3 Neck recording of the N13-P13 segmental potential. Normal distribution of the N13-P13 recorded using an array of cervical electrodes and a reference at the shoulder contralateral to the stimulated right median nerve (A). The triphasic root activity is picked up at lateral neck electrodes on the stimulated side (6,7) and its initial positivity is synchronous with that of the P9 potentials picked at all other recording sites (B). The N11 potential is not clearly visible in this subject as compared with that illustrated in Figure 48.1; it appears as a notch on the initial phase of the segmental N13-P13 potential and does not reverse its polarity at anterior neck recording sites (D). The trace obtained using a derivation between the posterior neck electrode at C6 level (1) and the anterior cervical electrode (AC, electrode 5) shows the segmental cord response with a maximal amplitude, which can be quantified by measuring the peak-to-peak P9.N13-N9.P9 ratio. Note that the surface distribution of the N13-P13 spinal response is very similar to that observed in direct recording on the cord surface illustrated in Figure 48.2. (From Restuccia D, Mauguière F. The contribution of median nerve SEPs in the functional assessment of the cervical spinal cord in syringomyelia. A study of 24 patients. Brain. 1991;114:361-379, with permission.) |
In noncephalic reference recordings the N13 often has a small voltage. A cervical transverse derivation between two electrodes located, respectively, over the C6 spinal process and above the laryngeal cartilage is the most adapted for recording the spinal N13-P13 segmental response (Fig. 48.3). Substraction of the
anterior cervical (AC) positivity from the posterior neck negativity increases the signal-to-noise ratio and has the advantage over the more conventional C6-Fz montage of recording a segmental DH response that is not contaminated by SEP components generated above the foramen magnum (see below).
anterior cervical (AC) positivity from the posterior neck negativity increases the signal-to-noise ratio and has the advantage over the more conventional C6-Fz montage of recording a segmental DH response that is not contaminated by SEP components generated above the foramen magnum (see below).
Apart from its field distribution, a second characteristic of the segmental N13 potential is that it shows amplitude reduction, rather than latency prolongation, when the dorsal afferent volley is time dispersed, or when the number of responding DH neurons is reduced. For diagnostic purposes the limitation of N13 amplitude measurements is that distribution of this parameter in a group of normal subjects does not show a gaussian profile. Therefore, the lower limit of normal N13 amplitude values estimated by the mean minus 2 to 3 standard deviations (SDs) is statistically meaningless. The best way to evaluate the N13 amplitude is to calculate the ratio between the N13 amplitude and that of the dorsal root N9-P9 deflection that immediately precedes N13 in transverse cervical montage recordings (60). The distribution of the log10 (N13-N9) amplitude ratio has a gaussian profile in normals. The normal lower limit of the normal N13-N9 ratio, defined as the mean value minus 2.5 SD, is of about 1.2. The N9-P9 deflection shows good test-retest reliability and its amplitude closely reflects the incoming volley in the cervical roots, which is likely to be unaffected in spinal cord diseases. Moreover, the N13-P9 amplitude ratio remains stable when tested at stimulus intensities between motor threshold and twice the motor threshold (60). Runs of 1000 stimuli delivered at 2/sec are appropriate in most cases to obtain well-defined cervical potentials using either a noncephalic or AC reference site.
Upper Cervical N13 Potential
It has been known for many years that a negative potential peaking at a latency of about 13 msec can be recorded intraoperatively at the dorsal aspect of the cervicomedullary junction (64, 65, 66, 67 and 68). On the skin surface, however, it is not easy after median nerve stimulation to separate this potential at upper cervical level from the segmental cervical N13, so that the former can be interpreted as a rostral spread of the latter. In particular, there is no evidence of a latency increase of the median nerve N13 negativity from the Cv6 to Cv2 level in noncephalic reference recordings, although in bipolar recordings along the neck the mean N13 peak latency was found to be longer at rostral than at caudal levels (69). An elegant insight to this latency problem was provided by Zanette et al. (70), who showed that the N13 recorded at upper cervical level peaks 0.8 msec later than the lower cervical N13 after ulnar nerve stimulation, but not after median nerve stimulation, in noncephalic reference recordings. The greater distance from the dorsal root entry zone to the cuneate nucleus for ulnar nerve than for median nerve afferent fibers was proposed to explain this latency shift. Araki et al. (71) have addressed the question of separate generators for the lower and upper cervical N13 potentials by using a conditioning-test paired stimulus paradigm for the stimulation of the median nerve. They confirmed that at ISIs of 4 to 18 msec the test of the lower cervical segmental N13 to the second stimulus was attenuated by 2% to 34% when compared to the control response, as previously reported by Iragui (72) and by El Kharoussi et al. (22) after stimulation of median nerve and the second and third fingers, respectively. More unexpected was the finding that, while the scalp P13-P14 showed the same attenuation as the lower cervical N13, the N13 recorded at the CV2 level showed an increase of 4% to 25% at these ISI. The upper cervical N13 is supposed to be generated by the presynaptic volley in the DC fibers close to the cuneate nucleus, but the difficulty of separating it from the DH N13 lessens its clinical reliability in routine clinical recordings (see Ref. 73, for a review).
Conducted Cervical N11 Component
The nuchal N11 potential is recorded all along the posterior aspect of the neck, where it usually appears to encroach upon the ascending slope of N13. In noncephalic reference recordings its onset latency increases from C6 to C1 spinal processes by 0.9 ± 0.15 msec (50,52). This bottom-up shift of N11 onset latency suggests that N11 is generated by the ascending volley of action potentials in the DCs of the cervical spinal cord. As first reported by Cracco (74), it is often difficult to differentiate the N11 from the following N13 component. This seriously hampers the use of N11 in clinical practice, which is limited to cervical cord lesions that selectively obliterate the N13 potential. In direct recordings on the cervical cord surface during surgery, N11 appears as a fast polyphasic component that overlaps in time with the slower N13 segmental postsynaptic potential.
Far-Field Positive Scalp Positivities (P9, P11, P13, P14)
On scalp noncephalic reference recordings with a highfrequency filter over 1000 Hz and a fast sampling rate (bin width < 200 µsec), three or four stationary positivities are consistently observed with a wide distribution and a mediofrontal predominance. In normal adults these potentials peak with mean latencies of 9, 11, 13, and 14 msec and are labeled P9, P11, P13, and P14, respectively, according to the polarity-latency nomenclature. There is some interindividual variation in the waveform of the two latest P13 and P14 potentials since either the P13 or P14 peaks can predominate. The amplitude of these far-field positive potentials are not affected when the stimulation rate is increased up to 50 Hz (48).
The P9 potential is picked up at the neck as well as on the scalp. It reflects the afferent volley in the trunks of the brachial plexus in axilla and supraclavicular fossa (75,76). Its peaking latency varies with arm length and its onset latency, but not its peaking latency, is influenced by the respective positions of arm and trunk (77).
The P11 potential reflects the ascending volley in the fibers of DCs at the cervical level. Desmedt and Cheron (50) first reported that, after median nerve stimulation at the wrist, the P11 potential begins in synchrony with the cervical N11 potential at the C6 level, which is close to the dorsal root entry zone in the cervical cord. The P11 potential is not recorded in about 20% of normal controls, and thus the clinical significance of its absence in patients is questionable. Conversely, its persistence when later scalp components are abnormal is a reliable indicator of preserved DC function in patients with lesions located in the medulla oblongata or at the cervicomedullary junction.
The P13-P14 far-field potentials are consistently recorded in normal subjects (see Ref. 78, for a review). Both may be of similar amplitude, or either of them may be the larger of the two (Fig. 48.1). In some subjects P14 is hardly visible as a notch on the ascending phase of P13; in others P13 and P14 cannot be differentiated. In the same individual the morphology of the P13-P14 complex can display some degree of side-to-side difference, which creates difficulties for interpreting left-right asymmetries in patients. P14, but not P13, always peaks later than the cervical segmental N13 potential (79). Since the P13-P14 complex is picked up at the earlobe with a lesser amplitude than in the frontal region of the scalp, it can be recorded with a scalp-earlobe montage (80). The P13-P14 complex is the only scalp farfield SEP that is reduced by interfering stimulations, such as vibrations, applied to the hand on the stimulated side (48). This suggests that it is generated after the synaptic relay in the nucleus cuneatus (NC). Patients with thalamic lesions usually show a normal P14, suggesting that this component originates at subthalamic level (80, 81 and 82). Conversely, in cervicomedullary lesions (53,59) or in brain-dead patients (58) the P14 potential is absent. These findings suggest that the generator of P14 is situated above the level of the foramen magnum.
Simultaneous scalp and nasopharyngeal SEP recording in deeply comatose and brain-dead patients brought some information concerning the origins of the P14 potential (83). In patients with signs of upper brainstem dysfunction this author observed that the P14 recorded between scalp and nasopharynx is lost while an earlier P13 positivity persists in scalp to shoulder traces. This observation suggests that the P14 recorded between the scalp and the nasopharynx reflects the activity of medial lemniscus pathways at the upper part of the brainstem, whereas the P13 might be generated at the cervicomedullary junction. A normal P13 coexisting with an abnormal P14 has been observed in patients with pontine or mesencephalic lesions (69,84, 85 and 86), supporting the hypothesis that P13 and P14 potentials could be generated at different anatomical levels in the cervicomedullary and brainstem somatosensory pathways. This view is reinforced by the observation, in noncephalic reference recordings, that the P13 positivity recorded at the nasopharynx can be preserved while the scalp P14 is abnormal in lesions of the lower brainstem (87).
The scalp and nasopharynx P13 potential is different from the segmental P13 positivity recorded at the anterior aspect of the neck. Despite their similar latencies and polarities, these two components have different distributions and origins and the segmental spinal P13 is preserved in all patients with upper cervical or cervicomedullary lesions.
Thus, according to our present knowledge the most probable mechanism generating the P13-P14 potentials are (i) the ascending volley in upper cervical DC fibers at the cervicomedullary junction or in medial lemniscus fibers in the brainstem, (ii) the postsynaptic response of NC neurons, and (iii) junctional stationary potentials related with the moving action potential volley across the border between neck and posterior fossa (88,89).
For the sake of clarity, the P13-P14 complex is often labeled as P14, a convention that is adopted here. It can be useful to calculate the P9/P14 amplitude ratio in patients. As with the I/V amplitude ratio of brainstem auditory-evoked potential (BAEPs) one compares, by measuring the P9/P14 ratio, the amplitude of a peripheral potential (P9) with that of a brainstem potential (P14). In normals the P9 potential is smaller than the P14 potential when recorded with a broad bandpass of 1.6 to 3200 Hz, and the distribution of the P9/P14 ratio has a gaussian profile (90).
The N18 Scalp Negativity
This potential identified by Desmedt and Cheron (91) is a long-lasting scalp-negative shift, which immediately follows P14. In normals N18 can only be identified in the posterior parietal region ipsilateral to the stimulation, where there is no or minimal interference with cortical potentials. The N18 is a long-lasting component (about 20 msec when recorded with a 1- to 3000-Hz bandpass), and when low frequencies are cut off by filtering it can be falsely interpreted as an ipsilateral cortical N20. It is still uncertain whether the N18 negativity contains several subcomponents; several wavelets are superimposed on its plateau at fixed latencies on repeated recordings in the same individual, which favor this interpretation. When all cortical responses are eliminated by deafferentation due to a lesion of the ventroposterolateral (VPL) thalamic nucleus (92) or by direct lesion of the centroparietal cortex (79), N18 can be recorded on the whole surface of the scalp (Fig. 48.4). After
hemispherectomy, which entails retrograde degeneration of the thalamocortical neurons, the N18 potential is most often preserved (93); however, N18 can be missing, as well as the P14 potential, long after hemispherectomy including the thalamus (94) in relation with retrograde degeneration of the cuneatethalamic projections. These observations rule out the possibility that N18 could reflect a cortical or a thalamic response to lemniscal or extralemniscal inputs.
hemispherectomy, which entails retrograde degeneration of the thalamocortical neurons, the N18 potential is most often preserved (93); however, N18 can be missing, as well as the P14 potential, long after hemispherectomy including the thalamus (94) in relation with retrograde degeneration of the cuneatethalamic projections. These observations rule out the possibility that N18 could reflect a cortical or a thalamic response to lemniscal or extralemniscal inputs.
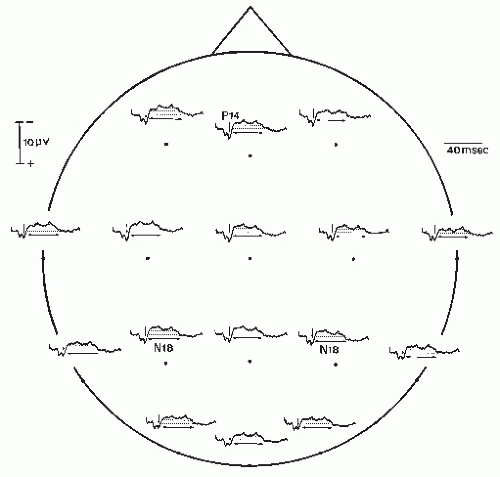 Figure 48.4 Scalp topography of the P14 and N18 potentials. In this patient with a large left centroparietal lobe lesion the N18 is recorded on the whole surface of the scalp eliminating all cortical SEPs, preceded by the P9 and P14 potentials (noncephalic reference recording). Note that the amplitude of the P14 potential is maximal in the frontal region whereas that of the P9 potential is similar at all recording sites. (From Mauguière F. Evoked potentials. In: Osselton JW, Binnie CD, Cooper R, et al., eds. Clinical Neurophysiology: EMG, Nerve Conduction and Evoked Potentials. Oxford: Butterworth-Heinemann; 1995:325-563, with permission.) |
The earliest hypothesis, concerning the generation of N18, was that of a postsynaptic response of the brainstem nuclei connected with the DC nuclei to ascending inputs conveyed by ancillary fibers of the medial lemniscus. This hypothesis has been supported by intracerebral SEP recordings in humans showing a stationary negativity between the upper pons and the midbrain, peaking at the same latency as the scalp N18 (95). However, nasopharyngeal recordings (96) rather suggested an N18 origin in the medulla oblongata and more precisely in the NC. Potentials recorded dorsal and ventral to NC in humans (68) show a biphasic waveform that is very similar to that of NC responses to peripheral nerve stimulation in cats. The first phase of this response in cats represents the postsynaptic potential of NC relay neurons to the DC afferent volley, while the second one reflects the presynaptic inhibition of DC fibers terminals in NC (65). This inhibition consists in a feedback depolarization of DC terminals, triggered by the afferent volley in DC fibers collaterals and mediated by NC interneurons. To date it is accepted that N18 reflects a similar phenomenon in the human brainstem (see Ref. 97, for a review). Several arguments lend substance to this analogy: (i) The distribution and polarity are similar in cat and human recordings. (ii) The presynaptic inhibition of DC terminals in cats, like the human N18, lasts for several tens of milliseconds, probably because it is mediated via a polysynaptic chain of interneurons. (iii) The N18 voltage is unaffected by interfering vibrations applied on the hand on the stimulated side (98), contrary to the P14 potential, which is attenuated (48); this finding fits with the inference that N18 reflects inhibitory activity upon DC terminals.
In normal subjects noncephalic reference recordings of scalp SEPs show two positivities of cortical origin that are superimposed upon N18 in the central and frontal regions contralateral to stimulation, namely central P22 and frontal P20 (see below). Thus the early portion of N18 appears as a negativity preceding the onsets of P20 and P22 in the midfrontal and central regions, respectively. These frontal and central negativities have been considered as genuine cortical responses and labeled as N15, N16, N17, or N19 components (99,100). However, superimposition of traces recorded in the posterior parietal region ipsilateral to stimulation, where N18 is not contaminated by contralateral cortical components, clearly shows that there is no actual scalp negativity other than N18 and N20 within the first 22 msec following stimulation. The N18 plateau recorded in the parietal region ipsilateral to stimulus can serve as a baseline to assess the voltage and the shape of cortical components peaking in the 20- to 40-msec latency range. Since most of the N18 is picked at earlobe, the use of the earlobe ipsilateral to stimulation bypasses this baseline problem by eliminating the N18 negative shift in the resulting waveforms.
Early Cortical SEPs
These cortical SEPs are peaking in the 18- to 35-msec latency range and are all obtained with optimal voltage in response to stimuli delivered at a slow rate (less than 2/sec). They are recorded on the scalp in the parietal region contralateral to stimulation and in a large frontocentral area, mostly contralateral to stimulation. They are superimposed on the widespread N18 in noncephalic reference recordings. Although the scalp distribution of these potentials shows substantial variations between subjects, their profiles and voltages are relatively symmetrical in a given individual, so that side-to-side differences in a group of normal subjects can be used as norms for assessing interhemispheric asymmetries in patients. For latency measurements, calculating the intervals from the peak of the far-field P14 to the peak of each of the cortical components permits eliminating interindividual variability related to arm length and body height differences.
Though studies in normals and patients converge on the conclusion that responses recorded in the parietal region originate in the somatosensory area SI, there is still some controversy as to whether some of the early cortical SEPs recorded in the frontal region might be generated in the prerolandic cortex. Several clinical studies reported that frontal and parietal SEP waveforms can be selectively affected in patients with focal hemispheric lesions (19,101, 102 and 103) and suggested prerolandic generators for some of the SEPs recorded in the frontal region. These observations, based on clinical examination, abnormal SEP waveforms analysis, and computed tomography (CT) imaging of lesions were at the origin of the hypothetical sensorimotor model of early SEPs sources. This model had the advantage of fitting with the concept of a short-latency control of motor cortex by peripheral somatosensory inputs via transcortical long-loop reflexes. Conversely, direct cortical recordings in humans (see Ref. 104, for a review) supported the view that all sources of early cortical SEPs are located in the parietal cortex and more precisely in the primary somatosensory area (SI). This controversy, the terms of which are discussed in more detail later in this chapter, should not discourage clinicians from using cortical SEPs as indexes of brain dysfunction in the assessment of patients with sensory or motor disorders for two main reasons. First, correlations between a clinical deficit and an SEP abnormality are clinically pertinent facts, even if they can lead to pathogenetic hypothesis, which are not validated by other approaches. Second, in lesion studies, the extent of the lesion, as well as its functional effects, which were difficult to assess by correlating SEP waveforms with CT images of the early 1980s, are now more accessible by fusing anatomical and functional data from MRI, emission tomography, and source modeling of SEPs.
N20-P20 and P22 Potentials
Two sets of early cortical potentials are consistently recorded in normal subjects on the scalp contralateral to stimulation. The first is made of a parietal N20 and frontal P20 dipolar field; the second is composed of a central P22 positivity (Fig. 48.5). These components are also present after finger stimulation with a
latency delay of 2 to 3 msec, as compared with median nerve SEPs, because of finger-to-wrist conduction time.
latency delay of 2 to 3 msec, as compared with median nerve SEPs, because of finger-to-wrist conduction time.
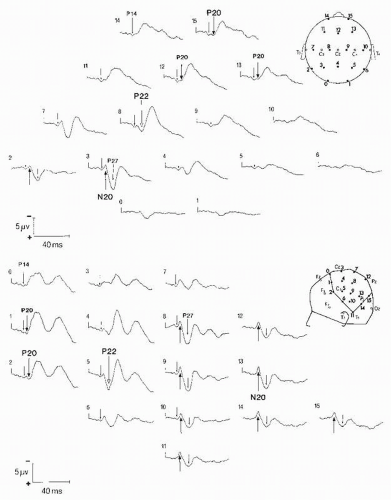 Figure 48.5 Scalp topography of the N20-P20 and P22 potentials (earlobe reference). Responses to stimulation of the third finger of the right hand are illustrated. In the upper part of the figure the electrode montage covers the whole scalp surface; in the lower part the electrode array is restricted to the left centroparietal area. The P22 positivity peaks in a restricted area at the C3 electrode site (electrodes 8 and 5 in upper and lower parts of the figure, respectively). The N20-P20 dipolar field has a wider distribution covering the parietal region contralateral to stimulation (N20) and the contralateral central and frontal regions (P20), with a polarity reversal at the level of the scalp projection of the rolandic fissure. (From Deiber MP, Giard MH, Mauguière F. Separate generators with distinct orientations for N20 and P22 somatosensory evoked potentials to finger stimulation. Electroencephalogr Clin Neurophysiol. 1986;65:321-334, with permission.) |
The parietal N20 and frontal P20 reflect the activity of a dipolar generator in Brodmann’s area 3b situated in the posterior bank of the rolandic fissure (105, 106 and 107) and represents the earliest cortical potential elicited by median nerve stimulation. This dipolar field distribution is also observed in magnetic recordings. All source modeling studies of electrical and magnetic fields, as well as direct cortical recordings, converge on the conclusion that the N20-P20 field is produced by a dipolar source tangent to the scalp surface reflecting the response of area 3b neurons to cutaneous inputs. This was confirmed by the finding that the N20-P20 response is not evoked by joint inputs produced by passive finger movements (20). Therefore, the polarity reversal line of the N20-P20 dipolar field recorded on the scalp or directly on the cortex and the equivalent dipolar source modeled from electric or magnetic recordings are now widely used to localize the central fissure in the assessment of patients with a lesion or an epileptogenic area located in the rolandic region.
On scalp (Fig. 48.6) and some direct cortical recordings a P22 recorded in the central region was found to peak 1 to 2 msec later than the N20-P20 potentials (91,108,109). This has been taken as an argument to consider P22 as a genuine component generated by a source distinct from that of N20-P20 (91), while others denied the existence an independent P22 (110).
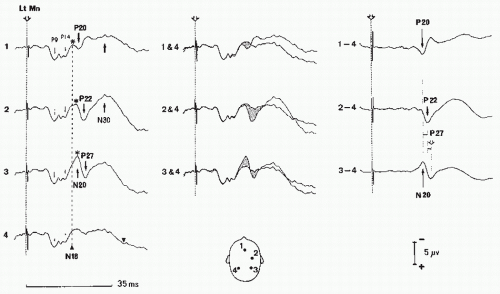 Figure 48.6 Identification of early cortical N20, P22, P27, and N30 potentials (left median nerve stimulation; noncephalic reference recording). Since the subcortical far-field positivities and N18 potentials are recorded uncontaminated by cortical potentials in the parietal region ipsilateral to stimulation (trace 4, left column), responses obtained in this region can be used as a baseline to assess cortical responses, either by superimposition to (middle column) or by substraction from (right column) the contralateral responses. This shows that neither the P20 and P22 potentials nor the P27 and N30 potentials peak at the same latencies. Moreover, the negativities (asterisks) recorded in the contralateral central (2) and midfrontal region disappears in different waveforms. They correspond to interruption of the widespread N18 (Figs. 48.4) by the cortical positive responses P27, P22, and P20. Due to the restricted filter bandpass used for this recording, the P14 amplitude is less than that of the P9 potential. (From Mauguière F, Holder GE, Garcia-Larrea L, et al. Evoked potentials diagnostic yield of evoked potentials. In: Osselton JW, Binnie CD, Cooper R., et al., eds. Clinical Neurophysiology: EMG, Nerve Conduction and Evoked Potentials. Oxford: Butterworth-Heinemann; 1995:431-563, with permission.) |
Sequential spatial maps of scalp-recorded SEPs have shown that the N20-P20 dipolar field is followed in the central region contralateral to stimulation by a positive P22 field peaking 1.0 to 2.5 msec with little or no negative counterpart on the scalp (111). This spatial distribution of this P22 central positivity suggests that its source is radial to the scalp surface. Most studies of SEFs failed to confirm such a source in the central region probably because magnetic recordings are blind to magnetic fields produced by dipolar sources radial to scalp surface (112, 113 and 114).
The question of whether the radial source of the central P22 is located behind the central sulcus, in the primary somatosensory area, or in front of it, in the primary motor area, is not easy to address by scalp recordings in normals, even when assisted by dipole modeling techniques based on a spherical head model (115,116). One argument in favor of a precentral origin of the P22 potential is that it may be selectively lost in patients with hemispheric lesions who have
normal sensations but signs of upper motor neuron dysfunction and selectively preserved in patients with hemianesthesia or astereognosis and no motor deficit (19,101, 102 and 103). Some direct cortical recordings in monkeys and humans, however, failed to identify a P22 in the precentral cortex (117,118) but individualized a surface-positive potential, labeled as P25, with a source radial to the scalp surface and located at the posterior edge of the rolandic fissure in Brodmann’s area 1. In an SEP and positron emission tomography (PET) study Ibañez et al. (119) reported that at stimulus rates between 4 and 16/sec SI was the only area showing a cerebral blood flow (CBF) increase, while at stimulus rates of 0.2 and 1 Hz no CBF change was induced by electrical stimulation of the median nerve. Lastly, a dipole modeling study of SEPs using realistic head models and constraining the solution in the individual brain MRI volume supported the data from direct cerebral recordings by showing that the P22 source is located at the crown of the postcentral gyrus (120). These data from cortical recordings and modeling of scalp responses are challenged by some experimental data in monkeys: (i) short-latency unit responses to somatosensory inputs can be recorded in the motor cortex (121,122) and (ii) early median nerve SEPs are recorded in the motor cortex (123). According to the data of Nicholson-Peterson et al. (123), the earliest cortical responses to upper limb stimulation are likely to result from the approximately coincident activation of at least three dipolar sources in areas 3b, 4, and 1 with orientations both opposing and orthogonal to each other. Sources in area 3b and 4 have opposite orientations tangent to the scalp surface, while the source located in area 1, at the crown of the postcentral gyrus, is oriented radial to the scalp surface. Thus, even if it would be hazardous to imagine a strict homology between SEP components in monkey and humans, due to the considerable anatomical differences between the two species, these experimental data support the contribution of the motor cortex to the N20-P20 and P22 scalp potentials.
normal sensations but signs of upper motor neuron dysfunction and selectively preserved in patients with hemianesthesia or astereognosis and no motor deficit (19,101, 102 and 103). Some direct cortical recordings in monkeys and humans, however, failed to identify a P22 in the precentral cortex (117,118) but individualized a surface-positive potential, labeled as P25, with a source radial to the scalp surface and located at the posterior edge of the rolandic fissure in Brodmann’s area 1. In an SEP and positron emission tomography (PET) study Ibañez et al. (119) reported that at stimulus rates between 4 and 16/sec SI was the only area showing a cerebral blood flow (CBF) increase, while at stimulus rates of 0.2 and 1 Hz no CBF change was induced by electrical stimulation of the median nerve. Lastly, a dipole modeling study of SEPs using realistic head models and constraining the solution in the individual brain MRI volume supported the data from direct cerebral recordings by showing that the P22 source is located at the crown of the postcentral gyrus (120). These data from cortical recordings and modeling of scalp responses are challenged by some experimental data in monkeys: (i) short-latency unit responses to somatosensory inputs can be recorded in the motor cortex (121,122) and (ii) early median nerve SEPs are recorded in the motor cortex (123). According to the data of Nicholson-Peterson et al. (123), the earliest cortical responses to upper limb stimulation are likely to result from the approximately coincident activation of at least three dipolar sources in areas 3b, 4, and 1 with orientations both opposing and orthogonal to each other. Sources in area 3b and 4 have opposite orientations tangent to the scalp surface, while the source located in area 1, at the crown of the postcentral gyrus, is oriented radial to the scalp surface. Thus, even if it would be hazardous to imagine a strict homology between SEP components in monkey and humans, due to the considerable anatomical differences between the two species, these experimental data support the contribution of the motor cortex to the N20-P20 and P22 scalp potentials.
Parietal P24 and P27 Potentials
These potentials are recorded in the parietal region contralateral to stimulation; their peaking latencies show large interindividual variations between 24 and 27 msec. In some subjects two distinct P24 and P27 can be identified while only one of the two peaks is observed in others. This explains why, according to the polarity-latency nomenclature, the first parietal positive potential following N20 has received various labels in literature (P24, P25, or P27). These variations reflect the fact that the activities of several parietal sources overlap in time in this latency range. The P27 potential was found to be abnormal in patients with focal lesions of the parietal cortex, presenting with astereognosis and normal N30 frontal responses (19,82). A P27 source in the primary somatosensory area (Brodmann’s area 1), radial to scalp surface, would accord with these findings. The P24 potential on its own is associated with a frontal N24 potential. The dipolar source of the P24-N24 field is tangent to scalp surface and thus presumed to be oriented perpendicular to the rolandic fissure. There is no report of a lesion affecting the P24 potential with preserved N20 and P27 potentials.
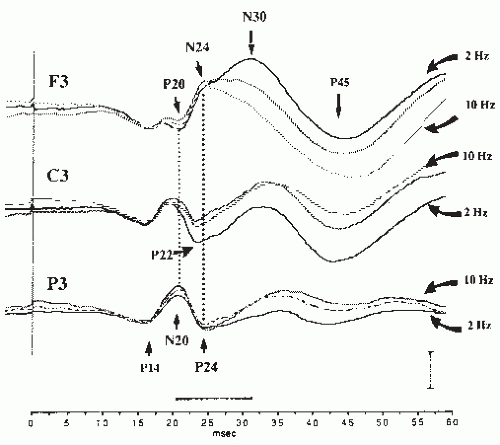 Figure 48.7 Identification of the P24-N24 dipolar field and frontal N30 responses. Responses to right median nerve stimulation have been recorded in the left parietal (P3), central (C3), and frontal (F3) regions at stimulus rates of 2 (thick traces), 5, and 10 Hz. The dipolar P24-N24 response is unaffected, while the frontal N30 is dramatically depressed, by increasing the stimulus rates. Calibration: 2 µV. (From Garcia-Larrea L, Bastuji H, Mauguière F. Unmasking of cortical SEP components by changes in stimulus rate a topographic study. Electroencephalogr Clin Neurophysiol. 1992;84:71-83, with permission.) |
Frontal N30 Potential (N24-N30 Complex)
The frontal potential, labeled as N30 in most clinical studies, has warranted much attention in the recent SEP literature because it shows some abnormality in patients with various types of motor disorders. It is picked up in the frontal region contralateral to stimulation; however, it often spreads to the midfrontal region and to the frontal region ipsilateral to stimulus. Its waveform shows two distinct components of which the earlier one, peaking at about 24 msec (N24), appears as notch on the ascending slope of the later one, which peaks at 30 msec (N30), and has the larger voltage of the two in normal young adults (Fig. 48.7).
There is now some consensus on the conclusions that the frontal negativity with its two N24 and N30 peaks cannot be generated by a single source (43,124,125) and that the early part (N24) of the frontal negativity corresponds to the polarity reversal of the parietal P24 potential across the central sulcus. The latter statement is supported by several observations issued from intracranial and scalp recordings:
In the latency range of the scalp N30 Allison et al. (126), using intracranial recordings during surgery, have identified a dipolar field, frontal negative and parietal positive, and considered it as generated by a source in area 3b, tangent to the scalp surface. Probably because of anesthesia this field reached its maximum at 30 msec and was labeled N30-P30 by these authors.
On the scalp the field distribution is clearly dipolar at the peaking latency of the N24 with a parietal positivity and a midfrontal negativity spreading to the frontocentral region. This dipolar potential field has been labeled N24-P24 (43) or N27-P27 (125), it corresponds to the N30-P30 of Allison et al. (126), and its distribution fits well with a dipolar source perpendicular to the rolandic fissure and tangent to the scalp.
The two negative frontal N24 and N30 components react differently to changes in stimulus rate (43,124,127). The early N24 remains unaffected if the stimulus frequency is increased up to 10 Hz, while the later N30 decreases at stimulus rates higher than 1/sec and is virtually absent at 10/sec.
Source modeling studies of scalp responses converge to the conclusion that the distribution of the scalp N24-P24 can be explained by a single source in the posterior bank of the central sulcus (115,128).
The administration of tiagabine, which enhances aminobutyric acid (GABA) inhibition, increases selectively the voltage of the N24-P24 dipolar field, suggesting that it could reflect the repolarization of the neuronal population that produces the N20-P20 field in area 3b (129).
Conversely the origin of the main N30 negativity of the frontal N24-N30 is still a debated issue. There has been a long controversy as to whether frontal N30 and parietal P27 components could have separate sources. Three early observations have supported the hypothesis that, contrary to the N24-P24 dipolar field, N30 does not represent the frontal counterpart of the parietal P27:
N30 amplitude decreases with aging while that of P27 increases (108).
N30 can be selectively absent, or decreased, with preserved parietal P27, in patients with focal lesions of the frontal lobe (19) or of the thalamus or internal capsule (101,130), presenting with motor symptoms and normal sensation.
N30 was found to be selectively reduced in Parkinson’s disease (PD) with a decrease of the N30-P27 amplitude ratio (see below).
Based on these findings it has been proposed that the N30 and P27 potentials originate in the precentral cortex and in the SI area (Brodmann’s area 1), respectively, each of these two dipolar sources being oriented perpendicular to the scalp surface. However, the existence of any N30 potential generated in the precentral cortex has been questioned by Allison et al. (126) and McCarthy et al. (118) on the basis of direct cortical recordings in monkeys and humans. The most convincing evidence that the N30 potential may have a frontal origin stems from several observations (see Ref. 25, for a review) suggesting that the N30 potential could be related with motor programming and generated in the premotor cortex of area 6, and more precisely in the supplementary motor area (SMA):
N30 was reported to be absent in a patient with a falx meningioma compressing the inner aspect of the precentral frontal cortex (131).
Voluntary movements of the fingers on the stimulated side were shown to exert a gating effect on frontal SEPs by reducing selectively the amplitude of N30, without effect on parietal potentials (131, 132, 133 and 134). This effect, which had been observed and to a certain extent overviewed by Papakostopoulos et al. (135), is less for simple than for complex fingers movements. Two mechanisms have been proposed to explain this selective gating of frontal SEPs by active movement. First, cortical motor neurons involved in finger movements could also account for part of the frontal SEPs and would be unable to respond simultaneously to the afferent volley triggered by the electric stimulation. The second mechanism is that of a corticocortical inhibition by which the motor neurons active during movements would suppress the response of cortical neurons involved in the generation of the N30 potential.
A gating of N30, but also of N24, occurs during movement preparation in reaction time paradigms where SEPs are recorded before movement onset (136).
The gating of N30 does not require that the intended movement be executed and also occurs when the subject mentally simulates a complex sequence of finger movements on the stimulated side (Fig. 48.8) (137,138). When the same mental
movement simulation (MMS) concerns the nonstimulated hand, or when the subject performs a mental task other than motor simulation, this gating effect does not occur. It has long been known that this MMS task increases the CBF in the SMA (139); this observation has been considered as indirect evidence that the SMA might be the generator of the N30 potential.
The N30 potential, as well as the homolog M30 magnetic field, is enhanced when the subject observes repetitive grasping movements or complex sequences of fingers movements performed by an examiner during stimulation. This effect is independent of the complexity of the observed movements; it has been interpreted as reflecting storage of subject’s somatosensory information connected with the observed movements (134) and related to the SMA activation observed in PET studies when subjects observe meaningful actions (140). However, if there is little doubt that the N30 amplitude is linked to motor programming, its origin in the SMA is challenged by data from direct cortical recordings, which favor an N30 dipolar source radial to the scalp surface, located in Brodmann’s area 1 of the SI cortex (104,126), and do not show an N30 potential in this area (141). Moreover, after subtraction of the N24-P24 field, the maximum of the remaining scalp N30 field has the same location as that of the P22 potential in the central region (125). This suggests that the N30 potential is generated close to the central sulcus and not in the premotor cortex, a view supported by most of the source modeling studies of early SEPs (142). Lastly, functional MRI studies have shown that all of cortical areas involved in actual movements, and not only the SMA, are activated during mental simulation of movements (143).
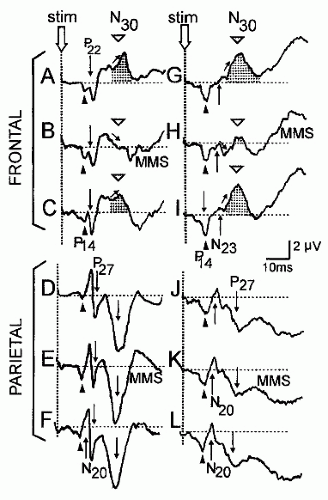 Figure 48.8 Gating of frontal SEPs during mental movement simulation (MMS). These responses were obtained in two distinct normal subjects (right and left traces) before (A,D,G,J), during (B,E,H,K), and after (C,F,I,L) mental simulation of movement. The dotted areas indicate the N30 potential surface above the baseline. Note that the N24 frontal potential, labeled N23 by the authors, and the parietal responses are not affected by mental imagery of movement. (From Cheron G, Borenstein S. Mental movement stimulation affects the N30 frontal component of the somatosensory evoked potential. Electroencephalogr Clin Neurophysiol. 1992;84:288-292, with permission.) |
If the origin of N30 in the SMA has not been verified, the possibility that it might be generated in the primary motor area has not been ruled out by direct recordings, or source modeling, of SEPs or SEFs. Conversely, source modeling studies supported this hypothesis (144). The movementrelated gating of N30, therefore, could reflect a similar change in motor cortex excitability both during movement and mental motor imagery. Studies using transcranial magnetic stimulation (TMS) converge to the conclusion that the excitability of the motor cortex is increased during actual movement and MMS (145,146), so that N30 amplitude would reflect the level of motor cortex inhibition. However, the fact that N30 and motor cortex inhibition are decreased during movement and motor imagery does not imply that the underlying mechanisms are the same in the two conditions. A TMS study by Ridding and Rothwell (147) suggests that, in spite of a similar effect of movement and motor imagery on N30 amplitude, activity in the circuits responsible for GABAergic inhibition of the motor cortex is reduced during voluntary contraction while motor imagery, which activates similar brain regions as overt movement but does not result in afferent input, does not produce significant changes in intracortical inhibition.
Ipsilateral Short-Latency Cortical Potentials Evoked by Upper Limb Stimulation in Direct Cortical Recordings
No early cortical potential is observed on the scalp ipsilateral to electrical stimulation of the median nerve in normal subjects as well as in the majority of direct cortical presurgical recordings in epileptic patients (127,148). However, four epileptic patients, of a series of 41 recorded at the Cleveland Clinic Foundation with subdural electrodes placed over the central area, showed a clearly identifiable early ipsilateral median nerve potential, the characteristics of which have been reviewed by Noachtar et al. (149). This response has an amplitude 4 to 16 times smaller than that of the contralateral SEP; it begins with a positivity restricted to one or two electrodes of the grid, which peaks 1.2 to 17.8 msec later than the earliest positivity following the N20 potential in the contralateral response. The maxima of ipsi- and contralateral positivities were distributed between 1 and 2 cm apart in the central region and, according to responses to electric stimulation of the cortex, the ipsilateral response was maximal anterior to the rolandic fissure in two of the four patients. The low incidence of ipsilateral responses suggests that they are generated by a small population of cortical neurons and can be missed by subdural recordings when their source is buried in a sulcus. Another possibility is that ipsilateral responses reflect plastic reorganization of the cortex occurring only in a minority of patients with an epileptogenic area in the central region. The functional significance of these ipsilateral responses and the nature of their afferent pathways remain speculative.
Middle- and Long-Latency SEPs to Upper Limb Stimulation
These responses have been identified either by scalp and cortical SEP recordings or through modeling of magnetic SEFs. They have not proved their clinical utility and most of them are modulated by cognitive factors. They are briefly described here to provide the reader with a comprehensive review of the field.
P45 and N60 Potentials
Both P45 and N60 potentials are recorded contralaterally to the stimulation in the central and the frontal regions. It is still debated whether they reflect the activation of associative cortical areas, via corticocortical connections, or cortical responses to inputs transmitted directly from the thalamus. Early SEP studies in patients with focal lesions have shown that P45 is preserved in patients with isolated loss of pain and temperature sensations (37,150,151). Moreover, it may persist in patients with lesion of the parietal cortex causing pure astereognosis and abnormal N20 or P27 over the damaged hemisphere (19,82). This latter finding suggests that the P45 potential might be generated by parallel ascending inputs rather than through corticocortical fibers originating from the SI generators of the N20-P27 potentials. Little is known about the N60 potential. The observation that its voltage reaches its plateau only when the intensity of the stimulus is increased up to seven times the sensory threshold has suggested that it might be generated by spinothalamic afferents, but lesion studies have hitherto failed
to confirm this hypothesis (Bastuji, Garcia-Larrea, and Mauguière, unpublished data). Recent intracranial recordings coupled with source modeling of scalp responses suggest that three distinct sources contribute to the N60: one is located in the frontocentral cortex contralateral to stimulation, and the two others are located in the suprasylvian cortex (somatosensory area SII) on both sides (152). In scalp recordings two distinct components can be identified on the basis of their latencies and scalp distributions, namely, a frontocentral N60 contralateral to stimulation and a bilateral N70 in the temporal regions. Thus, none of the scalp-negative potentials identified as N60 or N70 in the literature has been shown to be generated in the posterior parietal cortex.
to confirm this hypothesis (Bastuji, Garcia-Larrea, and Mauguière, unpublished data). Recent intracranial recordings coupled with source modeling of scalp responses suggest that three distinct sources contribute to the N60: one is located in the frontocentral cortex contralateral to stimulation, and the two others are located in the suprasylvian cortex (somatosensory area SII) on both sides (152). In scalp recordings two distinct components can be identified on the basis of their latencies and scalp distributions, namely, a frontocentral N60 contralateral to stimulation and a bilateral N70 in the temporal regions. Thus, none of the scalp-negative potentials identified as N60 or N70 in the literature has been shown to be generated in the posterior parietal cortex.
Responses of the Second Somatosensory Area (SII)
The most precise available descriptions of the human SII area have long been those by Penfield and Rasmussen (153) and Woolsey et al. (154) based, respectively, on electrical stimulation and intracortical recordings of SEPs. They showed a single complete representation of the body located lateral to the end of the rolandic fissure on the dorsolateral surface of the hemisphere and extending to the cortex of the upper bank of the sylvian fissure, contrasting with the multiple body maps identified in the lateral sulcus of monkey’s brain (155,156). The clinical deficit resulting from SII lesions is also more controversial than that observed after SI lesions. While Penfield and Roberts (157) concluded that removal of SII is followed by “no obvious sensory or motor defect,” it has been reported that a lesion of the suprasylvian somatosensory cortex produces a deficit in tactile object recognition by the opposite hand (158). However, this observation, based on clinical and MRI data, has not been correlated with abnormalities of perisylvian SEPs; moreover, it has not been checked either that the SI responses were normal in these patients.
The existence of short-latency SEPs generated in SII peaking earlier than 40 msec after median nerve stimulus remains a debated issue in the literature. Lüders et al. (159), using an array of 96 subdural electrodes in a single epileptic patient, recorded responses to contralateral median nerve and finger stimulation in the inferior frontal gyrus, peaking only 2.4 msec later than SI-evoked responses that they considered as originating in the SII area. However, these authors failed to record such early responses ipsilateral to stimulation, and the measurement area was clearly anterior to the cortical zone producing longer latency perisylvian responses in human corticograms (117). Of the numerous MEG studies of SII responses to median nerve stimulation, only that of Karhu and Tesche (160) found neuromagnetic activity in the SII area starting 20 to 30 msec after contralateral stimulus, simultaneously, or even before the first activation in SI area. Lastly, recent stereotactic recordings in the suprasylvian cortex have confirmed early bilateral responses peaking at about 30 msec in area SII (161).
If the existence of early SEPs in SII warrants confirmation, that of SII responses peaking in the 60- to 120-msec latency range has been confirmed by several investigators using various electrophysiologic approaches. Because it picks up selectively magnetic fields produced by current sources located in the fissural cortex and tangent to the scalp surface (see Ref. 162, for a review), MEG was the earlier noninvasive technique that permitted individualizing the somatosensory response from the SII area, which is buried in the sylvian fissure. More than 20 years ago median nerve magnetic SEFs peaking in the 100-msec latency range were recorded with a scalp topography compatible with sources located in the parietal operculum of both hemispheres, more precisely in the superior surface of the sylvian fissure posterior to the crossing point of the rolandic and sylvian fissures (42,45). These SEFs originating from parietal opercular sources were shown (a) to be more variable from one subject to another than SI SEFs, (b) to be very sensitive to the ISI, and (c) to have a somatotopic organization (163,164). Early corticographic recordings on the surface of suprasylvian cortex also showed responses, interpreted as originating in SII, peaking in the 100- to 120-msec latency range, ipsi- and contralateral to the stimulus and sensitive to the ISI and task condition (see Ref. 165, for a review).
These latter potentials identified as SII responses can be recorded in scalp and deep recordings of median nerve SEPs. In scalp recordings P100 and N120 potentials are consistently recorded in the central and temporal regions opposite to finger stimulation, respectively (166). The field distribution of the N120 response is compatible with a generator located in the SII area contralateral to stimulus. At a latency of about 140 msec, a scalp negativity distributed over both central regions and the vertex is of maximal amplitude when the subject has his attention drawn to the stimulus and is instructed to mentally count the stimuli. This response is modulated by attention and shows the same behavior as the endogenous processing negativity originally described in response to auditory tones (see Ref. 167, for a review). Bilateral activation of SII areas could contribute to the generation of this N140 negativity, but, in the absence of confirmative source modeling or lesions studies, this hypothesis remains conjectural.
Direct intracortical recordings using electrodes stereotactically implanted in the upper bank of the sylvian fissure have shown an N60-P90 response to median nerve stimulation (Fig. 48.9) that represents one of the most robust cortical somatosensory response recorded outside the central parietofrontal cortex in humans (168,169). Contrary to that of SI responses, the amplitude of the SII potentials does not saturate at stimulus intensities of three to four times the sensory threshold but continues to increase up to and above the pain threshold (170). Ipsilateral SII responses are consistently recorded by depth electrodes; they peak 10 to 12 msec later than contralateral ones, a delay compatible with a transcallosal interhemispheric transmission. The difference between latencies of surface SII responses recorded by corticography and depth responses obtained by stereotactic recordings is unclear. It is probable that the first N60 potential of depth recording is not picked up on the cortical surface because its amplitude is far less than that of the following P90 response.
Long-Latency Responses of the Posterior Parietal, Mesial, and Frontal Cortex
Using a whole-head 122-superconducting quantum interference device (SQUID) magnetometer, SEF sources has been modeled in the posterior parietal (46) and mesial cortex (47)
contralateral to stimulation and in both frontal lobes (171,172), which are all active in the 70- to 160-msec latency range, in response to stimuli delivered at long ISIs, in particular when mentally counted by the subject. Intracortical recordings lend some substance to these SEF dipole modeling findings (163). Scalp recordings of SEPs, however, do not allow one to identify components reflecting specifically the activities of these sources, as identified from SEF modeling, probably because the field distribution reflects simultaneous activation of multiple and largely distributed sources at these latencies. Moreover, there is no available study demonstrating abnormal SEP or SEF profiles associated with focal lesions affecting the cortical regions proposed as generators of these long-latency responses.
contralateral to stimulation and in both frontal lobes (171,172), which are all active in the 70- to 160-msec latency range, in response to stimuli delivered at long ISIs, in particular when mentally counted by the subject. Intracortical recordings lend some substance to these SEF dipole modeling findings (163). Scalp recordings of SEPs, however, do not allow one to identify components reflecting specifically the activities of these sources, as identified from SEF modeling, probably because the field distribution reflects simultaneous activation of multiple and largely distributed sources at these latencies. Moreover, there is no available study demonstrating abnormal SEP or SEF profiles associated with focal lesions affecting the cortical regions proposed as generators of these long-latency responses.
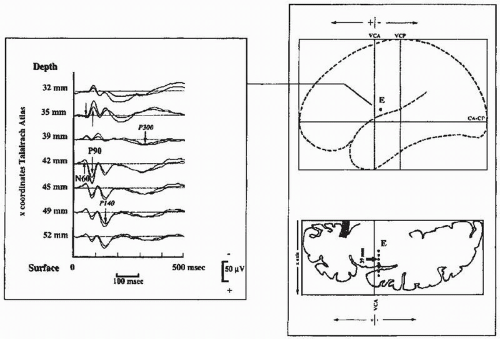 Figure 48.9 N60-P90 intracortical responses recorded in the parietal operculum (SII area) after electric stimulation of the median nerve at the wrist. (From Frot M, Mauguière F. Timing and spatial distribution of somatosensory responses recorded in the upper bank of the sylvian fissure (SII area) in humans. Cereb Cortex. 1999;9:854-863, with permission.) |
Short-Latency SEPs to Lower Limb Stimulation
Electrical stimulation of the tibial nerve at the ankle is adopted by most authors for the testing of the sensory pathways of the lower limb. However, the electrical stimulation can also be applied to the sural nerve at the ankle or to the peroneal nerve at the knee without major changes in the general waveform of the spinal or scalp responses. As compared with tibial nerve SEPs, only the peaking latencies are modified; they are delayed by about 3 msec or shortened by about 5 to 6 msec, respectively, for sural and peroneal nerve stimulation. In what follows, tibial nerve SEPs are taken as the reference for describing the normal waveforms (Fig. 48.10).
Peripheral Nerve Response
A CAP corresponding to the activation of tibial nerve fibers is recorded at the posterior aspect of the knee using a bipolar montage. The negative peak of this near-field potential peaks at a latency of about 7 msec in adults. This N7 potential reflects a mixed response of motor and sensory fibers, which is clinically useful to assess the function of the peripheral segment of the pathway. The afferent volley in cauda equina roots can be recorded using skin electrodes placed at the L5-S1 level and a distant reference site, for instance at the knee opposite to the stimulation.
Spinal Potentials
An electrode situated on the spinal process of T12 or L1 vertebrae and connected to a distal reference electrode records a spinal negative potential peaking at 21 to 24 msec in normal subjects. According to different authors, this segmental response has been labeled N20 (173), N21 (174), N22 (175,176), N23 (177), or N24 (178). These differences in nomenclature are mostly due to differences in the mean body height of the subjects sampled for
normative studies. In what follows this response is labeled N22. After tibial nerve stimulation the lumbar N22 originates mostly from the spinal segment receiving fibers from the S1 root (173, 174 and 175,178, 179, 180, 181 and 182).
normative studies. In what follows this response is labeled N22. After tibial nerve stimulation the lumbar N22 originates mostly from the spinal segment receiving fibers from the S1 root (173, 174 and 175,178, 179, 180, 181 and 182).
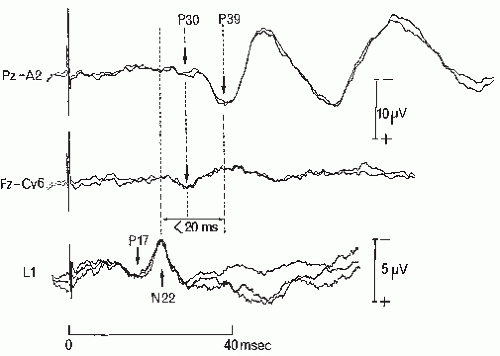 Figure 48.10 Short-latency tibial nerve SEPs. The segmental lumbar P17 response at the spinous process of the L1 vertebra was recorded using a reference electrode at the knee contralateral to the stimulation of the tibial nerve at the ankle. For scalp response recording the reference was placed at the right earlobe (A2) (see text for a detailed description). (From Mauguière F. Evoked potentials. In: Osselton JW, Binnie CD, Cooper R, et al., eds. Clinical Neurophysiology: EMG, Nerve Conduction and Evoked Potentials. Oxford: Butterworth-Heinemann; 1995:325-563, with permission.) |
As all segmental DH responses (see Ref. 49, for a review) the N22 demonstrates a polarity reversal when recorded anterior to the cord, a field distribution consistent with a horizontal dipolar source reflecting the postsynaptic response of DH neurons to incoming inputs. The N22 amplitude is maximal close to the entry zone of the S1 root in cord surface recordings and decreases steeply without any latency shift at more rostral or caudal electrode sites (57). The N22 potential is followed by a slow positivity, known as the P wave, which reverses into a negativity when recorded at the anterior aspect of the cord (56,183) and may reflect the processes of presynaptic inhibition affecting the primary afferent fibers in the DH. In intraoperative direct recording of the cord, several fast negativities are superimposed on the ascending slope of the N22; they reflect the action potentials ascending in the DCs. In most skin surface recordings these negativities cannot be individualized.
When the reference electrode is not situated on the axis of propagation of the peripheral ascending volley, the N22 potential is preceded by a small positivity peaking around 17 msec. This P17 positivity is a far-field potential originating in lumbosacral plexus trunks, which can also be recorded occasionally on the scalp when the reference electrode is placed at the knee (or iliac crest) on the nonstimulated side (177,178).
Scalp Far-Field P30 Potential
With appropriate noncephalic reference montages widespread far-field positivities, other than the P17 described earlier, can be recorded on the scalp that peak before the onset of the earliest cortical potential in the 25- to 32-msec latency range (177,178,184). Only the latest of these positivities, identified by Yamada et al. (177) as the P31 potential, is consistently recorded in normals after tibial nerve stimulation at the ankle. This observation was confirmed by several investigators who labeled this potential as P28 (185,186), P30 (187, 188, 189 and 190), or P31 (178,191). The latency of this potential varies according to body height and is labeled P30 in this chapter according to the author’s normative data.
The utility of the P30 potential has been validated for clinical applications of tibial SEPs in patients with spinal cord and brainstem lesions (192,193). The P30 potential is widely distributed on the scalp with a predominance in the frontal region (187,188) and therefore is drastically reduced in scalp-reference recordings (191). When recorded with electrodes located in the fourth ventricle during surgery, this potential shows the same intracranial spatiotemporal distribution as the P14 component of median nerve SEPs (189). Therefore, the P30 potential is likely to be generated in the brainstem (177,178) and can be viewed as the homolog, for the lower limb, of the far-field P14 recorded on the scalp after median nerve stimulation.
Recording of P30 is made easier if the scalp electrode is placed in the midfrontal region at Fz or Fpz, where P30 has its maximal amplitude with minimal contamination by subsequent cortical potentials. If electrodes are too posteriorly situated, P30 may be lost in the descending slope of the cortical P39 potential. The most practical reference site for recording of P30 is the nucha at the spinous process of the sixth cervical vertebra (191,192). Since no segmental response is evoked by lower limb stimulation at the cervical cord level, the neck can be considered as virtually inactive at the peaking latency of P30. The ascending volley in spinal somatosensory pathways reaches the cervical level at a latency of about 27 msec but, due to the time dispersion of afferent impulses, no consistent potential is recorded by a skin cervical electrode at this latency. In some normal subjects a scalp far-field P27 potential distinct from P30 is recordable in the frontal region, which reflects the ascending volley in the cervical cord (177,178).
N33 Scalp Potential
In noncephalic or earlobe reference recordings a small N33 negativity (187,188) may precede the P39 potential. This negativity is widely distributed over the scalp; part of it is also picked up at the earlobe so that it is reduced in earlobe reference recordings. Because some of the cortical potentials are picked up at the earlobe contralateral to stimulation, it is preferable to use the earlobe ipsilateral to stimulation as the reference site for the recording of cortical tibial nerve SEPs (194). N33 is considered as the homolog of the N18 upper limb SEP and is likely to have a similar origin in the lower brainstem (see “N18 scalp negativity” above).
Cortical Potentials
The earliest cortical potential elicited by the stimulation of tibial nerve at the ankle is a positive potential usually labeled P37, P39, or P40 for it peaks at a mean latency of 37 to 40 msec in normal subjects (see Ref. 195, for a review). In what follows this
potential is labeled P39. This potential peaks 6 to 7 msec earlier after stimulation of the tibial nerve at the popliteal fossa, and about 3 msec later after stimulation of the sural nerve at the ankle. In normal subjects P39 is recordable on the vertex and can be reliably obtained midway between Pz and Cz using a scalp to earlobe montage. Frequently the maximum of P39, although close to the midline, is slightly shifted on the side of the scalp ipsilateral to the stimulation (196). The most likely reason for this paradoxical lateralization is that the somatotopic representation of the lower limb in the somatosensory SI, and in particular that of the foot, is situated at the inner aspect of the hemisphere. This paradoxical scalp distribution of P39 is not observed when the proximal leg is stimulated, for instance after stimulation of the femoral nerve or lateral femoral cutaneous nerve (197,198). SEP mapping in normals often shows a dipolar field distribution for P39, with a maximum of positivity ipsilateral to the stimulation in the parietal region and a maximum of negativity (N39) in the contralateral frontocentral region (44,187,191,196,199). Magnetic fields evoked by stimulation of the lower limb also show this distribution (42,200). The negative N39 maximum of this dipole is not consistently obtained, probably because of intersubject differences in the orientation of the leg area in SI with respect to the scalp surface, so that one can envisage all intermediates between a vertical radial dipole with a positive maximum on the vertex, and a nearly tangential one with a P39 and N39 culminating, respectively, in the ipsi- and contralateral parietal regions. As for median nerve SEPs, the question is still debated whether all of these potentials reflect the activity of the lower limb area in SI or whether some could be generated in other cortical areas. Another question is to determine whether the P39-N39 dipolar field has a single source in SI tangent to the scalp (191,196,199,201,202), or several (184,203, 204 and 205). Studies on the effect of the frequency rate on cortical SEP amplitude favor the latter hypothesis by showing the following:
potential is labeled P39. This potential peaks 6 to 7 msec earlier after stimulation of the tibial nerve at the popliteal fossa, and about 3 msec later after stimulation of the sural nerve at the ankle. In normal subjects P39 is recordable on the vertex and can be reliably obtained midway between Pz and Cz using a scalp to earlobe montage. Frequently the maximum of P39, although close to the midline, is slightly shifted on the side of the scalp ipsilateral to the stimulation (196). The most likely reason for this paradoxical lateralization is that the somatotopic representation of the lower limb in the somatosensory SI, and in particular that of the foot, is situated at the inner aspect of the hemisphere. This paradoxical scalp distribution of P39 is not observed when the proximal leg is stimulated, for instance after stimulation of the femoral nerve or lateral femoral cutaneous nerve (197,198). SEP mapping in normals often shows a dipolar field distribution for P39, with a maximum of positivity ipsilateral to the stimulation in the parietal region and a maximum of negativity (N39) in the contralateral frontocentral region (44,187,191,196,199). Magnetic fields evoked by stimulation of the lower limb also show this distribution (42,200). The negative N39 maximum of this dipole is not consistently obtained, probably because of intersubject differences in the orientation of the leg area in SI with respect to the scalp surface, so that one can envisage all intermediates between a vertical radial dipole with a positive maximum on the vertex, and a nearly tangential one with a P39 and N39 culminating, respectively, in the ipsi- and contralateral parietal regions. As for median nerve SEPs, the question is still debated whether all of these potentials reflect the activity of the lower limb area in SI or whether some could be generated in other cortical areas. Another question is to determine whether the P39-N39 dipolar field has a single source in SI tangent to the scalp (191,196,199,201,202), or several (184,203, 204 and 205). Studies on the effect of the frequency rate on cortical SEP amplitude favor the latter hypothesis by showing the following:
N39 and P39 can show some difference in their respective latencies, the former peaking earlier than the latter; this explains why some authors have proposed labeling these potentials N37 and P40, respectively (195).
P39 is selectively reduced with preserved N39 in patients with motor neuron disease (206).
P39 is reduced at high stimulation rates (2,185), while the frontal N39 amplitude remains unaffected at stimulus rates up to 7.5 Hz (44).
Source modeling studies of scalp responses (207) and direct intracerebral recordings (208) have suggested that two sources located in the central region are quasi-simultaneously involved in the generation of the N39-P39 field on scalp surface. One is indeed tangential to scalp surface and responsible for a dipolar field with a positive maximum in the centroparietal region ipsilateral to stimulus and a negative maximum in the frontotemporal region contralateral to stimulus. The other is perpendicular to scalp surface and responsible for part of the vertex P39 potential.
Studies of the effects of movement on cortical tibial SEPs have shown that P39, but not N39, is gated during voluntary movement of the stimulated foot (128,208,209). During tonic contraction this effect is proportional to the level of muscle strength maintained by the subjects. These findings have been interpreted in different ways according to the different source models. Tinazzi et al. (210) proposed that P39 could be generated in the motor cortex, while N39 could be the equivalent of the median nerve N20 and generated in area 3b in the SI area. Valeriani et al. (128,208) considered that only the radial central source of the vertex P39, possibly located rostral to the central sulcus, is sensitive to voluntary movements.
P39 is followed by N50 and P60 components, these three waves forming the “W” profile (P39-N50-P60) of the cortical response recorded in the centroparietal region. This waveform has been reported in all studies on tibial nerve SEPs (see Ref. 194, for a review). Electrical stimulation of the L5 and S1 dermatomes also evokes a consistent W-shaped response on the scalp with a first positivity at about 50 msec after stimulation (211). The N50 and P60 potentials culminate at the vertex (Cz) and do not show the same clear dipolar distribution as the P39-N39 response on the scalp, thus suggesting that the W-shaped P39-N50-P60 waveform could be generated by several sources with distinct orientations (187,188). There is no clinical study demonstrating that the N50 or P60 potential can be selectively affected by a single focal lesion, and these two potentials show the same attenuation as P39 during active movement (209). Conversely it is not exceptional in demyelinating diseases to see a single persisting positivity peaking at the P60 latency while the P39 potential cannot be identified.
Scalp SEPs Evoked by Stimulation of the L5 and S1 Dermatomes
Electrical stimulation of the L5 and S1 dermatomes, applied at the medial side of the first metatarsophalangeal joint and at the lateral side of the fifth metatarsophalangeal joint, respectively, yields consistent W-shaped evoked potentials on the scalp (211). These dermatomal potentials are obtainable by using a derivation between electrodes placed at Cz (lead 1) and midway between Fpz and Fz (lead 2), a filter bandpass of 5 to 250 Hz, a stimulus rate of about 3/sec, and a stimulus strength of 2.5 times sensory threshold. This gives about 80% of the maximal response and is tolerated by normal subjects. The first scalppositive potential peaks at mean latencies of about 48.5 and 50 msec, respectively, for stimulation of the L5 and S1 dermatomes. This technique is especially useful for exploring L5 and S1 monoradiculopathies, as stimulation of a single peripheral nerve containing fibers that enter the cord via multiple roots may give normal responses, mediated through the unaffected roots.
Short-Latency SEPs to Pudendal Nerve Stimulation
Related posts:

Stay updated, free articles. Join our Telegram channel

Full access? Get Clinical Tree


