and Kelly Del Tredici1
(1)
Zentrum f. Biomed. Forschung AG Klinische Neuroanatomie/Abteilung Neurologie, Universität Ulm, Ulm, Germany
9.1 NFT Stage III: Progression into the Basal Temporal Neocortex, Including Portions of the Fusiform and Lingual Gyri, Involvement of Superordinate Olfactory Centers and the Limbic Thalamus
The pathology seen at stage III still is concentrated chiefly in select allocortical regions and related transition areas. From there, it encroaches only to a limited extent upon the adjoining mature temporal neocortex (Figs. 9.2a and 9.13). The tau lesions that were present during NFT stage II worsen (Fig. 9.1g–i), and subcortical lesions occur in all brainstem nuclei with diffuse cortical projections. This tau pathology slowly increases and reaches its greatest extent in stage VI. In stage III, AD-associated tau lesions occur in small numbers of α-motoneurons of the spinal cord ventral horn (Fig. 9.6b) (Dugger et al. 2013). In addition, the lesions appear in the brainstem nuclei that regulate the extrinsic muscles of the eyes, above all the rostral interstitial nucleus of the medial longitudinal fascicle, and, to a somewhat lesser extent, the Edinger Westphal nucleus, nucleus of Darkschewitsch, and interstitial nucleus of Cajal. As a result, it would come as no surprise if the involvement of these regions were to be accompanied clinically by a slowing of vertical saccades (Rüb et al. 2001a).
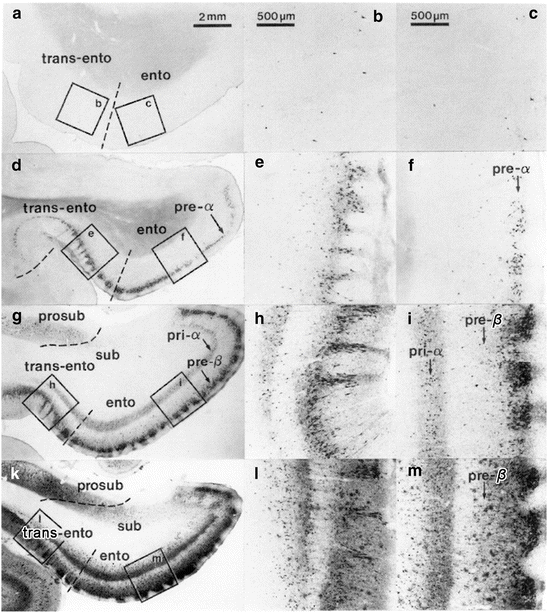
Fig. 9.1
Gradual progress of destruction of both transentorhinal and entorhinal regions during NFT stages I–IV in 100 μm sections (Gallyas silver-iodide technique). The insets provide overviews, with framed areas indicating the locations of the micrographs shown at the right at higher magnification. At the left, portions of the transentorhinal regions (trans-ento) and entorhinal regions (ento) appear with the pial surface oriented downward. These are supplemented by portions of the transentorhinal (b, e, h, l) and entorhinal (c, f, i, m) regions with the pial facing toward the right at higher magnification. Reproduced with permission from H Braak and E Braak, Temporal sequence of Alzheimer’s disease-related pathology. Cerebral Cortex 1999;14:475–512
These developments are accompanied by the appearance of the first abnormal tau aggregates in anterosuperior portions of the reticulate nucleus of the thalamus as well as in limbic subnuclei of the thalamus (reuniens nucleus and anterodorsal nucleus) (van der Werf and Groenewegen 2002). In addition, with the beginning involvement of the central subnucleus of the amygdala, the high order processing nuclei of the autonomic system are drawn into the pathological process. Further brainstem nuclei that display prominent changes already during stage III include the mesencephalic medial and lateral parabrachial nuclei, the subpeduncular nucleus, and the intermediate zone of the medullary reticular formation (Rüb et al. 2001b). At each of these sites, the sequence is the same: First, AT8-ir lesions develop, and these subsequently convert into argyrophilic NT/NFTs.
In stage III, the lesions expand into superordinate components of the olfactory system, including the olfactory tract, piriform and periamygdalear areas, and olfactory portions of the amygdala and entorhinal region (Christen-Zaech et al. 2003; Kovács 2013). The outer cellular layers of the entorhinal region (pre-α, pre-β, pre-γ) become filled with a mesh of AT8-ir neurites (Fig. 9.4a, b), whereas the pale lamina dissecans exhibits only a few radially oriented neuronal processes. The striking devastation of pre-α projection cells is a key feature of stage III (Fig. 9.2a, b). Isolated neurons in these layers die at this early stage and leave behind tombstone tangles (Fig. 9.4g, h). The deep layer pri-α also is heavily involved and gradually thins within the transentorhinal region, as it approaches the temporal neocortex (Fig. 9.1g–i). It is noteworthy that the two most heavily involved layers (pre-α and pri-α) are chiefly responsible for the bidirectional transfer of data between the neocortex, entorhinal region, and hippocampal formation (Fig. 6.4c, d).
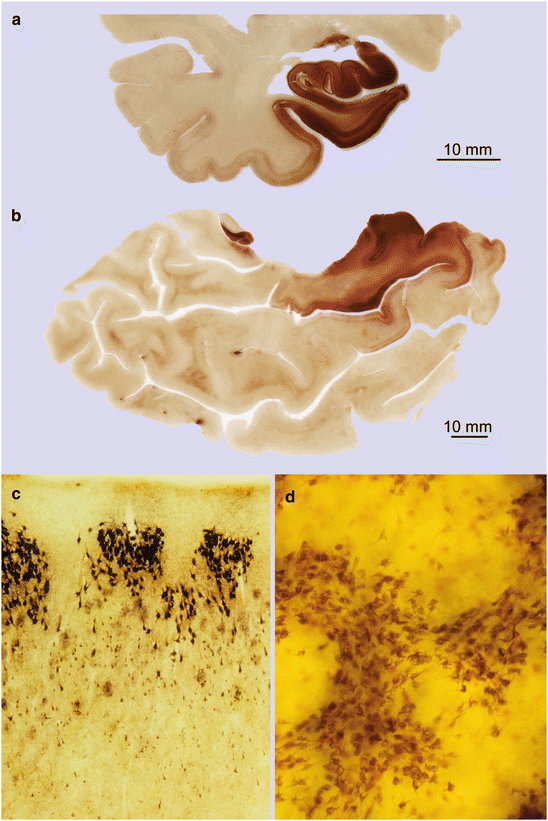
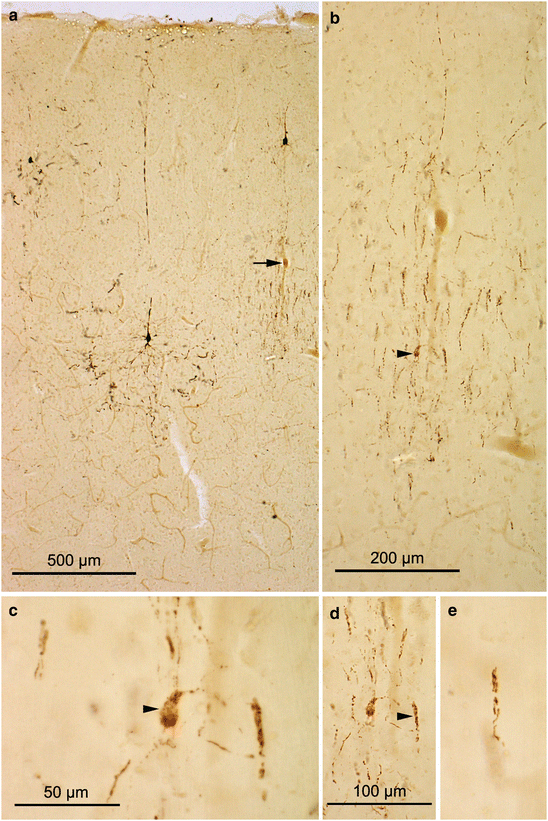
Fig. 9.2
Overview of the extent of tau pathology during NFT stage III in 100 μm sections. (a) The hippocampal formation, entorhinal region, and transentorhinal regions are heavily involved in cases showing NFT stage III. From there, the lesions characteristically progress into the adjoining basal temporal neocortex that covers the occipitotemporal gyrus. Note that the density of the pathology gradually decreases and generally does not reach the inferior temporal gyrus (65-year-old male, NFT stage III, Aβ phase 2). (b) This tangential section shows superficial portions of the entire temporal lobe. Most densely affected is the entorhinal region of the parahippocampal gyrus, from where lesions progress to a limited extent into adjoining fields of the basal temporal neocortex (89-year-old female, NFT stage III, Aβ phase 1). (c) In NFT stage III cases, the cellular islands of the pre-α layer are particularly heavily involved and may even show the first tombstone tangles. The subjacent layer pre-β begins to show pathological changes. (d) Flat section providing a bird’s eye perspective of layer pre-α with its leopard skin-like pattern. AT8 immunoreactions (a, b) and Gallyas silver-iodide technique (c, d)
Fig. 9.3
Chandelier cells in 100 μm AT8-immunostained sections. (a) Overview of the basal temporal neocortex covering the occipito-temporal gyrus (54-year-old female). A few AT8-ir pyramidal cells in layer III display typical early reactions in their distal dendritic segments. Arrow points to a nearby ensemble of axon terminals belonging to an AT8-ir chandelier cell. (b) The same cell in greater detail. A large number of candle-like axon terminals is loosely arranged around the cell body (arrowhead). (c) The soma (arrowhead) gives rise to thin AT8-ir dendrites. (d) Detail of the single candle-like formation (arrowhead) seen in detail in (e)
The presubiculum and subiculum are still uninvolved. At the same time, the involvement of pyramidal cells in the superficial layer of CA 1 and in CA 2 becomes more pronounced: Transient pathological alterations develop in apical dendrites of the outer CA 1 pyramidal cells. Conspicuous spindle-shaped dilations develop in the stratum lacunosum-moleculare and are filled, initially, with AT8-ir inclusions and, later, argyrophilic material (Fig. 9.5). These dilations first appear in a few cells during NFT stage II (Fig. 9.5a) and are most pronounced in stage III (Fig. 9.5b) (Braak and Braak 1997a). Such varicose segments vanish from the tissue during NFT stages IV and V without leaving behind any remnants, probably because the dendritic material can be eliminated (as opposed to tombstone tangles). The end result is that the contact zone between the perforant pathway and CA 1 pyramidal cells is lost, thereby partially disconnecting the neocortex from the hippocampal formation (Kemper 1984; Hyman et al. 1988, 1990; van Hoesen and Hyman 1990; Delbeuck et al. 2003).
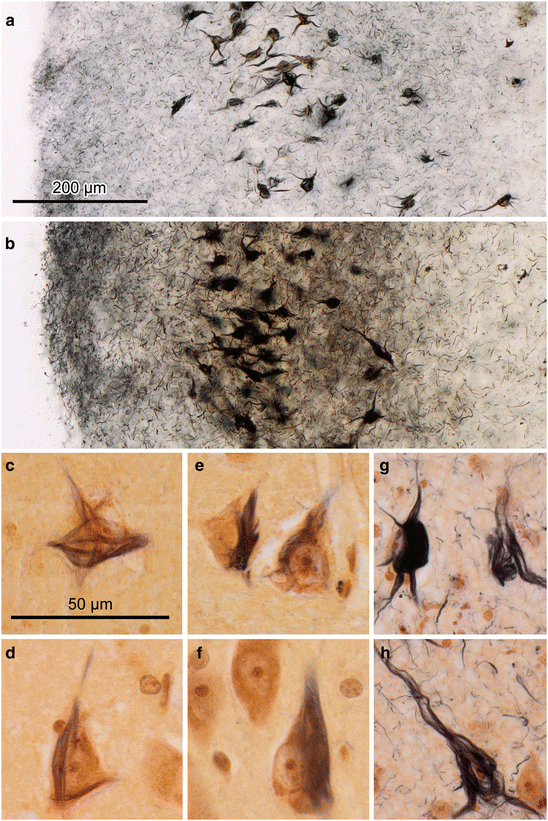
Fig. 9.4
Neurofibrillary pathology in the entorhinal layer pre-α as seen in 100 μm sections (Gallyas silver-iodide technique). (a) Mildly involved pre-α at NFT stage II. Mature NFTs are seen in projection cells of layer pre-α, and a dense network of NTs begins to develop in superficial portions of the layer and the adjacent molecular layer (NFT stage II). (b) A dense network of NTs is seen above heavily involved layer pre-α cells at NFT stage V. The network of NTs loses both its immunoreactivity as well as its argyrophilia because it consists to a large extent of dendritic branches that no longer are connected to their proximal stems, i.e., tombstone NTs (82-year-old female AD patient, NFT stage V). (c–h) Development of neurofibrillary changes in layer pre-α as seen using the Gallyas silver-iodide technique combined with pigment-Nissl staining (aldehydefuchsin and Darrow red). (c, d) Initially, NFTs in pre-α cells cause no clearly negative response (60-year-old male, NFT stage I). (e, f) Consolidation of a sturdy NFT. A comparison with uninvolved neighboring neurons does not reveal obvious reactive changes (same individual as in c and d). (g, h) Dying NFT-bearing nerve cell at the left side in (g) allows comparison with tombstone tangles in (g) and (h) (60-year-old male AD patient, NFT stage VI). Scale bar in (a) applies to (b). Scale bar in (c) applies to micrographs (d–h)
The CA 2 sector usually becomes filled with strongly AT8-ir pyramidal cells during stage III. Frequently, but not always, CA 2 is the earliest sector involved. The appearance and development of the tau lesions in CA 3/CA 4 lags behind those in CA 1/CA 2. The first AT8-ir mossy cells appear in CA 3/CA 4 with star-shaped NFTs that fill the characteristically large dendritic excrescences (Blazquez-Llorca et al. 2011). In the dentate fascia, the granule cells remain uninvolved.
From the transentorhinal region, the lesions encroach upon temporal neocortical areas adjoining the transentorhinal region laterally (Fig. 9.2a, b) and posteriorly, i.e., in areas covering the fusiform and lingual gyri (Fig. 9.2b). Neocortical involvement during stage III is confined to the basal regions of the temporal lobe and diminishes markedly beyond them (Fig. 9.2b). The propagation of the disease process into the mature neocortex probably takes place via cortico-cortical projections of the return pathway and is supported by diffuse projections from subcortical sites (Fig. 6.8e). Consistent with the fact that cortical layer IV is virtually spared in AD, the spreading of the pathology from periallocortical fields into the temporal proneocortex and neocortex is likely to occur via the pyramidal cells in layer V, whose axons mostly terminate in layers I, III, and VI of their target areas and have very few interconnectivities with layer IV (Fig. 6.8e).
9.2 Involvement of Neocortical Chandelier Cells
During NFT stage III, while the pathological process progresses from the transentorhinal region into adjacent portions of the basal temporal neocortex, chandelier cells in these involved areas also develop abnormal tau (Braak et al. 2006b). Elsewhere, such local circuit neurons are not known to become involved in the AD process (see Sect. 2.2). Nonetheless, their highly atypical reaction at precisely this site and at this stage is noteworthy and possibly of importance for the pathogenesis of AD.
Inhibitory cortical chandelier cells belong to the class of gabaergic local circuit neurons with smooth dendrites, i.e., dendrites that do not have spiny appendages. Chandelier cells usually remain devoid of lipofuscin granules or develop only a few (Braak 1980). Their distinctively arborized axons (Fig. 9.3a, arrow) give off vertically-oriented rows of symmetrical synapses attached to the initial segment of axons of cortical pyramidal cells. By means of these axo-axonic contacts, the chandelier cells can inhibit the generation of action potentials (Howard et al. 2005; Woodruff et al. 2010; Benarroch 2013). Among the various forms of local circuit neurons and other neuronal types that have few or no lipofuscin granules, the chandelier cells are the only ones in which non-fibrillar AT8-ir material occasionally develops (Braak et al. 2006b).
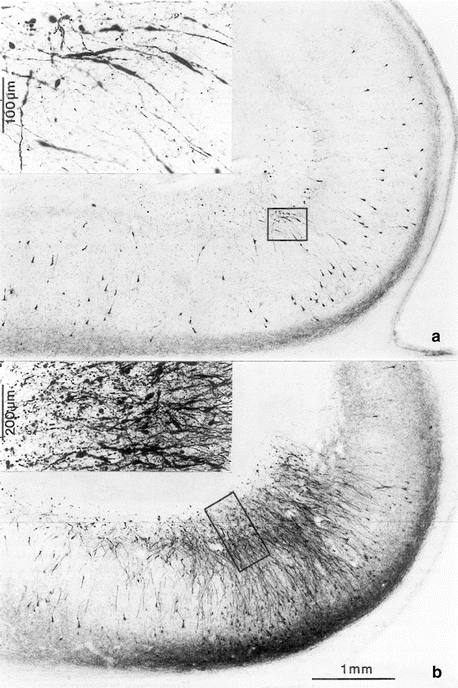
Fig. 9.5
CA1 pyramidal cells with transient dendritic spindles in AT8-immunostained 80 μm sections. The apical dendrites of CA1 pyramidal cells develop spindle-shaped dilations (the insets correspond to the framed areas at higher magnification). (a) The spindle-shaped dilations appear in NFT stage II and are most developed in NFT stage III in (b) (reproduced with permission from H Braak and E Braak, Temporal sequence of Alzheimer’s disease-related pathology. Cerebral Cortex 1999;14:475–512)
Involved chandelier cells usually are seen in the superficial layers (II–III) of the basal temporal lobe, where the AT8-ir material, notably, initially appears in and mostly remains confined to the axon. Nevertheless, the typical axonal morphology permits a reliable diagnosis of the chandelier cell type (Fig. 9.3b–e). On occasion, the AT8-ir axon with all its vertically-oriented terminal portions is accompanied by AT8-ir material in the soma, and a few traces may even appear in dendritic processes (Fig. 9.3c). It is important to note that, in this type of local circuit neuron, the non-fibrillar tau material does not convert into argyrophilic inclusions. AT8-ir chandelier cells probably perish rather quickly because they are not seen any more after NFT stage IV.
What clues do the chandelier cells reveal with regard to the pathological process? First, it is probably only the chandelier cells that synapse with axons of involved cortical pyramidal cells that become involved. Here, too, it can be speculated that abnormal tau inclusions in chandelier cells may be actively induced via the axon of affected pyramidal cells: Pathogenic tau material may pass through the membranes of the axonal initial segment into the terminal axon of chandelier cells. This would also explain why the AT8-ir material that develops in chandelier cells initially occurs only in the axon and appears only in exceptional instances within the cell soma and dendrites. Second, small amounts of non-fibrillar abnormal tau in certain neurons apparently can result in cell death because abnormal chandelier cells are no longer seen at later disease stages. Moreover, their somatodendritic compartment is incapable of converting abnormal tau into argyrophilic filaments. Such cells may die prematurely because a putative ‘detoxification’ of the non-fibrillar material via a conversion into fibrillar inclusions fails to take place.
Chandelier cells are exceptional because they establish and maintain an especially close contact to the axons of cortical pyramidal cells. Thus, chandelier cells could be helpful in resolving certain questions pertaining to the various effects of aggregated tau proteins on diverse types of nerve cells. It may well be that each and every type of nerve cell reacts differently to the sudden presence of potentially harmful hyperphosphorylated oligomeric tau.
9.3 Are Stages a–III Part of the AD-Associated Pathological Process?
From stage I onwards, all of the involved predilection sites in the CNS consistently display the following neuronal combination: nerve cells that resist the AD process, uninvolved but potentially susceptible neurons, neurons that contain non-argyrophilic AT8-ir pretangle material, argyrophilic NFT-bearing neurons, and their tombstone remnants. Were the AD process to be characterized by longer periods of remission or spontaneous healing, two morphological additional traits should be present, regardless which NFT stage has been reached. First, the pathological process in all involved neurons should consist only of argyrophilic NTs/NFTs and tombstone tangles, and, second, uninvolved (but potentially susceptible) nerve cells should not generate fresh lesions consisting of non-argyrophilic pretangle material. NTs/NFTs in the absence of pretangle material would indicate that the pathological process was active in the brain for an indefinite period of time, but that formation of new tangles had ceased. However, it must be emphasized that this situation does not occur. This fact bears out our interpretation that the pathological process persists from its outset until death and, in so doing, virtually eliminates the possibility of spontaneous remission. Cases with dissimilar NFT stages in double-hemisphere sections are also instructive in this regard. Figure 2.4c, for example, shows one of the hemispheres with lesions corresponding to NFT stage II and the other to NFT stage IV (see also Fig. 2.4b). It would be absurd to assume that only one of the hemispheres (namely, that at stage IV) is involved in the AD process, whereas the stage II lesions represent a non-AD-related variant of aging. Indeed, such cases provide evidence within one and the same individual for the existence of different stages of a single pathological process during its gradual but continual development.
It has long been discussed whether early tau stages without Aβ deposits (‘NFT-only’ or ‘tau-only’ cases) and, more recently, stages a–1b, belong to the process with the potential to cause clinical symptoms of AD (Price et al. 1991; Dickson 1997a; Price and Morris 1999; Jack et al. 2013). The conceptual basis for excluding such cases from the AD process is the assumption that Aβ ‘drives’ tau aggregation, so that the threshold to clinical AD is crossed only in the presence of Aβ deposits (Price and Morris 1999, 2004; Sperling et al. 2011; Jack et al. 2013). As such, it is reasoned that tau aggregates either in the absence of Aβ or as long as they remain below the detection threshold for available biomarkers of MCI/AD, represent either a ‘benign variant’ of normal aging or a non-AD-related tauopathy (Sperling et al. 2011; Jack et al. 2013; Mann and Hardy 2013; Thal et al. 2013; Crary et al. 2014) rather than potential early stages of a neuropathological continuum (Schönheit et al. 2004; Braak and Del Tredici 2011, 2013b, 2014; Braak et al. 2011; Duyckaerts 2011).
In fact, a surprisingly large number of non-cognitively impaired individuals have mild tau lesions in the absence of Aβ plaques and NPs and, remarkably, such cases are found in all age categories (Tables 7.2 and 9.4; see also Sect. 8.6). In order to classify these cases as non-AD-related, evidence is still required proving that the tau pathology in such individuals ceases to develop beyond NFT stages III or IV. However, cases with NTs/NFTs, tombstone tangles, and glial scares persisting in the absence of non-argyrophilic AT8-ir pretangle lesions have not been described to date, nor do they occur in the cohort here. As such, their existence is quite unlikely. Even more unlikely is the assumption that, as soon as Aβ deposition begins in phase 1 in the presence of tau pathology corresponding to NFT stages II–IV, enormous numbers of NTs/NFTS (including even tombstone tangles), could immediately develop based on the existence of a few plaques in the basal temporal and frontal cortex. In addition, during the transition from phase 1 to phase 2 Aβ deposition, one would expect to see a continuation of the initially fulminant development of the tau lesions (i.e., because Aβ deposition is present to a larger extent). But, this too, does not occur.
Here, 1,253 of the 1,885 cases corresponding to stages a-II are devoid of Aβ plaque deposition (=approximately 66 %) and these increase to 1,509 cases (=approximately 80 %) when cases with sparse plaques (phase 1) are included (Table 7.2). The tau aggregates in such cases consist of both 3R and 4R isoforms (Iseki et al. 2002; Jellinger and Attems 2007) and, thus, are morphologically indistinguishable from those evolving in the presence of Aβ deposits or in more advanced stages of the AD process. Moreover, they only occur at known AD predilection sites and they only develop in neuronal types known to be vulnerable to the AD process. In other words, the mere absence of Aβ deposition is not an adequate rationale for excluding tau-only cases from the developmental spectrum of AD-associated preclinical stages (Table 7.2), nor is the presence of such cases at younger age categories consistent with the argument that tau aggregates in tau-only cases are a benign variant of normal aging (Davis et al. 1999; Jack et al. 2013; Korczyn 2013). The existence of a single malignant cell, no matter at what age or what its prevalence in a given population, does not make it less malignant.
Equally unconvincing is the argument that tau-only cases might represent preclinical forms of rare non-AD tauopathies, such as PiD, PSP, or CBD (Mann and Hardy 2013; Thal et al. 2013). Alone the large number of tau-only cases (Table 7.2) and the presence of both 3R and 4R isoforms as opposed to that of the 3R (PiD) or 4R isoform (PSP, CBD) speaks against the assumption that they are possible manifestations of non-AD tauopathies (Uchihara et al. 2005, 2011, 2012; Braak and Del Tredici 2013b). No staging procedures have been proposed or validated for these disorders as possible frames of reference, thereby rendering a definition of putative ‘preclinical’ PiD, PSP, and CBD impossible as long as firmer knowledge of what may define their ‘early’ pathologies is lacking. Assuming, however, that such prodromal stages do exist, we expect that their hallmark lesions will develop in susceptible cell types and at regional predilection sites that are characteristic of PiD, PSP, and CBD: in preclinical PiD, for example, Gallyas-negative tau aggregates in granule cells of the dentate fascia and, in PSP, Gallyas-positive tau inclusions in astrocytes (Dickson et al. 2007). However, in contrast to these disorders, the features of tau-only cases shown in Table 7.2 have strong ties to the AD process. Finally, evidence also exists for a strong link between tau-only cases and the APOE ε4 allele: In a previous study, cases with NFT stage I pathology displayed a significantly higher APOE ε4 allele frequency than controls (Ghebremedhin et al. 1998). There is no cogent reason, therefore, why stages a-III should be excluded from the natural history of the AD-related pathological process (Braak and Del Tredici 2014).
9.4 Basic Organization of Insular, Subgenual, and Anterior Cingulate Regions
The insular, subgenual, and anterior cingulate regions represent the highest organizational level of the cerebral cortex processing interoceptive data and regulating visceromotor as well as endocrine functions. These regions are characterized by conspicuously slender and spindle-shaped von Economo neurons in layer V. They evolve in primates preferably in the hominoid lineage and probably are involved in autonomic regulation (Butti et al. 2013).
The agranular and dysgranular regions of the insula, together with the adjoining association areas, encompass gustatory areas and a topically-organized representation of the internal organs and inner surface of the body. They are reciprocally connected with subgenual, anterogenual, and anterior cingulate areas, the entorhinal region, amygdala, claustrum, thalamic limitans nucleus, and the pigmented parabrachial nucleus. They also generate major projections to the magnocellular nuclei of the basal forebrain and ventral striatum (Fig. 6.10a). In this manner, a pathway is established between the insular fields – via ventral striatum, ventral pallidum, and mediodorsal thalamus – to the prefrontal association cortex. Via the claustrum and magnocellular nuclei of the basal forebrain, the insular fields also exert their influence on the cerebral cortex as a whole. For this reason, the agranular and dysgranular regions of the insula bear the designation ‘viscerosensory and limbic integration cortex’ (Mesulam and Mufson 1993; Nieuwenhuys 2012).
The subgenual, anterogenual, and anterior cingulate regions are part of the medial frontal lobe and represent topically organized visceromotor centers. Bidirectionally organized projections connect the regions with adjoining prefrontal areas, the insular cortex, entorhinal region, hippocampal formation, amygdala, intralaminar and midline nuclei of the thalamus, lateral hypothalamus, periaqueductal nuclei, and autonomic regions of the lower brainstem and spinal cord. These regions again send strong projections to the ventral striatum and, consequently, act upon the prefrontal cortex via ventral pallidum and mediodorsal thalamus. As such, the regions are regarded as fulfilling the functions of a ‘visceromotor and limbic integration cortex’ (Vogt 2009; Vogt et al. 1993; Price et al. 1996).
9.5 NFT Stage IV: Further Progression of the Lesions into Proneocortical and Neocortical Regions Governing High Order Autonomic Functions
During stage IV, the tau pathology extends more widely into the proneocortex and neocortex. From the previously involved basal temporal fields, the disease process encroaches upon insular, subgenual, anterogenual, and anterior cingulate areas (Vogt 2009). The neurofibrillary lesions in the dysgranular insular fields are less severe than those in the agranular portions (Bonthius et al. 2005). Lesions in temporal areas are most dense up to the middle temporal convolution but rapidly decrease at the transition from the sparsely myelinated middle to the highly-myelinated superior temporal gyrus (Fig. 9.13, stage IV). The occipital neocortex is still largely uninvolved or displays localized blotch-like accumulations of AT8-ir pyramidal cells and/or NPs in high order sensory association fields.
The density of AT8-ir feltworks in the entorhinal and transentorhinal regions increases, which leads to a blurring of the lamina dissecans (Fig. 9.1k–m). The severity of the lesions in these regions and also within the hippocampal formation peaks during this stage, but apart from a slight increase of pathology, the major features of the allocortical pathology remain essentially the same from stage IV onwards. Among the most noticeable developments is the increasing involvement of the external layers pre-β and pre-γ as well as of the deep layer pri-γ. At this point, numerous large NPs begin to appear in pre-β and pre-γ, while the superficial layer pre-α is spared.
The density of the deep plexus of AT8-ir cellular processes spanning all of the deep layers pri-α, pri-β, and pri-γ reaches its culmination point. Nerve cells in the white matter (lamina cellularis profunda) also become involved, although they do not attract the viewer’s attention immediately because their density is appreciably lower than that of cells in the deep layers.
In stage IV, the small projection neurons of the parasubicular portion of the presubiculum develop tau aggregates. A few AT8-ir pyramidal cells appear for the first time in the subiculum (Fig. 9.1k–m). The CA 1/CA 2 sectors are filled with NTs/NFTs and are recognizable as dense bands or stripes. The first tombstone tangles also can be seen in the superficial layer of CA 1. The varicose dendritic segments vanish from CA 1 without leaving behind any remnants. Portions of the neuropil that normally contain axons of the perforant path appear very fragile, and tears are frequently visible there in tissue sections. Surviving pyramidal neurons in CA 2 and those in adjacent portions of CA 1 display signs of granulovacuolar degeneration (Thal et al. 2013). Large numbers of mossy cells in CA 3 and CA 4 develop neurofibrillary lesions. A few AT8-ir granule cells appear for the first time in the dentate fascia.
The subcortical lesions in the nuclei with diffuse cortical projections are severe at this stage and, to a great extent, they already consist of argyrophilic NTs/NFTs. The damage within the limbic nuclei of the thalamus (reuniens nucleus, anterodorsal nucleus, limitans nucleus) intensifies and supplements that in the superordinate nuclei responsible for regulating autonomic function (e.g., central nucleus of the amygdala, the parabrachial nuclei) (Parvizi et al. 1998; Blessing 2004). Moreover, one regularly encounters involvement of the large cholinergic interneurons within the putamen as well as the caudate and accumbens nuclei. The presence of tau aggregates makes the dendritic trees of these cells remarkably prominent. The neurons of the pallidum remain univolved and, in the amygdala, pathology begins to accrue in the basolateral complex of the amygdala. The lesions in the central and cortical subnuclei become worse, and only the medial subnuclei of the amgydala are still nearly intact. In the tectum, numerous NPs develop, above all in the inferior colliculus. Isolated AT8-ir melanized neurons are visible in the pars compacta of the substantia nigra (Fig. 9.6h). A moderate number of α-motoneurons in the spinal cord are accompanied by an increasing network of AT8-ir neuronal processes (probably descending axons lower raphe nuclei and the subcoeruleus nucleus) (Fig. 9.6b, c).
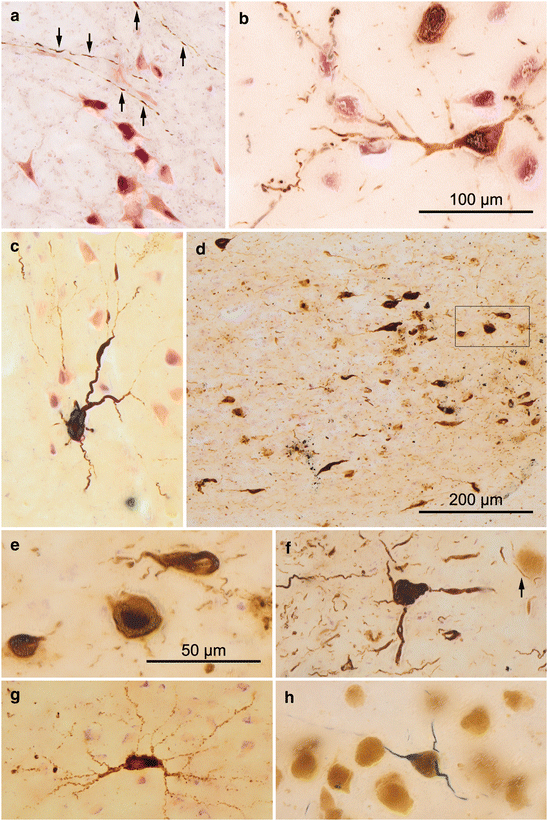
Fig. 9.6
AD-related tau pathology in the spinal cord, olfactory bulb, and substantia nigra. (a) Arrows indicate a faintly AT8-ir neuritic network, probably consisting of axons, in the spinal cord gray matter (segment Th1) of a 74-year-old male (NFT stage II). (b) Two involved AT8-ir α-motoneurons, including an AT8-ir somatodendritic compartment, in segment C3 of a 79-year-old female at NFT stage III. In (c), a severely involved α-motoneuron is seen in the ventral horn (segment L1) of a 77-year-old male (NFT stage II) with concomittant Parkinson’s disease (PD stage 5). (d–f) Extensive tau pathology in the olfactory bulb of a 76-year-old male (NFT stage III), including the anterior olfactory nucleus (d) and large projection neurons (framed area in d can be seen at higher magnification in e). (f) Note the heavily involved mitral cell adjacent to a completely normal one (arrow). The olfactory glomerula and granule cells appear to remain unaffected. (g) Detail micrograph of a AT8-ir cell in the anterior olfactory nucleus of a 59-year-old male at tau stage 1b. (h) Late AD stages consistently show tau pathology in dopaminergic projection neurons of the substantia nigra, pars compacta (74-year-old male, NFT stage IV) 100 μm sections. AT8-immunoreactions combined with pigment-Nissl staining. Scale bar in (d) applies to (a) and (c), and scale bar in (b) applies to (f), (g), and (h). Scale bar in (e) also applies to (f–g)
9.6 Macroscopically Recognizable Characteristics of Advanced AD
The first indices of a possibly atrophic process are visible upon macroscopic examination of the brain (compare control, Fig. 9.7a with AD brain, Fig. 9.7b). The signs are bilaterally symmetrically remarkable and are seen especially in anteromedial regions of the frontal and temporal lobes, particularly in the entorhinal region of the parahippocampal gyrus. The verrucae hippocampi (Fig. 6.4a) are flattened and barely recognizable (Simic et al. 2005). By contrast, atrophic changes cannot be recognized in pre- and postcentral gyri, the transverse gyri of Heschl, and in the vicinity of the calcarine sulcus. Moreover, the ventricular system is widened, particularly the temporal horn (Figs. 2.3c and 9.14). Widening of the ventricular system with thinning of the hippocampal formation can also be visualized using MRI scans (Dickerson et al. 2011). In the event that the clinical records document the existence of a dementing process, such signs can provide an initial indication that an AD-associated pathological process could be present.
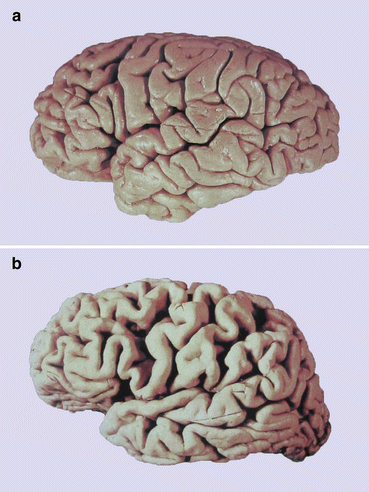
Fig. 9.7
Comparison of a brain of a non-demented individual with that of an AD patient. The AD-brain shows remarkable widening of the sulci and narrowing of the gyri in all lobes. Note the extensive and severe atrophy of the temporal lobe
9.7 NFT Stage V: Fan-Like Progression of the Neocortical Pathology into Frontal, Superolateral, and Occipital Directions and its Encroachment on Prefrontal and High Order Sensory Association Areas
The main feature of stage V is severe involvement of large portions of the neocortex, leaving only the primary sensory and motor fields and their belt regions uninvolved or mildly affected (Fig. 9.14). From neocortical sites already involved at stage IV (regions for high order cortical autonomic regulation), the lesions extend widely into prefrontal fields and high order sensory association areas of the temporal, parietal, and occipital neocortex. The occipital lobe presents a well preserved primary visual area on both banks of the calcarine sulcus (Fig. 9.14 upper right), followed by a mildly involved parastriate field (border field), and a heavily affected peristriate region (high order association fields).
Initially, unevenly and loosely distributed NPs appear in layers II and III of the peristriate areas, followed by large numbers of AT8-ir pyramidal cells in layers IIIa,b and V, for the most part already containing argyrophilic NTs/NFTs. The lower border of the outer neuritic plexus in layer IIIa,b blurs at its transition to the less heavily involved layers IIIc and IV (outer line of Baillarger). In stage V, the deep plexus of layer Vb (inner line of Baillarger) is narrow and does not tend to extend into layer VI and the white matter. The same pattern (only less pronounced) is seen in the parastriate border field, where uneven accumulations of NPs predominate.
9.8 NFT Stage VI: The Pathological Process Progresses Through Premotor and First Order Sensory Association Areas into the Primary Fields of the Neocortex
The pathological process reaches its greatest extent during the end-stage VI (Figs. 2.3c and 9.14). Deviations from a bilaterally symmetrical distribution of the pathology do not occur during stage VI. The intact or only mildly involved premotor and first order sensory association areas of the neocortex clearly show nerve cell destruction, and the pathological process advances from these areas into the primary fields (see Fig. 9.14, lower right: striate area 17, and Fig. 9.9).
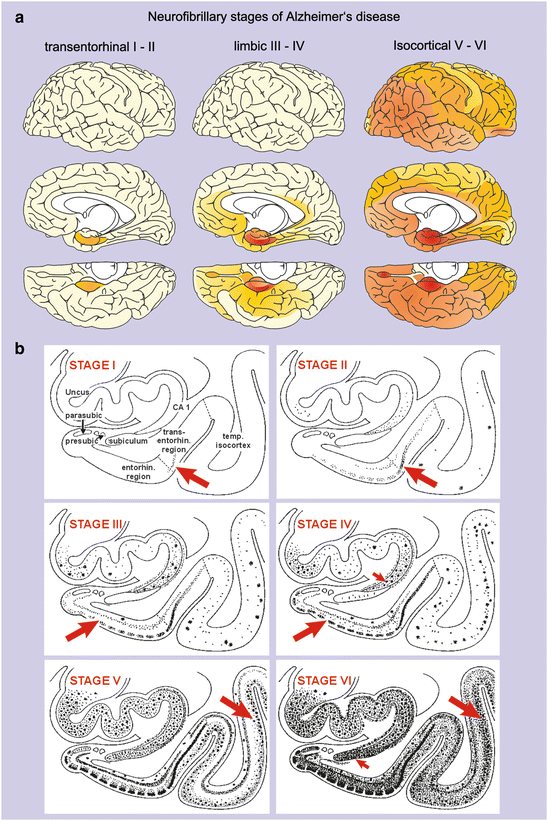
Fig. 9.8
Distribution pattern of AD-related argyrophilic intraneuronal lesions. (a) Six NFT stages can be distinguished. NFT stages I–II show abnormal alterations that are virtually confined to a single layer of the transentorhinal and entorhinal regions. NFT stages III and IV display additional involvement of many cortical regions and subcortical nuclei of the limbic system. Stages V–VI are marked by devastating destruction of the neocortex. (b) Summary diagram showing the development of intraneuronal tau lesions from NFT stage I–VI in the hippocampal formation, entorhinal and transentorhinal regions, as well as in the adjoining temporal neocortex. Arrows point to diagnostically distinguishing marks of the pathology for each stage. Abbreviations: CA 1 first sector of the Ammon’s horn, parasub parasubiculum, presubic presubiculum, transentorhin transentorhinal, entorhin entorhinal, temp temporal neocortex
The neocortex is severely involved: Pyramidal cells in layers III, Va, and VI are the hardest hit cell types. Nearly all cellular layers are filled with AT8-ir neuronal processes. As such, even the outer line of Baillarger – still a pallid stripe in stage V – begins to blur (compare peristriate fields area 19 in stage V at upper right with those in stage VI at lower right, large red arrows). Layer Vb appears as a recognizable band but continues into the neuritic plexus of layer VI. The underlying white substance contains abundant AT8-ir axons. NPs display decreased immunoreactivity and Gallyas-positive argyrophilia in many neocortical areas. This latter feature, which is most pronounced in the basal temporal field, probably indicates their degradation.
In the occipital lobe, the pathology breaches the parastriate region (Brodmann area 18) and the striate area (Brodmann field 17) (Braak et al. 1989a). The line of Gennari in the striate area maintains a light appearance (Figs. 9.14, lower right and 9.9d), interrupted only by radially oriented AT8-ir axons (Fig. 9.9e). A sharply delineated AT8-ir plexus, usually a dense network of NTs, follows in the narrow layer V (Fig. 9.9d, e). This layer displays very severe Aβ deposition (Fig. 9.9a) and NPs (Fig. 9.9d), whereas the line of Gennari harbors only Aβ plaques and dot-like deposits of Aβ (Fig. 9.9b, c) that tend not to converge into Gallyas-positive NPs (compare Aβ in Fig. 9.9a–c with tau in Fig. 9.9d, e). The density of NTs/NFTs increases little by little proceeding from the primary visual field via the parastriate region into occipital high order sensory association areas. The boundary between the parastriate field and the peristriate region, which is not easy to identify in the normal human brain, is light microscopically recognizable in end-stage AD cases (Braak et al. 1989a).
The situation in the allocortex essentially reveals an increase of the pathology seen there previously in stage V (Fig. 9.8). In the entorhinal region, layer pre-α occasionally appears denuded of nerve cells, with tombstone tangles being the only remnants (Fig. 9.4g, h). An additional feature that distinguishes NFT stage VI from stage V is the large number of argyrophilic globose NFTs in granule cells of the dentate fascia.
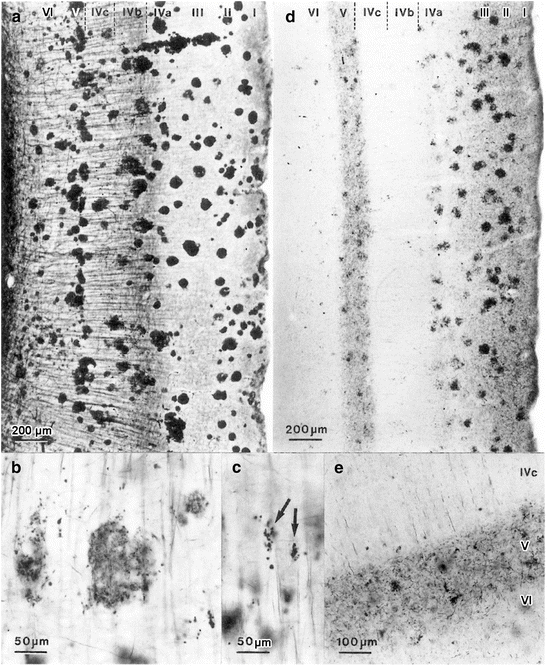
Fig. 9.9
Striate area in silver-stained 100 μm sections. Note that the laminar distribution of Aβ deposits (a–c) differs considerably from that of neurofibrillary lesions (d–e). Layers are indicated at the upper margin in Roman numerals. (b, c) Weakly stained Aβ plaques and intensely marked dots (arrows) in layer IVc that do not convert into NPs. (e) Dense line of NTs characterizes layer V. Note the vertical NTs extending from this line into portions of layer IVc. Campbell-Switzer silver-pyridine method (a–c), Gallyas silver-iodide impregnations (d, e). Reproduced with permission from H Braak and E Braak, Temporal sequence of Alzheimer’s disease-related pathology. Cerebral Cortex 1999;14:475–512
9.9 The Pattern of the Cortical Tau Pathology in AD Mimics the Developmental Sequence of Cortical Lipofuscin Deposits and, in Reverse Order, That of Cortical Myelination
The sequence of AD-lesions follows a pattern of progression (Fig. 9.8a) similar to that seen in the appearance of lipofuscin deposits in cortical projection neurons (Fig. 6.8c), whereas the evolution of cortical myelin (Fig. 6.8a) reiterates this sequence: The progression is the same, but the order is reversed (Fig. 6.8b). The primary neocortical fields myelinate first and, thus, in the human adult they are especially heavily myelinated. Myelin density gradually declines via the belt regions into the high order association areas, i.e., declines with increasing distance from the primary areas (see Sect. 2.2). Just as the heavily myelinated but sparsely pigmented primary neocortical fields are more or less impervious to the AD process, cortical areas rich in pigment and that myelinate last are the most prone to develop the tau lesions (Fig. 6.8b). As such, it is not surprising that the poorly myelinated and heavily pigmented anteromedial and basal temporal areas, including the transentorhinal region, are the sites where the earliest cortical AD-lesions develop (Fig. 6.8b). From there, the pathology slowly progresses and extends into hitherto uninvolved portions of the cortex in the opposite direction of the myelination process (Braak and Braak 1996). This developmental pattern supports the observation that regressive brain changes tend to repeat the maturation process in reverse order (retrogenesis), and, quite remarkably, the pattern in the CNS also is reflected in the antidromic development (i.e., diminution) of individual life skills during the course of the AD-associated dementive process (Table 9.1) (Reisberg et al. 1999, 2002; Arendt et al. 1998; Cramer and Chopp 2000; Moceri et al. 2000; Braak and Del Tredici 2004; Stricker et al. 2009; Gogtay and Thompson 2010; Ewers et al. 2011; Ashford and Bayley 2013; Rubial-Álvarez et al. 2013).
Table 9.1
Normal skill development and AD-related decline
Age range | Normal development and skills acquisition | Decline in AD and loss of skills |
|---|---|---|
24–40 years | Performs complicated tasks | Can no longer perform complicated tasks |
12–24 years | Manages finances | Can no longer manage finances |
6–12 years | Selects clothing properly and dresses independently | Can no longer select clothing properly or dress independently |
3–6 years | Can bath and toilet independently | Can no longer bath and toilet independently |
2–3 years | Achieves fecal and urinary continence | Becomes incontinent for feces and urine |
1–2 years | Can speak a few words and can walk | Speaks only a few words and can no longer walk |
0.5–12 months | Can sit upright | Can no longer sit upright |
9.10 The Prevalence of Tau Stages and Aβ Phases in Various Age Categories and Potential Functional Consequences of the Lesions
Taken together, the following two figures summarize the proposed sequence of the AD pathological process from stage a to stage VI (Figs. 9.10 and 9.11). Table 9.2 contains data pertaining to the frequency of all tau stages separated by gender (Braak and Braak 1997b; Duyckaerts and Hauw 1997; Dickson 1997a; Hyman and Gómez-Isla 1997).
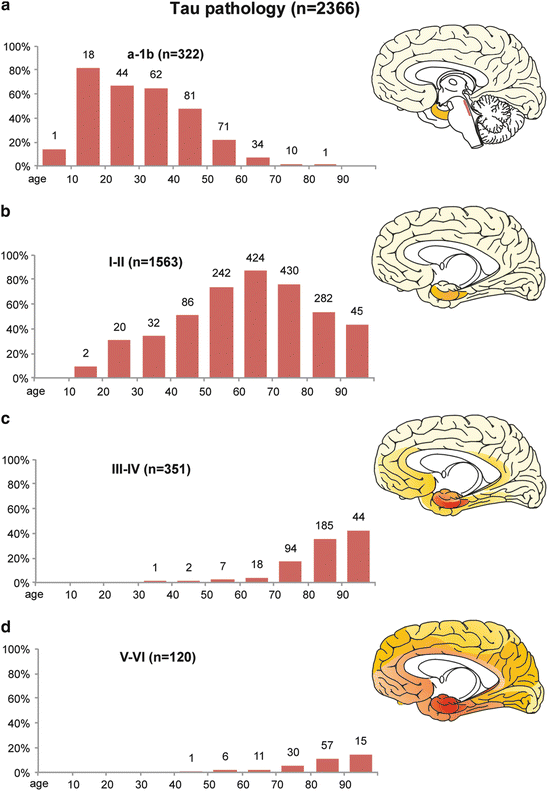
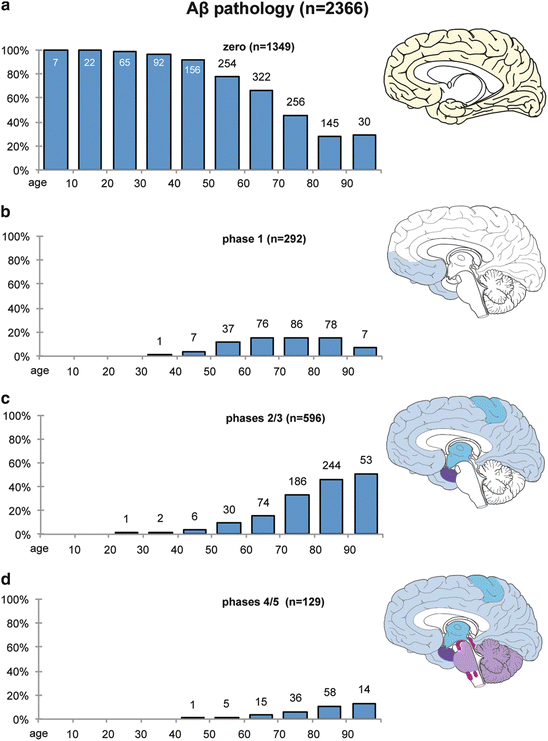
Fig. 9.10
Development of abnormal intraneuronal tau deposits in n = 2,366 non-selected autopsy cases according to decades (ages of the cohort 1–100). (a) The first graph illustrates the prevalence of AD-associated tau in non-argyrophilic lesions during stages a–1b (see also Fig. 7.4). (b–d) The following graphs show the prevalences of argyrophilic neurofibrillary lesions in NFT stages I–II (b), NFT stages III–IV (c), and NFT stages V–VI (d)
Fig. 9.11


Development of abnormal extracellular deposits of Aβ in n = 2,366 autopsy cases according to decades (ages of the cohort 1–100). (a) This graphs illustrates the relative prevalence of cases lacking Aβ deposits in the CNS. (b–d) These graphs show the prevalence of Aβ plaques corresponding to phase 1 deposition (b), phases 2–3 (c), and phases 4–5 (d)
Related posts:

Stay updated, free articles. Join our Telegram channel
Full access? Get Clinical Tree
