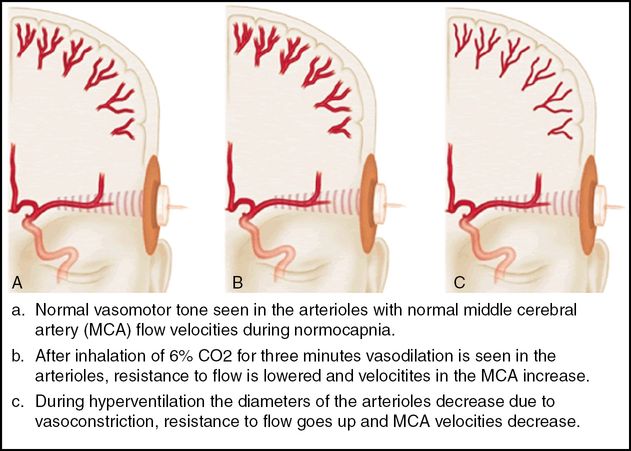
The CBF remains relatively constant during variations of cerebral perfusion pressure.

The measurement of cerebrovascular reserve capacity.
Non-ultrasound techniques for measurement of vasomotor reactivity
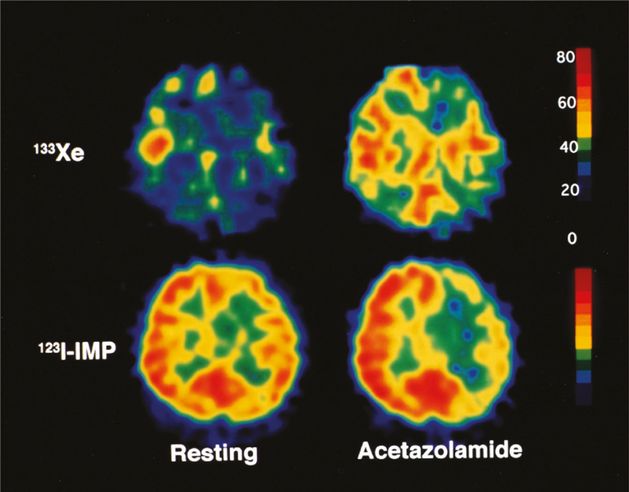
VMR can be assessed by measuring regional CBF using single-photon emission computed tomography (SPECT; Figure 18.3) or positron emission tomography (PET). The advantage of SPECT and PET methods is the fairly good spatial resolution, the limitations are the signal averaging and irradiation. The three-dimensional continuous arterial spin labeling magnetic resonance imaging (MRI) and blood-oxygen level-dependent MRI has good spatial resolution but the signal averaging causes a long measurement time and magnetic resonance field inhomogeneities creates inaccuracies.

A 42-year-old woman with symptomatic left internal carotid artery occlusion exhibiting decreased asymmetry index (AI) percent change and normal ipsilateral cerebral blood flow (CBF) percent change. With acetazolamide challenge, CBF on 133Xe tomograms increased from 38 to 47 mL/100 g/min (CBF percent change = 24%) on the left side and from 45 to 61 mL/100 g/min (CBF percent change = 36%) contralaterally. This asymmetrical increasing rate of CBF was shown on 123I-IMP SPECT images as a decrease in AI percent change (−13.0), although ipsilateral CBF percent change determined on 133Xe tomograms was within normal limits (>18.9%). 133Xe, xenon-133; 123I-IMP, N-isopropyl-p-[123I]-iodoamphetamine.
Ultrasound techniques for measurement of vasomotor reactivity
At least five vasodilatory tests are currently used for VMR assessment: the breath-holding or apnea test, CO2 inhalation, the Diamox® (acetazolamide) test, the leg-cuff method, and the L-arginine test.
The breath-holding or apnea maneuver enables the assessment of VMR by means of calculating the breath-holding index (BHI). This index is calculated using CBF/BFVs obtained by TCD before breath holding (baseline) and at the end of 4 seconds of breathing after 30 seconds of breath holding.
The apnea test can be replaced by inhalation of 5% CO2. During the measurement of CO2 reactivity, hypercapnia is induced by inhaling a mixture of 2–5% CO2 in 95–98% oxygen. Measurement of CBF/BFV can be performed after stabilization of the end-tidal CO2 concentration (as determined by capnograph).
Diamox® (acetazolamide), a potent, reversible inhibitor of carbonic anhydrase, is widely used as a vasodilatory stimulus for evaluating VMR. The enzyme catalyzes the following reaction: CO2+ H2O = H2CO3= H+ + HCO3−. Although the exact mechanisms by which Diamox® acts as a vasodilatory agent and increases the CBF remain controversial, it is most probable that these effects are stimulated by metabolic acidosis and by the direct effect of intravenous administration of 1000 mg acetazolamide on cerebral vessels. A dose of at least 15 mg/kg body weight (corresponding to 1200 mg in a patient weighing 80 kg) is needed for obtaining the maximal vasodilatory effect [1].
Leg-cuff method quantify the dynamic cerebral autoregulation have become an accepted alternative to static evaluation. This technique was introduced after experimental observations that CBF response to sudden changes in arterial blood pressure (ABP) shows a characteristic latency [2].
L-arginine induces the vasodilation of resistance vessels, a process which is mediated by nitric oxide (NO) at the endothelial level. Intravenous infusion of L-arginine at a dose of 500 mg/kg over 30 minutes significantly increases BFV as measured by TCD.
Focused questions
What is the correlation between the changes of CBF and BFV after administration of vasodilatory agents?
Has one of the vasodilatory tests for assessment of VMR a significant advantage or disadvantage over the others?
Is the threshold between good and impaired VMR measured by different vasodilatory tests sufficient to demonstrate the exact state of VMR?
Is the measure of VMR dependent on age?
Physiology
Vasodilatory response can be calculated as:
where BFV(CBF) after refers to BFV(CBF) after the administration of a vasodilatory agent and BFV(CBF) before refers to BFV(CBF) before the administration of a vasodilatory agent. Although BFV does not reflect CBF quantitatively, a direct proportion between these two values has been established, assuming that the diameter of the artery remains unchanged [3]. This is due to the fact that volume flow (Q) in a vessel is related to BFV (V) according to the equation Q= V∙πR², where R is the vessel radius. Thus, BFV measurements can theoretically provide information regarding changes in volume flow in a supply artery and its perfusion territory if both the diameter of the artery and the size of the perfusion territory remain constant after a vasodilatory stimulus [4].
Imaging tips
The CBF is regulated by a complex system influenced by multiple factors: ABP, heart rate, cerebral perfusion pressure, brain metabolic activity, autonomic innervation, respiration, vasodilatators (CO2, NO) and drugs. It is very important to make an effort to stabilize these factors during the BFV measurements. The comparability and reproducibility of the BFV measurements are also determined and limited by equipment-related, anatomic and physical parameters. Equipment-related parameters are the axial and lateral resolution of the sample volume, focusing, gain and maximum theoretical penetration depth. Anatomic parameters include the thickness, location, size, penetrability of the temporal “bone-window” and the course, length, caliber and presence of intracranial arteries. An important physical limitation is the angular dependence of the Doppler flow data (the measured velocity is not the same as the true velocity in the cerebral vessels) [5].
Steps of investigation
The examination was performed by the examiner with the patient in supine position after 5 minutes of bedrest. The probe was placed over each transtemporal window. This position was adjusted until a maximal a. cerebri media signal was obtained: this is usually at a depth of 50–55 mm. The probe was held in position with a head strap or special probe-holder.
Breath holding and apnea test: the subject breathed air through a close-fitting mask. Ports in both the inspiratory and expiratory circuits allowed air to be drawn off into a CO2 analyzer. The CO2 concentrations were recorded on a data recorder. The subject first breathed room air through the apparatus until a steady expiratory end-tidal CO2 concentration was obtained. The mean middle cerebral artery velocity over 60 seconds was recorded as the resting BFV. The subject then hyperventilated for 2 minutes, and the BFV and end-tidal CO2 were recorded. The subject then breathed room air normally for 4 minutes (changes in middle cerebral velocity due to hyperventilation may persist for up to 3 minutes after hyperventilation). The subject was then instructed to hold their breath after a normal inspiratory breath; the rise in BFV was calculated, using the mean BFV immediately after the end of the period of breath holding, and the time of breath holding were recorded. This was repeated after a rest period of 2 minutes, and the mean of the two values was taken [6]. For further analysis, the breath-holding index (BHI) was calculated as percentage increase in BFV occurring during breath holding divided by the time (seconds) for which the subject held his/her breath (BHI= Vmax − Vmin/breath-holding time × 100). The normal values are sex and age dependent (Table 18.1) [7].
CO2 inhalation test: after an additional 2 minutes’ rest, CO2 was added to the inspired gas until the inspired CO2 concentration was 5%. The subject breathed this mixture for 2 minutes, after which BFV and end-tidal CO2 were recorded. Inspired CO2 was then progressively increased in increments of approximately 1%; at each level the subject breathed the gas mixture for 2 minutes before BFV and end-tidal CO2 were recorded. This was continued until further increases in inspired CO2 resulted in no further increase in BFV. Higher CO2 concentrations may cause considerable discomfort.
| Age group (years) | Pooled value | Male | Female |
|---|---|---|---|
| 20–29 | 1.46 ± 0.35 | 1.46 ± 0.34 | 1.45 ± 0.29 |
| 30–39 | 1.41 ± 0.25 | 1.44 ± 0.29 | 1.43 ± 0.25 |
| 40–49 | 1.32 ± 0.29 | 1.32 ± 0.31 | 1.32 ± 0.29 |
| 50–59 | 1.31 ± 0.32 | 1.31 ± 0.30 | 1.31 ± 0.32 |
| 60–69 | 1.29 ± 0.31 | 1.28 ± 0.22 | 1.27 ± 0.21 |
| >70 | 1.13 ± 0.33 | 1.15 ± 0.35 | 1.13 ± 0.32 |
The following measures of cerebrovascular reactivity are usually calculated:
Full range of vasodilation (the percentage change in the BFV from hyperventilation to hypercapnia), calculated from 100 × (BFV hypercapnia − BFV hyperventilation)/BFV rest. Vasomotor reactivity slope: change in BFV per incremental increase of end-tidal CO2.
Acetazolamide (AZ) test: intravenous administration of 1000 mg AZ achieves a supramaximal dilatative effect on resistance arteries. The effect starts after 2 minutes, the maximum appear after 10–12 minutes and the length of the effect last approximately for 20 minutes. Mean velocity values are derived from velocity samples using the mean of at least 10–15 heart cycles. The normal subjects show an increase of 0.244 ± 0.092 m/s [5]. The normal values are sex dependent (Table 18.2). This test can also be performed in noncooperating persons. Contraindicated in patients suffering from obstructive respiratory diseases, allergy or elevated intracranial pressure, severe renal or hepatic disease. The possible side effects of AZ test are transient and well tolerated, but gasping and fear of death also occur [8,9,10].
Leg-cuff method: large pneumatic cuffs placed around both thighs are inflated above systolic pressure for ≥2 minutes and then suddenly released; a sharp drop in arterial blood pressure (ABP) is usually observed, lasting approximately 10 seconds before returning to its original level. Recordings were made with subjects in the supine position with the head elevated to 30°. A simultaneous drop in BFV, usually estimated with Doppler ultrasound accompanies the fall in ABP. With normal autoregulation, the recovery of BFV to its resting level will tend to precede that of ABP. This typical response can be quantified with a mathematical model [2].
At rest | After acetazolamide | |||
|---|---|---|---|---|
| Vmean, cm/s | PI | Vmean, cm/s | PI | |
| Women | 60.2 ± 12.5 | 0.94 ± 0.15 | 89.9 ± 14.4 | 0.79 ± 0.15 |
| Men | 54.5 ± 18.8 | 0.93 ± 0.26 | 75.7 ± 24.5 | 0.79 ± 0.23 |
| P 1 | NS | NS | <0.02 | NS |
A good correlation between CBF alterations after vasodilatory tests measured by SPECT, PET and changes in BFV after the same stimulus using the TCD technique was found and this opened a new era of cerebral hemodynamic investigations without requiring invasive and expensive procedures, such as SPECT or PET [11,12]. The disadvantages of TCD-based methods are that they lack the regional specificity of other methods of CBF measurement, and are not possible in individuals who have no acoustic window. Comparative investigations have also shown a good correlation when comparing CO2 inhalation and acetazolamide test results, indicating a strong similarity between the vasodilatative effects of CO2 and acetazolamide on cerebral arteries [13].
The advantages and disadvantages of the two tests are as follows: CO2 is a more physiologic stimulus and allows CBF measurements using different concentrations. On the other hand, CO2 inhalation methods require patient cooperation during the investigation (“respiratory work”).
CO2 inhalation is not performed in patients suffering from obstructive respiratory diseases. CO2 inhalation may cause gasping and fear of death. As for acetazolamide, intravenous administration of 1000 mg achieves a supramaximal dilative effect on resistance arteries, and permits investigation of the time course of the vasodilatory response. Moreover, a 20-minute vasodilatory effect of acetazolamide is ideal for hemodynamic studies, and no patient cooperation is required during the investigation. Some contraindications of acetazolamide administration are sulfonamide allergy, raised intracranial pressure and severe hepatic or renal failure. The side effects of acetazolamide are mild (paresthesias of the extremities and of the face – especially around the mouth and tongue – light headedness and a short-lasting, mild diuretic effect), transient and well tolerated by the majority of patients [14].
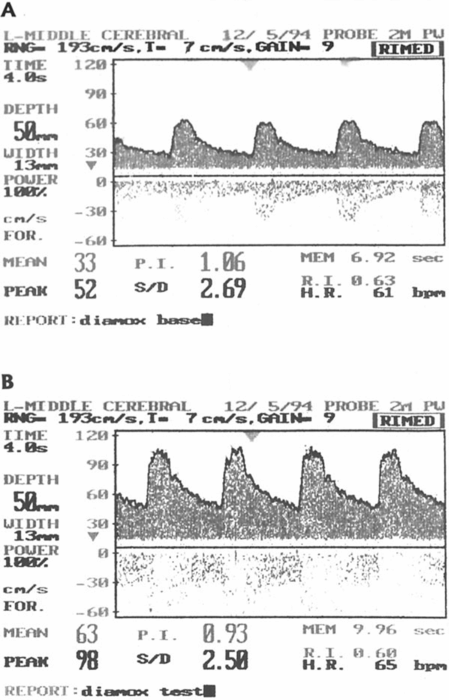
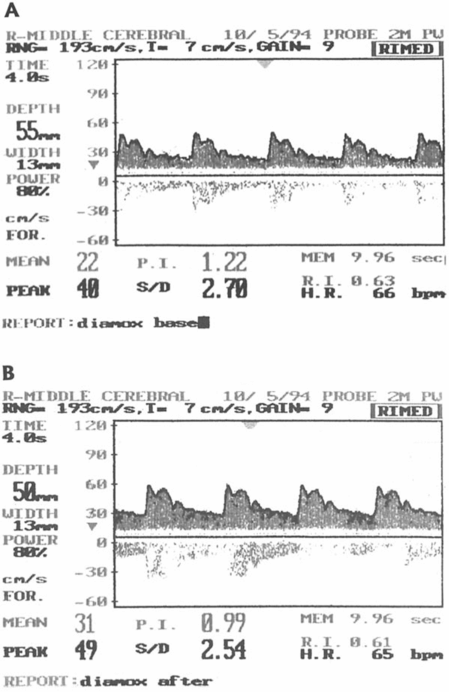
VMR can be rated as being either good or impaired (Figure 18.4) [1,3]. An approximately 40% increase in BFV in the cerebral arteries and 20–30% increase in CBF after the administration of acetazolamide is indicative of good VMR, based on studies in healthy subjects [15]. An average of a 50% increase in BFV in normal volunteers after CO2 inhalation was found, but nevertheless, a predetermined cut-off value of 20% for 8% CO2 VMR and a cut-off of 0.69 for BHI has been suggested for distinguishing between an impaired and a normal VMR [16,17,18]. Although, these thresholds have not been validated and only approximately demonstrate the exact state of VMR, this demarcation appears adequate to describe the extent of impairment. Comparative investigations in healthy volunteers proved that VMR is an age-dependent parameter. When assessing VMR between 20 and 70 years, the extent of acetazolamide-induced VMR was the greatest in the 31–40-year age group and the smallest in the 61–70-year age group [19].


Left image: the blood flow velocity in the middle cerebral artery before (A) and after (B) the Diamox® test showing good cerebral vasomotor reactivity. Right image: the blood flow velocity in the middle cerebral artery before (A) and after (B) the Diamox® test showing impaired cerebral vasomotor reactivity.
Vasomotor reactivity applications
VMR and carotid occlusive disease
There are several applications of VMR assessment in neurosonology, but the majority of the VMR studies were performed in patients with carotid occlusive disease. Carotid bifurcation is an important site of the developing atherosclerotic lesion, and the landmark clinical trials have conclusively demonstrated the etiologic importance of carotid atherosclerosis in ischemic stroke. Ischemic stroke is assumed to be caused by several mechanisms, either embolic or hemodynamic. This is especially applicable in patients with severe carotid stenosis, for whom both mechanisms should be considered as being potential etiologies for focal cerebral ischemia. Although the majority of cerebral ischemic events are thromboembolic, hemodynamic factors may play a significant role, and recognition of a hemodynamic high-risk subgroup has important implications for evaluation and management. Impairment of brain hemisphere perfusion begins with an approximately 60% diameter stenosis of the carotid artery [20]. Thus, in certain situations (e.g., carotid occlusive disease), the presence and the state of intracranial collateral blood supply and cerebral autoregulation are clearly very important, and intracranial hemodynamic features might have prognostic value for the symptomatic or asymptomatic course of carotid occlusive disease and stroke recurrence. Significantly reduced VMR of the middle cerebral arteries (MCAs) has been demonstrated in patients with high-grade stenosis or occlusion of the internal carotid artery (ICA) and suggested that dilatation of the cerebral resistance vessels occurs in attempt to maintain stable levels of CBF in these two conditions [21]. This can ultimately lead to the abolition or reduction in the extent to which the cerebral resistance vessels can further dilate in response to additional reduction in flow, whereby VMR is reduced. In spite of unilateral or even bilateral ICA stenosis or occlusion, however, some patients maintain a well-preserved VMR, and this may indicate a sufficient collateral capacity of the circle of Willis and satisfactory cerebral autoregulation. Thus, the intracerebral hemodynamic status of patients with carotid stenosis plays a significant role in stroke incidence and outcome. To date, significantly higher stroke risk in patients with an impaired VMR in asymptomatic carotid occlusive disease has been confirmed in two subsequent large, prospective, blinded, longitudinal studies using BHI values and 8% CO2 inhalation [17,18]. Meta-analysis of nine studies on 754 patients showed that impaired CO2 measured VMR was independently associated with an increased risk of ipsilateral ischemic stroke and risk prediction was similar for recently symptomatic or asymptomatic patients [22]. This analysis supports the usefulness of VMR assessment in risk prediction for patients with severe carotid artery stenosis or occlusion, both in recently symptomatic and asymptomatic patients. Acetazolamide tests assessing VMR provided similar results [23]. Moreover, impaired VMR remained an independent predictor of ipsilateral stroke or transient ischemic attack after adjustment for age, gender, hypertension, diabetes, smoking, ipsilateral infarct and degree of contralateral stenosis. Attention has been mainly focused upon evaluating the hemodynamic effect of ICA stenosis on the MCA. Evaluation of the intracranial hemodynamic status, in order to identify stroke high-risk patients, cannot be complete without assessment and comparison of VMR in the different parts of the circle of Willis. VMR assessed in the vertebral arteries (VAs) showed that VMR of the posterior circulation remains similar on the side of severe carotid stenosis as well as on the side of a normal artery or hemodynamically nonsignificant carotid stenosis [24]. Moreover, a similar VMR of posterior circulation was found in patients with either a symptomatic or asymptomatic course of carotid stenosis. Other data indicate that the VMR of an ophthalmic artery (OA) differs from the VMR of an MCA on the normal side or on the side of a nonsignificantly stenotic ICA [25]. These differences were clearly evidenced by the greater increase of the BFVMCA after acetazolamide administration compared with the change in the BFVOA. A specific autoregulative response of the OA compared with autoregulation in the MCA seems to be one of the most likely reasons.
Stay updated, free articles. Join our Telegram channel

Full access? Get Clinical Tree


