Vision, Hearing, and Balance Testing
J. Kirk Roberts
INTRODUCTION
As with all neurologic complaints, diagnosis begins with a proper history and physical examination.
Appropriate testing supplements the examination and provides more refined measures of neurologic function and impairment. The neurologist may order or request testing that is performed by another physician or a technician in another specialty, or the neurologist may supervise, interpret, or perform the test. In either circumstance, the neurologist should understand the test and its appropriate use. This section will review some commonly performed vision, hearing, and balance tests.
VISION TESTING
VISUAL ACUITY
Visual acuity measures central or foveal vision. Testing usually involves reading letters of different sizes but may involve identifying other symbols. The Snellen chart, which uses letters, and the E chart, which uses the letter E in various orientations, are commonly used tests (Fig. 28.1). Testing is typically done at a distance, to approximate infinity, often 20 ft, and the smallest row read accurately is the visual acuity. If distance vision cannot be performed, then near vision may be tested at a distance of 15.7 inches. For those with such poor vision that the largest letter on the eye chart cannot be read, acuity can be recorded, in order of worsening vision by counting fingers, hand motion, and finally light perception or no light perception. So-called normal vision using the foot as the unit of measurement is defined as 20/20 and means the person can see detail at 20 ft that a person with normal eyesight would see at 20 ft Thus, a person with 20/40 vision can see at 20 ft what a person with normal vision would see at 40 ft In the metric system, normal visual acuity is reported as 6/6 (meters), and in the decimal system, normal eyesight is reported as 1.00. However, many have vision that is better than 20/20. Moreover, distance vision and near vision acuity may differ because of hyperopia, myopia, or presbyopia. Specialized testing has been developed to evaluate visual acuity in infants, preverbal children, and others who cannot identify the letters or symbols.
COLOR VISION
Color vision testing is most commonly evaluated with Ishihara plates. This test consists of a series of plates with colored dots with a pattern of different colored dots forming a number or a shape. This test was originally designed to test for congenital disease, which is most commonly red-green color deficiency. There are other tests of color vision that include blue-yellow testing. Congenital color vision deficiency is not rare and is more common in men than women. Acquired color vision deficiencies typically, although not strictly, divide into loss of red-green vision in optic nerve disorders and blue-yellow vision in retinal or macular disorders.
VISUAL-EVOKED POTENTIALS
Visual-evoked potentials (VEPs), also known as visual-evoked responses (VERs), are recorded by measuring brain electrical activity over the occipital lobe in response to repetitive visual stimulation (see Chapter 25). Typically, the P100 wave is the most useful response, and its latency and amplitude are measured. Responses, including latency and amplitude, are measured for each eye, with latency prolongation having the most clinical significance. Ocular, retinal, and visual pathway dysfunction may affect the VEP responses. For the neurologist, the VEP is most commonly used in the evaluation of optic neuritis, where there is a prolonged latency from one eye and/or an elevated interocular latency, as long as ocular and retinal pathology has been excluded.
ELECTRORETINOGRAM
The flash electroretinogram (fERG) tests retinal function and is not affected by damage more central, such as in the optic nerve.
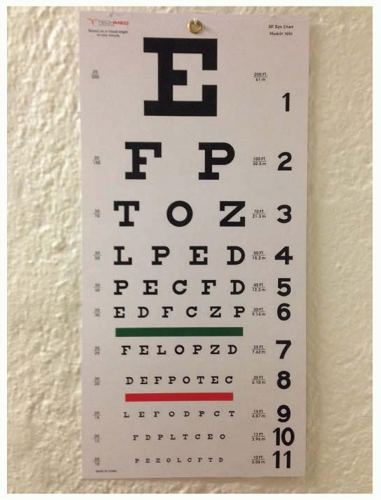 FIGURE 28.1 Snellen chart. |
VISUAL FIELDS
Visual field testing is commonly performed in the neurologist office using finger motion and finger counting (see Chapter 3). More formal testing such as Goldman kinetic perimetry uses a test light of various sizes and intensities which is moved from the periphery to the center of the of vision and thus establishes a boundary of visual detection for each level of stimulus. Most visual field testing is now automated (e.g., Humphrey) with lights of varying intensities and sizes appearing in different areas of the visual field while the patient’s eye is focused on a specific spot (Fig. 28.2). Although the ophthalmologist uses visual fields to monitor a variety of eye conditions, the neurologist is generally monitoring them in patients with occipital lesions or pituitary lesions with pressure on the optic nerve or chiasm.
Related posts:

Stay updated, free articles. Join our Telegram channel

Full access? Get Clinical Tree


