Visual Evoked Potentials and Electroretinograms
Gastone G. Celesia
Neal S. Peachey
The visual system can be studied noninvasively by recording field potentials from the surface of the cornea or the scalp overlying the visual cortex. Retinal potentials recorded at the cornea constitute the electroretinogram (ERG) and reflect the initial processes of phototransduction and retinal transmission. Cortical potentials constitute the visual evoked potential (VEP) and reflect the output features of the entire visual pathway.
ERGs were first recorded directly from the eye by Holmgren in 1865 (1). However, the routine use of ERGs in clinical practice did not occur until the development of reliable differential amplifiers and safe contact lenses in the 1950s (2). ERGs evoked by bright flashes are large potentials with amplitude of hundred microvolts (µV) and are generated by the photoreceptors and by the retinal glial cells (2,3). Utilization of chromatic stimuli and scotopic and photopic conditions permits the study of the physiology and pathophysiology of the photoreceptors and the separation of rod and cone contributions to the flash ERG (2,4, 5, 6 and 7).
VEPs were first recorded in animals directly from the striate cortex; they could not be recorded from the scalp due to their small amplitude. VEP recording became feasible with the introduction of summation and computer averaging techniques (8,9). The functional integrity of the visual pathways can be evaluated by VEPs (10, 11 and 12). Furthermore, manipulation of visual stimuli permits the preferential evaluation of the various segments of the visual pathways (13).
The clinician applying these technologies to the study of the visual system must be aware that, as Floyd Ratliff (14) stated, “There is no ‘best method’ of stimulus control or of data analysis in the study of visual evoked potentials.” Recordings and stimulation must be tailored to the clinical problem to be studied. Evaluation of peripheral retinal function, for example, can be achieved best by flash electroretinography, whereas optic nerve function may be assessed by pattern-reversal VEPs. Evaluation of retinal function, anterior visual pathways, and retrochiasmal pathway function are discussed separately.
RETINAL FUNCTION
Response Characteristics of the Retina
The eye is both an optical and a neuronal device. The light entering the eye must pass through transparent media (the cornea, the aqueous humor, the lens, and the vitreous humor) to reach the retina. A prerequisite for normal retinal function is an intact optic system. Thus, for example, a cataract may prevent a pattern stimulus from reaching the retina and being transformed into electrical signals to be transmitted to the visual cortex and perceived by the subject. In the study of visual function, one must always be aware of the optical status of the eye.
The retina is a neuronal membrane lining the back of the eye chamber (15,16). The amount of light entering the lens and reaching the photoreceptors is determined by the diameter of the pupil, which is controlled by the iris, a diaphragm that can be contracted or dilated by the ciliary muscles (17).
The retina is organized into three cellular layers (Fig. 46.1): the outer nuclear layer (ONL), the inner nuclear layer (INL), and the ganglion cell layer (GCL). Neuronal connections are made primarily in two synaptic layers: the outer plexiform layer (OPL) and the inner plexiform layer (IPL). The ONL contains the cell bodies of the rod and cone photoreceptors. The OPL contains the synapses among photoreceptors, horizontal cells, and bipolar cells. The INL contains the cell bodies of horizontal, bipolar, and amacrine neurons and the cell bodies of the radial class of retinal glial cell, the Müller cell. The IPL contains the synaptic interconnections among bipolar, amacrine, and ganglion cells. The GCL contains the cell bodies of the ganglion cells as well as of displaced amacrine cells. Detailed reviews of retinal anatomy have been published (16,18,19,44). The outer surface of the retina is delimited by the retinal pigment epithelium (RPE). The RPE is critically involved in many activities required for normal retinal function including the flow of nutrients and waste products between the photoreceptors and the choroidal circulation, the visual cycle by which light sensitivity is maintained, and the phagocytosis of shed outer segment disks (reviewed in Ref. 20).
In the vertebrate retina, there are two classes of photoreceptors: cones and rods. The human retina is rod-dominated, containing only about 5% cones (21). Photoreceptors have three main functional sections. The outer segment contains the lightsensitive photopigments along with the phototransduction machinery, which are organized into a series of bilipid membrane disks. The inner segment houses the nucleus and cellular organelles. The photoreceptor terminal contains synapses where glutamate is used to communicate with second-order neurons. All rods contain the same type of visual pigment, rhodopsin. The three types of cones (red, green, or blue) are differentiated by the photopigment contained in the outer segment, which are differentially sensitive to light of different wavelength (22).
Visual pigments are activated by the absorption of light and initiate the phototransduction cascade. This cascade culminates in the closure of ion channels along the outer segment membrane, membrane hyperpolarization, and a consequent
reduction in the rate of neurotransmitter release at the synaptic terminal (23). In the human eye, the amplification gained from the phototransduction cascade is such that a visual sensation can result from one quantal absorption occurring in only three rod photoreceptors (24).
reduction in the rate of neurotransmitter release at the synaptic terminal (23). In the human eye, the amplification gained from the phototransduction cascade is such that a visual sensation can result from one quantal absorption occurring in only three rod photoreceptors (24).
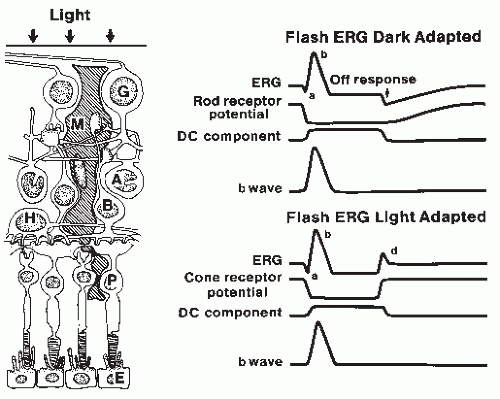 Figure 46.1 Origin of flash electroretinogram (ERG) waves. Left: Diagram of the cellular components of the retina. G, ganglion cells; M, glial Müller cells; A, amacrine cells; B, bipolar cells; H, horizontal cells; P, photoreceptors; E, pigmented epithelium. Right: Schematic component analysis of the predominantly rod (upper) and cone (lower) ERG, as modified from Ref. 19. The ERG represents the algebraic summation of the photoreceptor potential, the b wave, and the direct current (DC) component. Note that the c wave from the pigmented epithelium has been omitted. |
The response of the photoreceptors is transmitted centrally in a different fashion for rods and cones. Information from rods is carried by one primary pathway, which is from rods to rod depolarizing bipolar cells (DBCs), to rod amacrine cells, and then to on- and off-center ganglion cells via an excitatory synapse to cone DBCs and an inhibitory signal to cone hyperpolarizing bipolar cells (HBCs; 25, 26 and 27). Other pathways have been identified (28, 29, 30 and 31). In comparison, cone activity is carried to DBCs and HBCs and then, to the on- and off-center ganglion cells. Lateral inhibitory connections, mediated by horizontal and amacrine cells, form the basis for the development of antagonistic receptive fields, which are instrumental in the coding of spatial patterns and contrast (32). Chromatic information is derived from circuits comparing the responses of the different types of cone photoreceptors. The net result is that the output of the photoreceptors is extensively processed by the time that corresponding signals are transmitted from the ganglion cells via the optic nerve to the lateral geniculate and the visual cortex.
Different regions of the retina are specialized for different functions. These are mirrored by changes in the organization of the retinal architecture. For example, the best acuity is achieved by the central fovea, the foveola (Fig. 46.2). This region contains only cones in a highly ordered packing. Moreover, each foveal cone makes contact with only a single bipolar and ganglion cell of each class (37,38). As a result, the response of each foveal cone is transmitted with high fidelity through the retina. Across the retina, Frisen and Frisen (39) have shown that the decrease in visual acuity that occurs at more peripheral locations is highly correlated with the decrease in ganglion cell density. In comparison, the retinal region with the best sensitivity to light is located some 20 to 30 degrees away. This sensitivity increase reflects the increased concentration of rods in the periphery (Fig. 46.2) and the increased degree of synaptic convergence that is achieved at more peripheral locations.
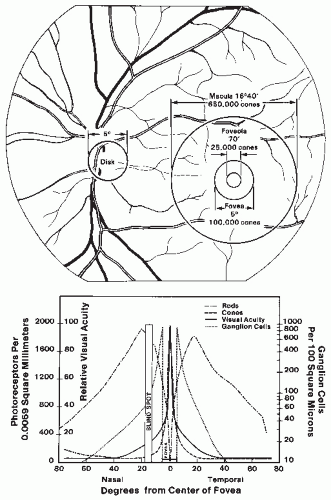 Figure 46.2 Top: Ocular fundus. The size of the disk, macula, fovea, and foveola are expressed in degrees of visual angle. Bottom: Diagram of the distribution of photoreceptors (rods and cones) and ganglion cells and their relationship to visual acuity. The data on visual acuity are obtained from Jones and Higgins (Ref. 33). The distribution of rods and cones is from Osterberg (Ref. 34). The distribution of ganglion cells is from Van Buren (Ref. 35) and Oppel (Ref. 36). Note the logarithmic scale for the ganglion cell distribution. |
Ganglion cells transmit information to the lateral geniculate body via action potentials. Each ganglion cell responds to light stimulation only in a certain retinal area called the receptive field. If stimulation of the center of the receptive field induces
on-discharges, stimulation of the periphery produces off-discharges (40). This center-surround opponent arrangement represents the initial coding step of the central visual system. There are three major classes of cells: the midget cells representing 80% of the ganglion cells and constituting the P or parvocellular pathway, the parasol cells representing 5% to 8% of the ganglion cells and constituting the M or magnocellular pathway, and the bistratified ganglion cells representing 5% of cells and constituting the K or koniocellular pathways (41). The P cells have a small receptive field, are slow conducting, have a color opponency mechanism (i.e., red center, green surround spectral opponency), and have a fine spectral discrimination. The M cells have high conduction velocity and a center-surround opponent mechanism and provide analysis of movement. The K cells have no center-surround mechanisms. The function of the K pathway is less clear. Morand et al. (42) studied the K pathway in humans with electrophysiologic techniques and suggested that the K system process moving stimuli via very fast activation of cortical areas. From this study, it appears that processing of moving stimuli is mediated by both K and M pathways. The K pathway processes blue-on information from the S-cone retinal input (43); thus, it is also involved in color processing.
on-discharges, stimulation of the periphery produces off-discharges (40). This center-surround opponent arrangement represents the initial coding step of the central visual system. There are three major classes of cells: the midget cells representing 80% of the ganglion cells and constituting the P or parvocellular pathway, the parasol cells representing 5% to 8% of the ganglion cells and constituting the M or magnocellular pathway, and the bistratified ganglion cells representing 5% of cells and constituting the K or koniocellular pathways (41). The P cells have a small receptive field, are slow conducting, have a color opponency mechanism (i.e., red center, green surround spectral opponency), and have a fine spectral discrimination. The M cells have high conduction velocity and a center-surround opponent mechanism and provide analysis of movement. The K cells have no center-surround mechanisms. The function of the K pathway is less clear. Morand et al. (42) studied the K pathway in humans with electrophysiologic techniques and suggested that the K system process moving stimuli via very fast activation of cortical areas. From this study, it appears that processing of moving stimuli is mediated by both K and M pathways. The K pathway processes blue-on information from the S-cone retinal input (43); thus, it is also involved in color processing.
This complex retinal physiology can be partially studied by electroretinography. Manipulation of visual stimuli permits evaluation of the functional integrity of photoreceptors and retina neuronal circuitry. Two types of ERGs have been used extensively in clinical practice: flash ERGs and pattern ERGs. They are reviewed below. This chapter focuses on the clinical application of ERGs. The reader is referred to the literature for a more extensive review of the electrophysiology of the retina (19,44).
Flash Electroretinography
In response to the short duration (<1 msec) stimuli typically used in clinical settings, the ERG is composed of two major components, the “a wave” and the “b wave,” as well as a series of higher frequency oscillatory potentials (2,7). The source of these underlying components has been investigated by intracellular and intraretinal recordings (19,45,46) as well as by using pharmacologic agents that selectively interfere with different aspects of retinal function (47, 48, 49 and 50).
The cornea-negative a wave reflects in large measure the massed response of the rod or cone photoreceptors (51, 52 and 53), although postreceptoral contributions are clearly present (48,54). In comparison, the cells that contribute to the cornea-positive b wave change depending on whether stimulus conditions elicit rod- or cone-mediated potentials. Under dark-adapted conditions, which isolate rod-mediated responses, the b wave reflects the activity of the rod DBCs (55, 56 and 57). Under stimulus conditions that isolate cone-mediated activity, the b wave reflects the combined activity of both DBCs and HBCs (49,58).
A standard ERG testing protocol has been developed for clinical purposes (59). The standard incorporates a series of stimulus conditions designed to isolate rod-mediated responses by presenting stimuli to the dark-adapted eye and cone-mediated responses by rapid flicker and light adaptation. In addition, the standard addresses other important issues such as electrodes, amplifier settings, stimulus calibration, and the establishment of normative data.
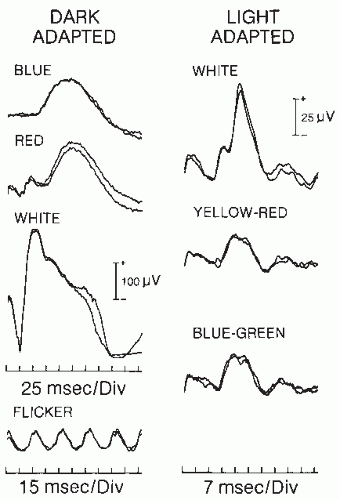 Figure 46.3 Flash ERG in a normal 32-year-old man. Each response represents the average of five ERGs; two averages are superimposed to demonstrate reproducibility. Left: ERG to dim suprathreshold and scotopically matched blue and red flashes, to white flashes and to 32-Hz flicker in the absence of background light. Right: ERG to white and photopically matched yellow-red and blue-green flashes in the presence of background light. Note the different amplitude and time calibration for the two columns. |
In the clinic, the flash ERG is used primarily to evaluate outer retinal function (Fig. 46.3). Flash ERG is particularly useful in the diagnosis of retinal pigmentary degeneration (Fig. 46.4). The ERG is depressed or absent in retinitis pigmentosa (RP) (60, 61, 62 and 63). RP is a retinal dystrophy affecting predominantly the rods; cones are affected only at advanced stages. RP patients, in the early stages, have involvement limited to the dark-adapted rod ERG response, accompanied by impaired night vision (nyctalopia). As the disease progresses, they show evidence of impaired cone vision, including reduced amplitude of light-adapted ERG responses. A reduced dark-adapted b wave amplitude with normal b wave latency (often referred to as implicit time) in RP patients indicates a focal disease that leaves segments of the retina normal and able to respond to light with normal latency (64). A general rule of flash ERG states that preserved latency in the presence of decreased amplitude indicates a focal or patchy retinal disorder, whereas prolonged latency indicates diffuse retinal disease. In the latter case, most of the retinal cells respond abnormally to the stimulus. Early reduction in amplitude and
prolongation of latency of dark-adapted rod responses have been found, even before classic funduscopic changes appear, in subjects whose families have dominantly inherited RP. Reduced amplitude and prolonged latencies in the dark-adapted rod responses were also found in female carriers of X-linked RP (63,65). Therefore, ERG can be used in genetic counseling to detect carriers and early-affected subjects (Fig. 46.4) in families with a history of retinal pigmentary degeneration.
prolongation of latency of dark-adapted rod responses have been found, even before classic funduscopic changes appear, in subjects whose families have dominantly inherited RP. Reduced amplitude and prolonged latencies in the dark-adapted rod responses were also found in female carriers of X-linked RP (63,65). Therefore, ERG can be used in genetic counseling to detect carriers and early-affected subjects (Fig. 46.4) in families with a history of retinal pigmentary degeneration.
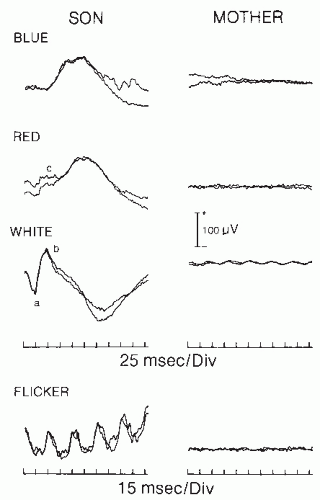 Figure 46.4 Full-field flash ERG in two members of a family. The mother (right) suffers from retinitis pigmentosa; her central vision is spared, although her peripheral vision is severely affected. She has nyctalopia. Note the absence of any recognizable ERG. The son (left), age 15, has normal fundus and normal visual acuity. The dark-adapted ERGs show small amplitude b wave, particularly to red and white light, suggesting early rod dysfunction. The flicker ERG is normal, indicating normal cone function, a, a wave; b, b wave; c, cone response. (From Celesia GG. Evoked potential techniques in the evaluation of visual function. J Clin Neurophysiol. 1984;1:55-76.) |
Other inherited retinal diseases demonstrate a more selective involvement of either rod or cone systems. Congenital nyctalopia, a nonprogressive autosomal-dominant disorder of rod function, is characterized by impaired night vision, normal daylight vision, and normal fundi. The ERG shows normal cone function but abnormal rod function with absent or severe reduction of the b wave in dark-adapted testing (Figs. 46.5 and 46.6). Oguchi disease, another form of night blindness, is characterized by diffuse graying of the fundus and specific ERG changes (66). The ERG in dark-adapted tests shows low amplitude or absent b waves similar to the ERG of congenital nyctalopes. However, if the eye is allowed to adapt to darkness for an extended period (more than 12 hours), a large amplitude b wave can be obtained in response to dim blue flash.
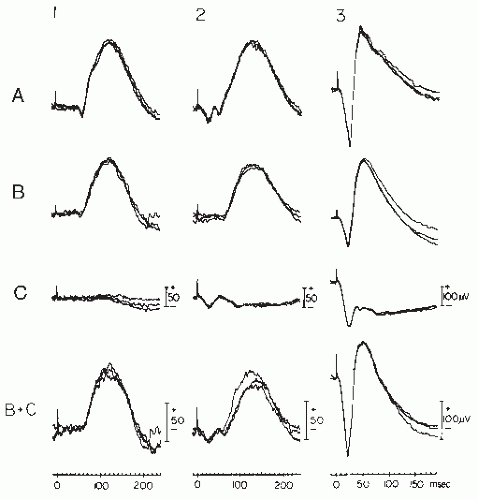 Figure 46.5 Three superimposed single-trace ERGs elicited in dark-adapted conditions by standard, dim, full-field, scotopically matched, blue (1), red (2), and white (3) flashes in a normal subject (A), a rod monochromat (B), and a congenital nyctalope (C). Waveforms in B + C are the algebraic summation of individual traces from rod monochromat (B) and congenital nyctalope (C), respectively. (From Chatrian GE, Nelson PL, Lettich E, et al. Computer assisted electroretinography. II. Separation of rod and cone components of the electroretinogram in congenital achromatopsia and congenital nyctalopia. Am J EEG Technol. 1980;20:79-88.) |
Congenital achromatopsia (rod monochromatism) affects the cone system selectively. It is characterized by absent color vision and impaired visual acuity. The ERG (Figs. 46.5 and 46.6) shows normal b waves in the dark-adapted state, but no cone oscillations to red flashes and no light-adapted responses, both responses generated via the cone system.
The ERG is also useful in evaluating paraneoplastic retinopathies. Cancer-associated retinopathy (CAR) involves photoreceptor degeneration, with an attendant decline in overall ERG amplitude (67, 68 and 69). Melanoma-associated retinopathy (MAR) impairs transmission from photoreceptors to DBCs and induces a selective reduction in the ERG b wave (70,71).
Central retinal occlusion (CRO) produces interesting ERG changes (2,72). In CRO, only the retinal circulation supplying the inner retina is impaired; the choroidal circulation remains intact. Sparing of the choroidal circulation results in intact
photoreceptors but impaired inner retinal function. The ERG, therefore, is characterized by a prominent a wave but depressed or absent b wave. This dramatic effect of retinal anoxia confirms that the a wave represents the leading edge of the large receptor potential (3,45).
photoreceptors but impaired inner retinal function. The ERG, therefore, is characterized by a prominent a wave but depressed or absent b wave. This dramatic effect of retinal anoxia confirms that the a wave represents the leading edge of the large receptor potential (3,45).
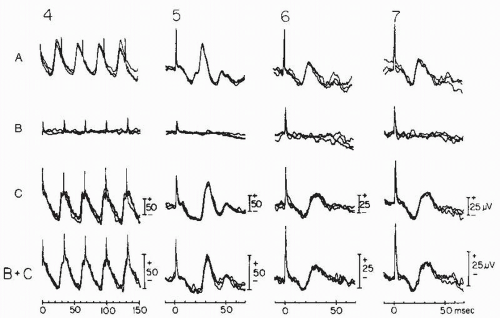 Figure 46.6 Continuation of Figure 46.5. ERGs evoked by standard 30-Hz white flicker stimulus in the absence of background light (4) and by standard single white (5) and photopically matched yellow-red (6) and blue-green (7) flashes in the presence of white background light. (From Chatrian GE, Nelson PL, Lettich E, et al. Computer assisted electroretinography. II. Separation of rod and cone components of the electroretinogram in congenital achromatopsia and congenital nyctalopia. Am J EEG Technol. 1980;20:79-88.) |
ERGs can also help assess degrees of retinal ischemia (73,74). Sabates et al. (74) have shown in central retinal venous occlusion (CRVO) that the b wave amplitude varies with the amount of retinal ischemia, the presence of which often precedes the development of neurovascular glaucoma. Johnson and Hood (75) show that ERG changes arise at the photoreceptor level.
Other potentially damaging conditions, particularly those that affect the retina diffusely, may be associated with reduced ERG amplitude (Figs. 46.7 and 46.8A). Damage of the retinal periphery will affect ERG rod components more severely than it will cone components.
Flash ERG testing, therefore, can be utilized in assessing retinal damage and has been shown to be abnormal in many disorders including diabetic and sickle cells retinopathies (76, 77 and 78), retinoschisis (79), cone and rod degenerations (7,80), as well as other disorders. Gouras and Niemeyer (81) suggest “Responses less than 10 µV are usually pathologic. Responses that are in the range of one µV indicate severe retinal pathology. Those of 0.1 µV or less, often called ‘extinguished,’ are invariably associated with a severe visual handicap.”
Superimposed on the ascending slope of the flash ERG are a series of four to six wavelets, the oscillatory potentials (OPs). The OPs are high-frequency responses in the region of 100 to 160 Hz and can be easily isolated from slower ERG components by selective filtering using an amplifier bandpass of 100 to 500 or 1000 Hz (82, 83 and 84). The origin of these signals is not completely clarified, but they appear to be generated in the IPL and most likely are related to depolarizing amacrine and interplexiform neuronal cells (85,86). OPs can be utilized as selective probes of the functional integrity of the neuronal circuitry of the proximal retina. Clinically, they have been shown to be abnormal in diabetic and ischemic retinopathies (Fig. 46.8B) independently and often before abnormalities of the b wave have been detected (76,87, 88 and 89).
While the flash ERG provides a useful index of overall retinal function, many retinal disorders impair only the macular region (7). Macular disorders are particularly disabling because they affect the high acuity fovea. Flash ERGs in such patients are typically normal. Two related approaches have been developed to address this issue. The focal ERG technique involves presenting a small (˜1 degree) high-frequency stimulus to the fovea using a stimulator-ophthalmoscope (90). An annular surround of steady light reduces the effectiveness of light scattered from the test region. This technique has been useful in evaluating patients with macular disease (91,92). The multifocal ERG
(mfERG) technique extends the focal analysis of retinal function by isolating responses to a large number of retinal areas simultaneously, providing a map of retinal function that defines outer retinal involvement in cases of visual loss (93 and 94). Guidelines for the clinical application of mfERG have been developed by the International Society for Clinical Electrophysiology of Vision (ISCEV)(95). mfERG is effective for early detection and assessment of a wide range of conditions that involve the retina in focal areas such as macular disease, vascular disease, inflammatory disorders, etc.
(mfERG) technique extends the focal analysis of retinal function by isolating responses to a large number of retinal areas simultaneously, providing a map of retinal function that defines outer retinal involvement in cases of visual loss (93 and 94). Guidelines for the clinical application of mfERG have been developed by the International Society for Clinical Electrophysiology of Vision (ISCEV)(95). mfERG is effective for early detection and assessment of a wide range of conditions that involve the retina in focal areas such as macular disease, vascular disease, inflammatory disorders, etc.
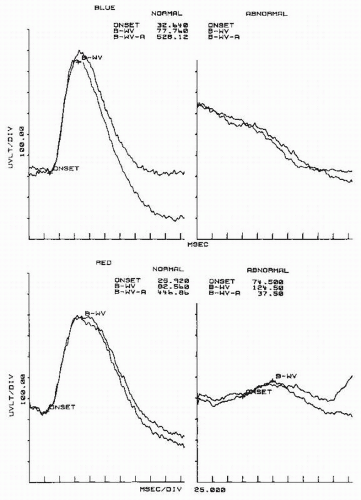 Figure 46.7 ERGs in the dark-adapted state to dim blue and red flashes in a normal subject (left column) and in a 54-year-old man with diabetic retinopathy (right column). The diabetic patient complained of impaired night vision and dimmed vision. Visual acuity was 20/25. Note that the b wave is almost absent to blue flashes and very small to red flashes, indicating severe impairment of the rod system. B-WV, latency of b wave; B-WV-A, amplitude of b wave. (From Celesia GG. Visual evoked responses. In: Owen JH, Davis H, eds. Evoked Potential Testing. Clinical Applications. Orlando, FL: Grune & Stratton; 1985:1-54.) |
Pattern Electroretinography
Pattern ERGs (P-ERGs) were first obtained by pattern-reversal stimuli, in which patterns alternate but mean luminance is kept constant (96,97; reviewed by Zrenner (98)). The spatial frequency amplitude function of the P-ERG shows a band-passing tuning behavior (99, 100, 101 and 102) with attenuation at low and high spatial frequencies. Attenuation at low spatial frequencies indicates that the P-ERG originates in cells with lateral inhibition and center-surround receptive field organization. Bipolar and ganglion cells both have center-surround receptive field organization. Transection of the optic nerve in cats and monkeys results in retrograde degeneration of the ganglion cells and abolition of steady-state and transient P-ERGs (99,102, 103, 104 and 105). The current source density analysis of P-ERG in monkeys has shown a dipole localized in the proximal 30% of the retina at the GCL/IPL/INL level (106,107). Zrenner and Nelson (108) recorded the membrane depolarizing potentials of amacrine cells and showed their remarkable similarity to the transient P-ERG. They suggested that P-ERG may be a mixture of ganglion and amacrine cell responses. Holder (109) suggests that the N95 component of P-ERG arises in the spiking activity of the retinal ganglion cells, whereas some of the b waves (or P50) arise in more upstream retinal structures (109,110).
It is now generally agreed that the P-ERG is predominantly a foveal response that originates in the proximal retina. The size of the spatial features of stimuli used to evoke the P-ERG is an important variable that may influence the source of the response
(82,99,106,111). P-ERGs to high and medium spatial frequency stimuli (i.e., with small stimulus elements) are dependent on the integrity of ganglion cells with a contribution from amacrine cells (99,101,106,108, 109 and 110,112,113). However, the pattern reversal to low spatial frequencies stimuli is a mixed response containing a second harmonic response to luminance (106,114,115).
(82,99,106,111). P-ERGs to high and medium spatial frequency stimuli (i.e., with small stimulus elements) are dependent on the integrity of ganglion cells with a contribution from amacrine cells (99,101,106,108, 109 and 110,112,113). However, the pattern reversal to low spatial frequencies stimuli is a mixed response containing a second harmonic response to luminance (106,114,115).
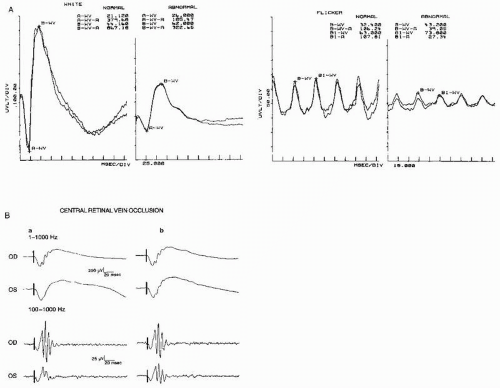 Figure 46.8 A: Continuation of Figure 46.7. The ERGs on the left were obtained in the dark-adapted state with white flashes. The ERGs on the right were obtained with 32-Hz white flicker. Both a and b waves to a white flash have a small amplitude. The latency of the b wave to flicker is delayed at 43.2 msec (boundary of normality, 36.0). These findings indicate the presence of a diffuse retinopathy. (From Celesia GG. Visual evoked responses. In: Owen JH, Davis H, eds. Evoked Potential Testing. Clinical Applications. Orlando, FL: Grune & Stratton; 1985:1-54.) B: A 32-year-old woman with central retinal vein occlusion in the left eye (OS). Visual acuity in the left eye was 20/200. A, ERGs recorded at the onset of the disorder; B, ERGs recorded 6 months later when the patient’s vision had recovered to 20/30. The upper half of the illustration shows the oscillatory potential (OP) riding on the ascending slope of the b wave. The lower half of the figure shows the simultaneously recorded OP with the low bandpass at 100 Hz to eliminate the a and b waves. The OPs are then easily recognizable. Note normal responses from the right eye (OD) and the small OPs from the left eye. The a and b waves were normal from both eyes. (From N.S. Peachey, unpublished data, 1991) |
P-ERGs to transient stimuli consist of a negative a wave followed by a positive b wave (Fig. 46.9). Often the b wave of P-ERG is called P50 and is followed by another negative wave called N95. The amplitude and latency of P-ERG waves are tabulated in Table 46.1. Guidelines for the clinical applications of P-ERG have been published by the International Society for Clinical Electrophysiology of Vision (ISCEV)(116).
If the P-ERG reflects postreceptor retinal activity and possibly ganglion cell activity, it can be used as a marker to determine retinocortical transient time (RCT), provided visual evoked scalp potentials are recorded simultaneously. RCT will then reflect activity outside the retina in the visual pathways (99,111,113,117). RCT is defined as the difference in milliseconds between VEP and ERG wave latencies. Two retinocortical times have been calculated: RCT(b-N70) equals the latency of N70 minus b wave (or P50) latency and RCT(b-P100) equals the latency of P100 minus the b wave (or P50) latency.
P-ERGs to steady-state stimulation consist of quasi-sinusoidal deflections as shown in Figure 46.9. The mean amplitude of a steady-state P-ERG to 15 checks is 2.5 µV; to 31 checks, it is 3.2 µV. In retinal lesions affecting the macula preferentially, Celesia and Kaufman (113) described abnormal transient P-ERGs in 89% of cases with checks of 15 and in 67% of patients with checks of 31. Small or absent P-ERG has also been noted in senile macular degeneration (Fig. 46.10). In cases of early macular degeneration, P-ERG was present but delayed (113,117). Similar absent or greatly depressed P-ERGs in macular diseases were described by Sherman (118) and Holder (109).
P-ERG abnormalities are not limited to maculopathies. They are also present in any optic nerve lesions with associated retrograde ganglion cell degeneration (100,113,119, 120, 121 and 122). The implications of P-ERG abnormalities in optic nerve dysfunction are discussed in more detail in the section on anterior visual pathway function.
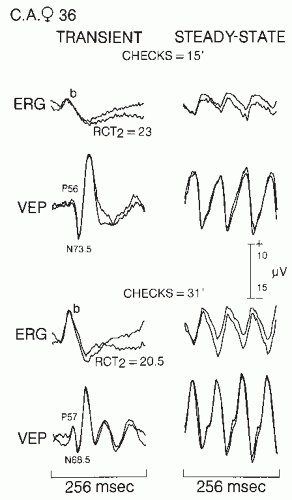 Figure 46.9 Normal pattern ERG (P-ERG) and visual evoked potential (VEP) to transient and steady-state pattern stimulation in a 36-year-old woman. Positive is upward for both P-ERG and VEP. In the calibration, 5 refers to P-ERG amplitude and 10 to VEP amplitude. Two responses are superimposed to verify reproducibility of the data. The upper half of the figure shows the responses to 15 checks; the lower half shows response to 31 checks. RCT2, retinocortical transmission time in milliseconds from the ERG b wave to the N70 deflection. |
A delayed P-ERG occurs only in macular diseases; absent or markedly depressed P-ERGs are present in either maculopathies or severe optic nerve diseases associated with axonal involvement and retrograde ganglion cell degeneration. It should be emphasized that in macular lesions flash ERGs are normal (Fig. 46.10). Thus, P-ERGs are useful in the assessment of macular function and retinal ganglion cell function (109,123). Holder (109) suggests that the P-ERG P50 (or b wave) can be used as an index of macular function. Reduction in P-ERG N95 with preservation of P50 may indicate dysfunction at the level of the retinal ganglion cells (109).
These data support the principle of selective activation: different structures of the retina can be preferentially, if not exclusively, activated by varying the type of stimulation (13). Flashes selectively activate retinal luminance and color detectors, whereas small pattern stimuli preferentially activate contrast and edge detectors.
FUNCTION OF ANTERIOR VISUAL PATHWAYS
Anatomy and Physiology
The optic nerve and chiasma are arbitrarily included in the definition of anterior visual pathways for the purpose of this review. The optic nerve from the eye to the chiasm is about 50 mm long and comprises nerve fibers originating in the ganglion cells. Nerve fibers from ganglion cells in the macula constitute the papillomacular bundle that occupies the entire temporal side of the optic disk. This bundle of fibers then moves toward the center of the optic disk as it approaches the chiasma. Fibers from peripheral ganglion cells occupy less central positions in the optic disk and optic nerve (124,125). The optic nerve fibers are small myelinated fibers; 92% of the axons are 2 µm or less in diameter, 6% have a diameter around 4 µm, and only 2% have a large axon (>4 µm) (126). Calculated conduction velocities range from 1.3 to 20 msec (127,128).
The human retina projects to both ipsi- and contralateral sides of the cortex. Fibers from the nasal retina cross in the chiasma; crossed and uncrossed fibers begin to separate at the termination of the optic nerve. Macular fibers also are subdivided into crossed and uncrossed fibers; the macular fibers from the nasal portion of the macula cross in the chiasma into the contralateral optic tract, whereas the macular temporal fibers travel into the ipsilateral optic tract.
The functional integrity of the visual pathways, once they enter the optic nerve, can be assessed using VEPs recorded from the occipital scalp region. It is presumed that these potentials are near-field potentials from the visual cortices (129,130). It is therefore important to review briefly the physiology of the central visual system. Visual neurons respond selectively to progressively more complex visual patterns, at ascending levels in the cortical hierarchy (131, 132, 133 and 134). Individual neurons can be selectively sensitive to movement orientation and direction and the width, length, velocity, and contrast of stimuli. Each neuron must be considered a multichannel coding device responding to specific information presented in the stimulus (13,135). There is anatomical and electrophysiologic evidence that the primate visual cortex is subdivided into distinct anatomical regions that process different types of visual information, and has a separate connection to the prestriate cortex (135, 136, 137, 138 and 139). The techniques of [14C]deoxyglucose autoradiography and cytochrome oxidase staining have demonstrated the existence of blobs, stripes, and columns representing complex units of cortical organization in the visual system (135, 136, 137 and 138).
Although there is still debate about whether cortical cells are feature detectors or spatial frequency filters (132,133,139, 140 and 141), it is generally agreed that the visual system is a multichannel device that processes information via parallel channels (142, 143 and 144) and that each channel constitutes a set of sequential processes (13).
Related posts:

Stay updated, free articles. Join our Telegram channel

Full access? Get Clinical Tree


