Arterial anatomy from the aorta to the arteries of the head. © CAT grafika.
Internal carotid arteries (ICAs): these large arteries are the main branches of the common carotid arteries. The internal carotid artery divides into the anterior cerebral artery (ACA) and the middle cerebral artery (MCA) (Figure 15.2).
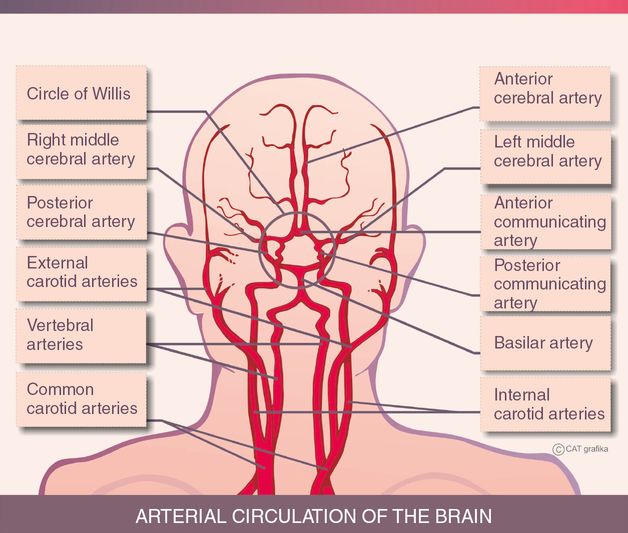
Arterial circulation of the brain. © CAT grafika.
Vertebral arteries unite to form the basilar artery, which is divided into posterior cerebral arteries (PCAs) to supply the posterior fossa with the posterior circulation. The posterior and anterior circulations are connected by the posterior communicating arteries.
The middle cerebral artery (MCA) arises from the ICA and continues into the lateral sulcus where it branches and provides many arteries. The MCA supplies the majority of the lateral surface of the hemisphere apart from the superior portion of the parietal lobe and the inferior portion of the temporal lobe and occipital lobe. In addition, it supplies a part of the internal capsule and basal ganglia.
The MCA is divided into M1, M2, M3 and M4 segments. For TCD the M1 and M2 segments are relevant.
M1: from the origin to bifurcation/trifurcation (the limen insulae); also known as horizontal or sphenoidal segment.
M2: from bi(tri)furcation to origin of cortical branches (circular sulcus of insula); also known as insular segment.
Normal variants of MCA duplication parallel the main MCA and supply the anterior lobe, rarely an accessory branch is found, MCA fenestration or early branching of the MCA-bi/trifurcation that occurs within 1 cm of origin.
The TCD emboli detection is done through the temporal bone window. Especially in elderly women, TCD cannot be performed because of the insufficient temporal bone window (window failure, WF) [49]. Both skull thickness and radiodensity at the level of the temporal bone window are strongly related to WF, as are age and female gender. After adjustment according to age and gender, skull thickness at the temporal bone window is an independent prognostic factor of WF. Due to the lack of temporal bone window, approximately 10–15% of the patients cannot be monitored by temporal TCD.
Imaging tips
The ultimate goal of transcranial embolus detection is to identify potential high-risk embolization with high specificity and validity (Figures 15.3 and 15.4). To achieve this aim several methods were developed to increase the accuracy of emboli detection [16,32,44].
Transcranial color duplex ultrasound investigation can be useful to find the optimal bone window. The suggested frequency is 2–2.5 MHz [35].
Simultaneous monitoring in multiple sample depths (MES appear sequentially in the insonated artery, but artifacts are observed at all depths simultaneously) improves MES/artifact discrimination [33,34] (Tables 15.1 and 15.2).
The recently developed power M-mode Doppler system (PMD) helps to define the optimal depth and the insonation direction for the proper monitoring. PMD constitutes in sum 33 sample gates, two sample volumes per mm, coloring red and blue depending on the flow direction in an M-mode spectrum. The spectrogram displays simultaneous signs of the blood flow velocities of the different vessels. MES appears as high-power sloping tracks on the M-mode spectrum [36,37].
Using a dual-frequency transducer for the analysis of MES results in higher sensitivity and specificity to distinguish between solid and gaseous embolism [8,38].
The validity and reproducibility of the aforementioned methods are better than that of manual techniques.
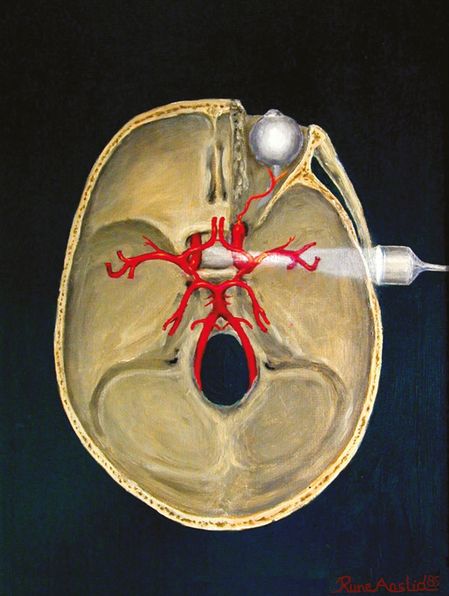
Position of the transducer. (Image courtesy of Rune Aaslid.)
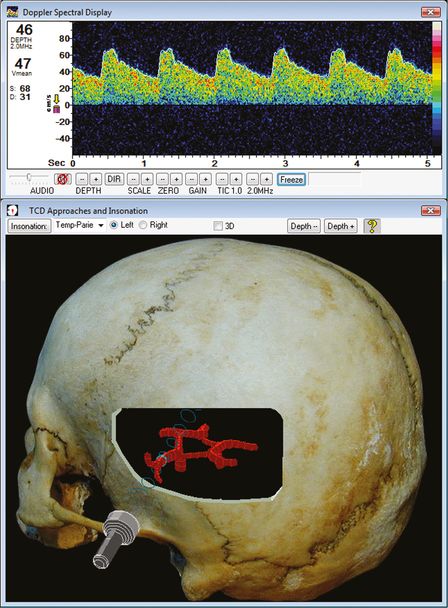
Doppler sign on left MCA. (Image courtesy of Rune Aaslid.)
| Type | MES | Artifact |
|---|---|---|
| Duration | <300 ms | Variable |
| Relative intensity increase | ≥3 dB | Variable |
| Frequency focusing | Present | Absent (maximal at low frequencies) |
| Direction | Unidirectional | Bidirectional |
| Frequency modulation | Usually absent | Present |
| Sound | Characteristic | Noise, non-tonal |
| Lambda (tail) sign | Present | Absent |
| MES type | Solid | Gaseous |
|---|---|---|
| Components | Platelet aggregates Fibrin clots Atheromatous materials | Air, gas, fat |
| Duration | Short | Long |
| Measured embolus to blood ratio (MEBR) | Low | High |
| Response to 100% O2 | No | Significant decrease |
| Appearance in cardiac cycle | Quasi-random | Random |
| Flow modulation | Can be present | Absent |
| Frequency modulation | Usually absent | Present |
| Compressibility | Absent | Present |
Steps of investigation
The patient should be informed, that he/she needs to stay still for the duration of monitoring (Figures 15.5 and 15.6).
The examining practitioner should position him/herself above the patient’s head comfortably, which allows the long-term monitoring. Depending on the doctor’s monitoring technique, the equipment’s display can be placed on the opposite site of the hand holding the transducer, next to the patient’s head.
Using a mobile workstation is helpful.
The monitoring should be performed (if repeated) at the same time of day.
In certain cases, simultaneous electrocardiogram recordings could be recommended (e.g., emboli detection in atrial fibrillation patients).
A preceding transcranial color duplex scan (TCCD) with a probe of 2–2.5 MHz could be helpful for identifying the target vessels and sample volumes’ position.
It is preferable to apply bilateral monitoring, however unilateral monitoring is also possible.
Power M-mode TCD can improve the identification of the MCA (Figure 15.7), and to determine the optimal recording depth, angle and sample volume.
Standardize ultrasound in general (acoustic output, gain, dynamic range, etc.) and probe-dependent (edge enhancement, frame averaging, target frame rate) settings.
To find the temporal bone window place the probe above the zygomatic arch and move it slightly upward or forward [39,40,41].
The headframe should be fixed tightly. If the patient has long hair, it is advisable to wear the hair up.
The MCA usually shows a low-resistance spectrum (similar to the ICA). By decreasing the depth and changing the insonation angle of the transducer the most optimal MCA signal should be detected and monitored. In case of weak signal, increase the gain and the power, and lengthen the sample volume to optimize the quality of ultrasound signal.
Keep the gain as low as possible to eliminate the disturbing background noise.
The transducer should be held in the optimal position to detect the Doppler signs. The headframe should be fixed only thereafter. The quality of headframe is critical, it should prevent the displacement of the probe and decrease the numbers of motion artifacts (Figure 15.8). There are some user-friendly frames:
Rimed Probe Holder LMY-3 (www.rimed.com/transcranial-doppler-products/probe-holder-lmy-3)
Spencer Technologies Marc 6oo Headframe system (www.spencertechnologies.com/products.html#marc]).
The optimal depth of the monitoring on the M1 segment of MCA is between 65 and 51 mm.
The registration time should usually last 60 minutes, but, for example, in case of prosthetic valve patients it can be shortened to 30 minutes or even extended in other clinical monitoring situations (e.g., surgical interventions).
Digital recording with validated computer-driven automatic analytical program can help in calculating the types and number of MES [32,36,38,41,42,43,44] (www.spencertechnologies.com/products.html#embolus, www.natus.com/documents/169-436600-1.02%20Emboli%20page_FNL.pdf).
The online analysis of the recorded signals further improves the reliability of monitoring, especially during invasive intervention (cardiac surgery or endarterectomy) [19,45,46].
A robotic probe and detection system (EMS-9UA) was developed for automatic searching and localizing vessel signals, and to automatically track the best position and to restore the lost signal (www.delicasz.com/html/en/).
Uploading of TCD images to a DICOM-compatible PACS is recommended.
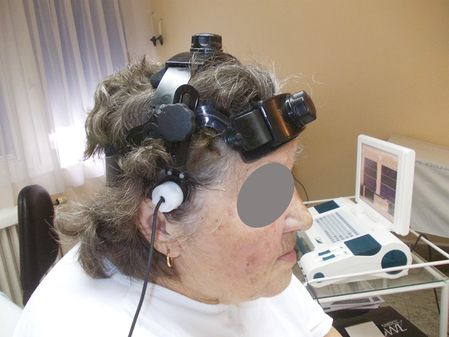
Localization of the headframe.
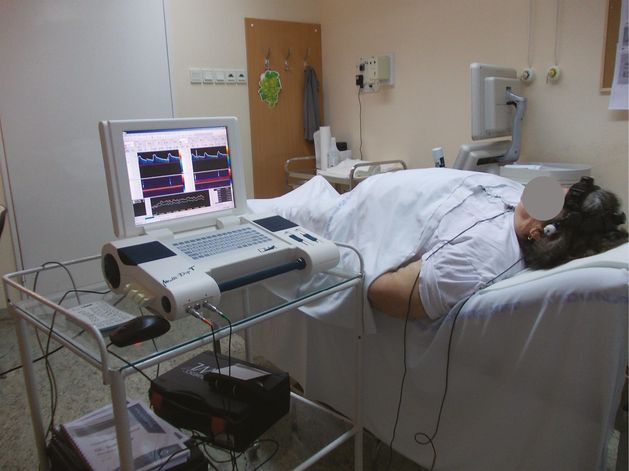
Location of the patient during embolic detection.
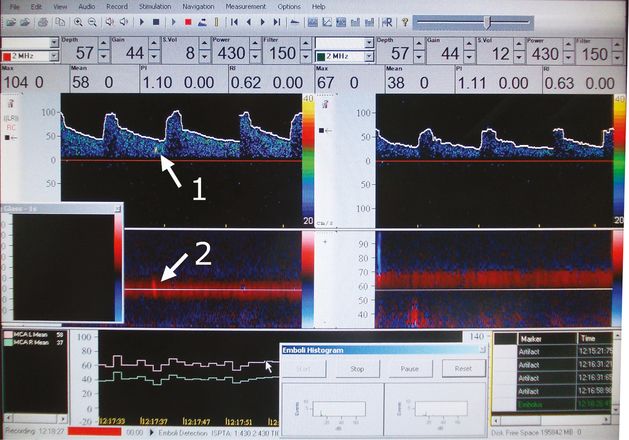
Microemboli on the right MCA. Arrow 1: in the Doppler spectrum. Arrow 2: in the power M-mode spectrum.
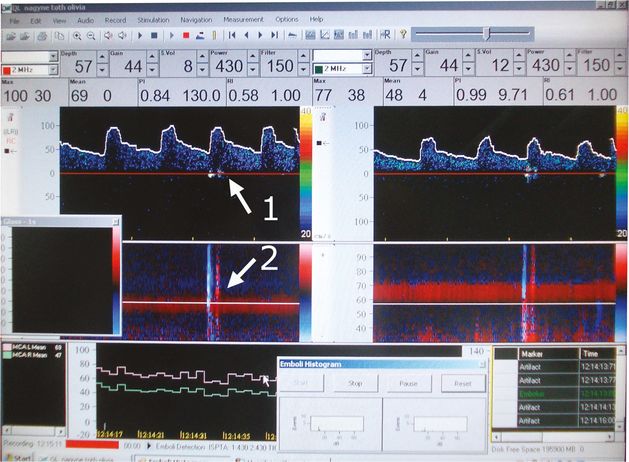
Artifact during detection on the right MCA. Arrow 1: in the Doppler spectrum. Arrow 2: in the power M-mode spectrum.
The TCD emboli detection should be standardized and thoroughly documented, even in the examination report:
Ultrasound device
Transducer type
Insonated artery (e.g., MCA)
Insonation depth (48–58 mm)
Algorithms for signal-intensity measurement
Scale settings (32–100 cm/s)
Detection threshold (≥ 3 dB and ≤9 dB)
Axial extension of sample volume (≥3 and ≤10 mm)
Fast Fourier transformation (FFT) size (number of points used; 64, 128, 256 points)
FFT length (time) (10–100 ms)
FFT transformation overlap (≥50%)
Transmitted ultrasound frequency (2 MHz)
High-pass filter settings (100–200 Hz)
Future directions
Efforts should be made to increase clinical applications of embolus detection (more efficient ultrasound penetration, automatic vessel finding and further optimizing of signal/noise ratio).
Further preclinical and clinical studies should be initiated for improving the reliability of identification of embolus constituents (blood? lipid? air? mixed?).
Further development of user-friendly head- frames that allow long-term embolus monitoring (e.g., surgery) or monitoring during physical exercise.
A new potential direction is the application of an ambulatory TCD system [44] (similarly to the cardiac Holter), which can provide good quality recordings over 5 hours. The emboli recording by TCD on a freely moving person may be helpful for detecting subclinical embolizations provoked by transient events (e.g., paroxysmal atrial fibrillation).
Analyzing the spectra visually in real time is time-consuming, expensive and involves possible errors. The further improvement of already existing automatic detecting systems is eagerly awaited to increase the reliability of the automatic embolic detection systems [14]. The “neuro-fuzzy system” which can achieve a differentiation between emboli and artifacts with a sensitivity, specificity and accuracy of 94.4% is a promising move in this direction [48].
The monitoring of MES can identify responders and nonresponders to therapy. Those patients whose embolic number has not decreased after therapeutic interventions or medical therapy are potentially at high risk for further events. Further prospective studies are needed to answer the question whether embolic detection-guided therapies could help to decrease the risk of stroke or transient ischemic attack. The frequency and number of the repeated monitoring should be determined as well by further clinical trials.
Although the conventional TCD MES detection systems try estimate the number of cerebral microembolisms, the diagnostic accuracy is still not satisfying. Cowe and Evans [41] and Lipperts et al. [11] recommend a new algorithm with high temporal resolution based on radiofrequency signal of a TCD system at least one order of magnitude better than conventional embolic detection methods.
The estimation of the embolus size during emboli detection is still an emerging issue. Banahan et al. elaborated a method to estimate the bubble size based on Doppler embolic size intensity [42]. Under ideal conditions, the in vitro method – in 69% of the cases – could measure correctly the real size of the emboli. Further improvement in this field is needed.
Table 15.3 summarizes the results of tests carried out with embolus detection in different disease groups and methodologies.
| Reference | Methods | Results | Notes |
|---|---|---|---|
| Cullinane et al. [10] | Bilateral transcranial Doppler recordings were made for 1 hour from the middle cerebral arteries of 111 successive patients with NVAF taking aspirin alone or no antithrombotic or anticoagulant therapy | MES were detected in 13 (15.1%) NVAF subjects but in no control subjects (P = 0.02). MES were detected both in subjects with symptomatic NVAF (4 of 30 [13.1%], P = 0.04 versus controls) and asymptomatic NVAF (9 of 56 [16.1%], P = 0.02 versus controls). There was no correlation between the presence of MES and symptomatic status, left atrial size, left ventricular function, or the presence of left atrial thrombus detected on TTE | MES can be detected in patients with NVAF at a low frequency. Particularly in asymptomatic patients, embolic signals show marked temporal variability. No correlation was found between the presence of previously reported clinical and echocardiographic markers of increased stroke risk and the presence of MES |
| Lindner et al. [6] | TCD monitoring on 33 patients before, 1, 5, 90 and 180 days after elective heart valve replacement | HITS increased from 3% to 41% on the first postoperative day, and remained unchanged during postoperative period. No influence on HITS of intensity of anticoagulation or valve type | The causative role of valve implant in the pathogenesis of HITS appears certain. Their number dramatically increases following valve implantation. Valve type, duration of valve implant or intensity of anticoagulation did not influence HITS count |
| Lipperts [11] | In the study algorithm with a high temporal resolution, based on the RF signal of a TCD system, has been designed to quantify the “cerebral embolic showers” during cardiac surgery | Evaluation by three independent observers of a training set demonstrates that the proposed method has a sensitivity of at least one order of magnitude better than the automatic detection algorithm on the existing Doppler device used | RF-based emboli detection can possibly become a standard addition to conventional Doppler methods, considering that accurate estimation of the embolic load supports quantification of neurologic risk during various surgical procedures |
| Stendel et al. [7] | The sensitivity and specificity of cTCD and cTTE in detecting a PFO were determined in a prospective study using cTEE as the reference standard. Valsalva maneuver after intravenous echo-contrast medium was administered in 92 candidates | A PFO was detected in 24 of the 92 patients (26.0%) using cTEE. cTCD correctly identified 22 patients, whereas cTTE only correctly identified 10. This corresponds to a sensitivity of 0.92 for cTCD and 0.42 for cTTE | cTCD is a highly sensitive and highly specific method for detecting a PFO. Because cTCD is noninvasive, it may be more suitable than cTEE for routine preoperative screening for a PFO. cTTE is not reliable in detecting a PFO |
| Markus et al. [8] | Gaseous MES in 7 patients obtained with PFO by intravenous agitated saline, solid MES in 23 patients with symptomatic ICA stenosis was examined, and detected by dual frequencies Embo-Dop system | A sensitivity of 50.3%, and specificity of 96.5% for detecting solid embolic signal. Discrimination was better than using a simple intensity threshold | One hopeful solution is to use multifrequency TCD device where middle cerebral artery is insonated simultaneously with 2.0 and 2.5 MHz to distinguish between solid and gaseous embolism |
| Orlandi et al. [26] | HITS detection during angiography in uni- or bilateral high-grade carotid stenotic patients | HITS identified on MCA 23.3% of patients, all were asymptomatic. HITS were common on the same side as >70% ICA stenosis compared with <70% (17.9%, P <0.05). No HITS on the same side as normal or occluded ICA | All of symptomatic ACI stenotic patients underwent endarterectomy, and none of them showed HITS after endarterectomy. Silent microembolism could be helpful in selecting a high-risk group of asymptomatic or carotid stenoses for endarterectomy |
| Spence [15] | 319 patients with >60% carotid stenosis were examined, who had never been symptomatic | 10% of the asymptomatic carotid stenotic patients (ACS) are MES positive, and there are hardly any changes during the first year (P <0.0001) and they are more likely to have a stroke during the first year | The results suggest that ACS will not benefit from endarterectomy until the occurrence symptoms or microemboli |
| Marcus et al. [20] | Randomize the patients >50% symptomatic ICA stenosis with MES positivity. Between the 107 patients were randomized, aspirin or aspirin+clopidogrel were received | On 7th day 43% of dual therapy patients were MES positive, compared with 72.7% of monotherapy patients (relative risk reduction 39.8%). In the 17 patients with ipsilateral events the frequency of MES was higher. (24.4/8.9) | The TCD embolic detection is a feasible method to evaluate the efficacy of antiplatelet therapy. Combined clopidogrel and aspirin is more effective than aspirin alone |
| Van Zuilen et al. [18] | HITS were detected before and after (1–2 hours, 1–7 days and 3 months) endarterectomy (CEA) in high-grade carotid stenotic patients | Inverse relationship was seen between the number of HITS and time since stroke or TIA. CEA resulted in a significant reduction in the number of HITS/hour 7 days (mean 6.0 versus 0.4, and 3 month (6.3 versus 0.0) after surgery P <0.005 | Ongoing microemboli to the brain should prompt reassessment of the operated carotid artery or a search for other potential emboli source |
| Garami et al. [23] | 7 patients with ipsilateral dual probe (pre/post device) were detected during CAS using protection devices | During the 5 stages (lesion crossing, predilatation, stent placement, postdilatation and filter/device removal) were monitored. Cumulatively, 227/189 (pre/post device) MES were detected | The simultaneous pre- and postfilter TCD embolic detection shows that the use of embolic protection devices decreases but does not eliminate the number of microembolic reaching |
| Káposzta et al. [24] | 118 patients within 72 hours of stroke onset were examined. When MES were detected during screening, simultaneous recording was performed from the ipsilateral MCA and common carotid artery, too | Embolic signals were detected in the symptomatic MCA in 16 patients (16%). Embolic signals were detected in 50% of the patients with carotid stenosis (P <0.0001), and in 4.5% of those with cardioembolic stroke. In the 16 patients with embolic signals, the proportion with embolic signals fell over time (P = 0.0025), but they were still present in a third at 2 weeks | Continued asymptomatic embolization is common after stroke in patients with carotid artery disease and is still present in a significant proportion at 2 weeks. The technique may identify patients at risk of further stroke for more aggressive antiplatelet therapy |
| Rubartelli et al. [17] | Distal occlusion device and filter protecting device system were compared during CAS by TCD before, during and after CAS | The total amount of MES during the procedure was higher when the filter device was employed (183.0+42.1 versus 31.7+12.0, P <0.0001) | The distal occlusion device appears to be more effective than the filter in reducing distal embolization detected by TCD monitoring |
| Forteza et al. [25] | Five patents with long-bone fractures were monitored by TCD during and after operation | MES was detected in all patients, and it was transient resolving within 4 days of injury. Intraoperative monitoring revealed an increase in MES during intramedullary nail insertion | Cerebral microembolism after long-bone fractures can be detected and it may have potential diagnostic and therapeutic implications |
CAS, carotid artery stenting; cTCD, contrast transcranial Doppler ultrasonography; cTEE, contrast transesophageal echocardiography; cTTE, contrast transthoracic echocardiography; HITS, high-intensity transient signals; MES, microembolic signal; NVAF, nonvalvular atrial fibrillation; PFO, patent foramen ovale; RF, radiofrequency; TCD, transcranial Doppler; TTE, transthoracic echocardiography.
Related posts:


Stay updated, free articles. Join our Telegram channel

Full access? Get Clinical Tree


