Bone windows with typical transducer positions applied for TCS. The orientation of transducer is indicated by a blue arrow (arrow head corresponding to left side on ultrasound screen). (A) Transducer placement for transtemporal axial brain imaging. (B) Transducer placement for transfrontal sagittal brain imaging.

Examples for different temporal bone window quality. T = thalamus; * = frontal horn; arrow indicates pineal gland. (A) Insufficient bone window. Even though the skull bone contralateral to insonation is partly displayed on TCS, assessment of brain parenchyma is impossible since not even central anatomic landmark structures like midbrain of pineal gland are discernable. (B) Partial (narrow) bone window. Central landmarks such as pineal gland, bilateral thalami and third ventricle are displayed while basal ganglia and frontal horns of lateral ventricles are hidden. (C) Good bone window. The contralateral skull bone is clearly visualized over its whole extension in the imaging sector, and all key structures of the axial thalamus plane (pineal gland, bilateral thalami, third ventricle, contralateral frontal horn) are displayed.

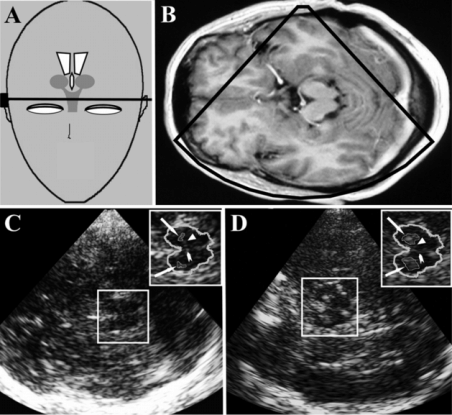
TCS at axial midbrain imaging plane. (A) Schematic illustration of transducer position and angulation. (B) MR image corresponding to the TCS images shown in (C) and (D). (C) TCS image of a subject with normal findings of substanta nigra (SN) and midbrain raphe. The insert panel in the right upper corner shows the zoomed midbrain aspect with normal echogenic SN which is surrounded bilaterally for measurement of its echogenic area (arrows), normal echogenic raphe (arrow head) and red nucleus (triangle). (D) TCS image of a subject with bilateral SN hyperechogenicity. The insert panel in the right upper corner shows the zoomed midbrain aspect with hyperechogenic SN which is surrounded bilaterally for measurement of its echogenic area (arrows), normal echogenic raphe (arrow head) and red nucleus (triangle).
Imaging tips
For TCS, high image contrast is preferable which is enabled by lowering the dynamic range to 45–50 dB, and by choosing a preset of postprocessing function with moderate suppression of low echogenic signals [5]. TCS is usually performed with conventional ultrasound mode and not with tissue harmonic imaging mode since the latter is more dependent on quality of bone window. The highest image resolution on TCS using a 2.0- to 3.5-MHz phased-array transducer is present at an image depth of 5–9 cm which is the so-called focal zone of the transducer [7]. The image resolution in the axial direction (i.e., along the axis of ultrasound propagation) is about two- to threefold higher than in the lateral direction (usually about 0.7 × 2 mm; with high-end systems up to 0.7 × 1.1 mm) which is the cause also for some typical imaging artifacts (e.g., the enlargement of small, highly echogenic structures in the lateral direction) [5,7]. Measurements of small echogenic structures are influenced by lab-chosen system settings and by manufacturer-specific image postprocessing technologies. That is why normal ranges especially for the echogenic area of the SN need to be obtained for each different ultrasound system and, ideally, for each different lab.
Steps of investigation
2. The investigation room should be darkened.
3. For TCS, a 2.0- to 3.5-MHz phased-array transducer is applied, with the center frequency usually set at 2.5 or 3.0 MHz. In the case of poor bone window the penetration of ultrasound waves through the skull bone can be improved by setting the center frequency at 2.0 MHz at the cost of lower image resolution.
4. The TCS transducer is placed on the right temple near the ear and parallel to the orbitomeatal line in order to obtain a standardized axial view of intracranial structures (Figure 24.1A).
5. The optimum transtemporal bone window is found by moving the transducer near (or above) the anterior helix of the ear conch and searching for the position with best available visualization of brain structures and contralateral skull bone. Note that the stability of transducer position should be controlled by pressing the transducer but also the small finger/ulnar edge of the hand firmly at the patients’ head throughout the whole examination.
6. The butterfly-shaped midbrain surrounded by the highly echogenic basal cisterns is identified on the monitor (Figure 24.3).
7. Image brightness is adapted at moderate level. Time gain compensation and image brightness are adapted manually as needed or, if available, by applying the automated image optimization (i.e., pressing the referring button on the keyboard – a standard feature of contemporary, high-end ultrasound systems).
8. The whole rostrocaudal dimension of the midbrain is scanned by tilting (angulating) the transducer slightly up and down. Thereby the investigator focuses his/her attention on the monitor to identify the echosignals of SN, midbrain raphe and red nucleus in their referring anatomic location by their brightness which is similar to that of the basal cisterns surrounding the midbrain. ► Quality criterion of adequate visualization of SN: the echo signals of SN are displayed at a typical anatomic location in the crus mesencephali and well separated from the echo signals of red nucleus and basal cisterns [5]. ► Quality criterion of adequate assessability of midbrain raphe: basal cisterns, aqueduct and red nucleus are clearly displayed [5].
9. The axial midbrain transection showing the echo signals of ipsilateral SN in its largest extension is located by slight tilting of the transducer.
10. The clearest, most compact view of the SN echogenic signals is located by very slight transducer movements. During this, the investigator’s free hand should be touching the freeze button of the keyboard. Once the SN is seen very clearly, even if only for a short time, the image is frozen immediately. After moving back to the optimum frame using the cine mode, the midbrain is zoomed out two- to threefold. The SN echogenic signals are surrounded manually by the cursor using the trackball, resulting in automatic calculation of echogenic area. When surrounding the SN’s echo signals one should avoid the erroneous inclusion of highly echogenic signals of structures neighboring the SN (i.e., red nucleus and basal cisterns) [9].
11. By re-scanning as described in (9) and (10) a second measure and if necessary further measures are obtained. If the measures are stable, their mean value is considered to represent right-sided SN echogenic size.
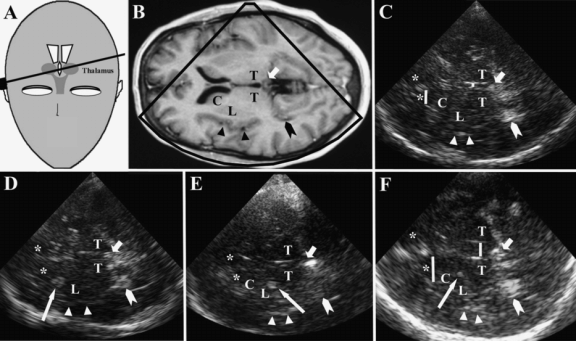
12. Tilting the probe more cranially by about 20°, the third ventricle, thalami, basal ganglia and frontal horns are assessed (Figure 24.4). Even if the bone window is poor the pineal gland mostly is visible due to its calcification which therefore represents an important landmark structure in the basal ganglia plane (Figure 24.2B). The third ventricle appears as a highly echogenic double line between the thalami indicating its lateral borders. Near to the midline in a more frontal position the frontal horns of lateral ventricles are displayed; sometimes it is necessary to tilt the imaging sector somewhat in the frontal direction for visualization of frontal horns. ► Quality criterion of adequate display of axial thalamus plane: pineal gland (usually highly echogenic due to calcification), bilateral thalami (= reference structure), third ventricle and contralateral frontal horn are clearly visible [5].
13. The width of the third ventricle is measured at the location of its smallest width, placing the two measurement marks at the inner edges of the two highly echogenic border lines of the ventricle. The width of contralateral frontal can be measured at the most anterior conjunction of bilateral frontal horns (septum pellucidum) [5].
14. Basal ganglia are usually assessed contralaterally to the side of insonation (unlike SN) since the contralateral structures are displayed in larger area in the sector-shape sonogram [1]. The echogenicity of lenticular and caudate nucleus is considered normal if it is similar to that of surrounding brain parenchyma (Figures 24.2C and 24.4C). If areas of focal or diffuse increase of echogenicity compared to that of surrounding brain parenchyma are visible at location of lenticular or caudate nucleus the referring nucleus is classified as hyperechogenic (Figure 24.4). Hyperechogenic areas may be quantified by planimetric measurements, similar to measurements of SN echogenicity. Note that the highly echogenic borders of the the third ventricle and the lateral ventricles, and more caudally also the basal cisterns, may cause misdiagnosis of a basal-ganglia hyperechogenicity due to lateral imaging artifacts [5]. Moreover, with good bone windows reverberation artifacts originating from highly echogenic ventricular structures (borders, choroid plexus) may mimic basal ganglia hyperechogenicity. Therefore the anatomical relationship between the basal ganglia and neighbouring structures should be clarified by slightly tilting and twisting the probe.
15. The procedures described in (4)–(14) are performed through the left transtemporal bone window.

TCS at axial thalamus imaging plane. C = head of caudate nucleus; L = lenticular nucleus; T = thalamus; * = frontal horn; short arrow indicates pineal gland (highly echogenic due to calcification); arrow head, choroid plexus of dorsal horn (highly echogenic due to calcification); triangles, insula; long arrows, basal ganglia hyperechogenicity. (A) Schematic illustration of transducer position and angulation. (B) MR image corresponding to the TCS images shown in (C)–(F). (C) TCS image of a subject with normal ventricle widths and normal aspect of basal ganglia. Note that the basal ganglia cannot be discriminated by their echogenicity from the surrounding brain parenchyma. Yellow bars indicate the measurement of width of third ventricle and contralateral frontal horn. (D) TCS image of a subject with hyperechogenicity of caudate nucleus (long arrow) typical for Huntington’s disease. (E) TCS image of a subject with hyperechogenicity of lenticular nucleus (long arrow) typical for idiopathic dystonia and atypical parkinsonian disorders. (F) TCS image of a subject with hyperechogenicity of lenticular nucleus (long arrow) and dilatation of third ventricle typical for progressive supranuclear palsy.
Applications in neurodegenerative disorders
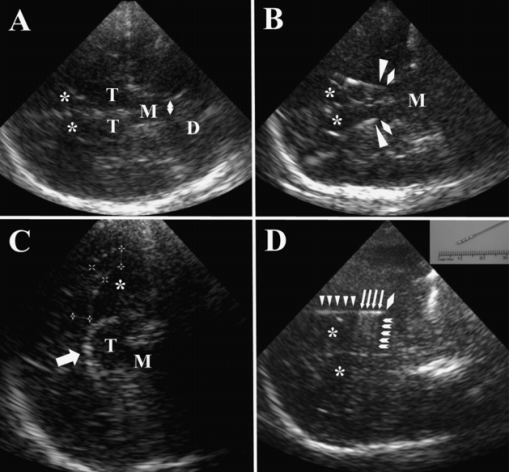
In neurodegenerative diseases, transtemporal TCS is usually carried out in two standard axial imaging planes, the midbrain plane and the thalamus plane (Figures 24.3 and 24.4). For some diagnostic questions TCS is additionally performed in semi-coronal and coronal scanning planes (Figure 24.5), for example, for the localization of DBS electrodes [1,2,3,5].

TCS at various imaging planes. D = dentate nucleus; M = midbrain; T = thalamus; * = frontal horn. (A) Transtemporal, semicoronal (45°) imaging plane through the bilateral thalami and midbrain. In this plane, the fourth ventricle can be assessed which is located in the dorsal vicinity of the midbrain. The double arrow indicates the width of the fourth ventricle. (B) Transtemporal, semicoronal (45°) imaging plane through the bilateral thalami and midbrain of a patient with bilateral deep brain stimulation (DBS) of ventro-intermediate thalamic nucleus. Rhombi indicate the virtual tips of DBS leads, triangles the true location of DBS lead tips. The difference between virtual and true tip is caused by a lateral imaging artifact originating from the highly echogenic metal contacts. (C) Transfrontal, sagittal paramedian imaging plane through the corpus callosum (indicated by measuring marks) and thalamus (arrow = choroid plexus of lateral ventricle). (D) Transtemporal, nearly coronal imaging plane showing the course of the DBS electrode with its tip located in the globus pallidus internus (rhombus: virtual tip). The DBS lead array with the four metal contacts (arrows) can be distinguished from the cable (triangles) by the reverberation artifacts originating from the metal contacts (arrow heads). The inserted panel in the right upper corner shows a photograph of the DBS lead.
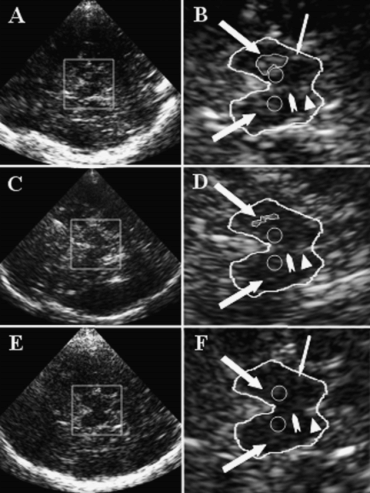
Structures in the midbrain plane (SN, raphe) are assessed mainly for the early and differential diagnosis of Parkinson disease (PD) [2,5] and the position control of DBS electrodes in the subthalamic nucleus [3]. The SN echosignals may have patchy, band-like or sometimes a wide oval appearance (Figure 24.6). Its appearance may slightly vary even in the same individual if using different transducer angulations, or various ultrasound systems [9]. The best-validated method to grade SN echogenicity is the planimetric measurement of SN’s echogenic signals in the axial plane [9,10]. Because of potential interference with echosignals originating from structures of the basal cisterns, echogenicity of SN is assessed only ipsilaterally to insonation; therefore TCS of SN needs to be performed from both sides. A detailed description with video samples is available [9]. The interindividual variation of SN echogenicity has been suggested to be caused by a variable degree of local iron accumulation and abnormal iron-protein-compounds [2]. Between the 18th and 75th year of age the distribution of SN echogenicity can be regarded as nearly constant [11,12], even though a moderate increase during adult life decades may occur [13], which was reported to be more pronounced after the age of 80 [14]. To rate SN echogenicity in an individual as normal or increased (“hyperechogenic”), the 75% and 90% percentile of measures in normal population are used as a reference [1], and the larger of bilaterally measured SN echogenic sizes is used for classification as follows: normal echogenic SN present if area measure is below the 75% percentile; moderately hyperechogenic present if area measure is between the 75% and the 90% percentile; markedly hyperechogenic present if area measure is above the 90% percentile. To establish normal ranges for a specific ultrasound system, at least 50 healthy adults should be investigated bilaterally to obtain at least 100 measures [2]. Table 24.1 summarizes cut-off values published so far for various ultrasound systems [6,10,11,12,13,15–23].

TCS findings of midbrain structures. Thick arrows indicate bilateral substantia nigra (SN); circles, red nuclei; arrow head, raphe; triangle, aqueduct. The thin arrow indicates a typical lateral imaging artifact originating from the basal cisterns that should not be included in measurement of SN echogenic area. (A) TCS image of a subject with bilateral substantia nigra (SN) hyperechogenicity. (B) Zoomed midbrain TCS image corresponding to the image shown in (A). The midbrain is surrounded for better recognition. Thick arrows indicate bilaterally hyperechogenic SN (ipsilateral SN surrounded for measurement of echogenic area). (C) TCS image of a subject with bilaterally normal echogenic SN. (D) Zoomed midbrain TCS image corresponding to the image shown in (C). Thick arrows indicate bilaterally normal echogenic SN (ipsilateral SN surrounded for measurement of echogenic area). (E) TCS image of a subject with reduced echogenicity of midbrain raphe. (F) Zoomed midbrain TCS image corresponding to the image shown in (C). Thick arrows indicate bilaterally hypoechogenic SN reported to be typical for restless legs syndrome; arrow head: invisible (hypoechogenic) raphe reported to be typical for depressive disorders.
| Manufacturer /ultrasound system | Probe/frequency (MHz) | Cut-off value (cm²) SN ha Marked SN ha | References |
|---|---|---|---|
| Aloka/Prosound SSD-5500 | Cardiac/2.5 | ≥0.20 | Budisic et al. [15] |
| Aloka/Prosound Alpha 10 | UST-52105/2.5 | ≥0.19 ≥0.25 | Mijajlović et al. [16] |
| Esaote/AU4 | Phased-array/2.5 | ≥0.20 | Ressner et al. [17] |
| Esaote/MyLab25 Gold | PA240/2.5 | ≥0.20 ≥0.25 | Go et al. [6] |
| Esaote/MyLab Twice | PA240/2.5 | ≥0.24 ≥0.30 | (Author’s own data) |
| Esaote/Technos MP | Sector/2.5 | ≥0.19 ≥0.25 | Mijajlović et al. [18] |
| General Electric/Logiq 7 | 3S/2.5 | ≥0.24 | Stockner et al. [19] |
| General Electric/Logiq 9 | 3S/2.5 | ≥0.20 | Fedotova et al. [20] |
| Philips/HDI 5000 SonoCT | P2-4/2.5 | ≥0.20 | Kim et al. [21] |
| Philips/HP Sonos 5500 | S4/2.0–2.5 | ≥0.20 ≥0.27 | Mehnert et al. [12], Hagenah et al. [13] |
| Siemens/Acuson Antares | PX4-1/2.5 | ≥0.24 ≥0.30 | Van de Loo et al. [10] |
| Siemens/Sonoline Elegra | 2.5PL20/2.6 | ≥0.20 ≥0.25 | Berg et al. [11] |
| Toshiba/Aplio XG | PST-20CT/2.5 | ≥0.16 ≥0.22 | Vivo-Orti et al. [22] |
| Toshiba/Xario | PST-20CT/2.5 | ≥0.21 | Alonso-Cánovas et al. [23] |
SN h, substantia nigra hyperechogenicity.
a The cut-off values for the ultrasound systems Siemens Sonoline Elegra, GE Logiq 7, Philips HP Sonos 5500 and Toshiba Aplio XG were obtained by studying large normal populations. With most other TCS systems, the cut-off values were derived from receiver operating characteristic curve analysis of diagnostic discrimination between PD patients and healthy subjects, and/or by direct comparison of two different ultrasound systems in the same study cohort. For the specific ultrasound system settings, confer indicated references.
Stay updated, free articles. Join our Telegram channel

Full access? Get Clinical Tree


