Chapter 32C Clinical Neurophysiology
Transcranial Magnetic Stimulation
At the beginning of the 1980s, Merton and Morton developed the first method of noninvasive brain stimulation, transcranial electrical stimulation (TES), and this had obvious clinical application. They used a single, brief, high-voltage electric shock and produced a relatively synchronous muscle response, the motor evoked potential (MEP). The latency of MEPs was compatible with activation of the fast-propagating corticospinal tract. It was immediately clear that this method would be useful for many purposes, but a problem with TES is that it is painful owing to simultaneous stimulation of pain fibers in the scalp. Five years later, Barker and colleagues demonstrated that it was possible to stimulate the brain (and nerves as well) using external magnetic stimulation (transcranial magnetic stimulation; TMS), with little or no pain. TMS is now commonly used in clinical neurology to study central motor conduction time. Depending on the stimulation techniques and parameters, TMS can excite or inhibit the brain activity, allowing functional mapping of cortical regions and creation of transient functional lesions. It is now widely used as a research tool to study aspects of human brain physiology including motor function and the pathophysiology of various brain disorders. Because TMS can influence the brain, there have been attempts to use it as therapy, particularly when used repetitively (repetitive transcranial magnetic stimulation, rTMS). Therapeutic investigations have included stroke rehabilitation, amelioration of movement disorders, and alleviation of pain and tinnitus, but effects demonstrated so far have generally been mild. There is currently only one therapeutic indication for rTMS: medically intractable depression (Padberg and George, 2009). In this situation it can be used as an alternative to electroconvulsive therapy (ECT) to induce a remission which would then be pharmacologically maintained.
Methods and Their Neurophysiological Background
For magnetic stimulation, a brief, high-current (usually several thousands amps within 200 µs) electrical pulse is produced in a coil of wire called the magnetic coil, which is placed above the scalp. A magnetic field is induced perpendicular to the plane of the coil. Such a rapidly changing magnetic field induces electric currents in any conductive structure nearby, with the flow direction parallel to the magnetic coil but opposite in direction. The magnetic field falls off rapidly with distance from the coil; with a 12 cm–diameter round coil, the strength falls by half at a distance of 4 to 5 cm from the coil surface. For this reason, stimulation is severely attenuated at deep sites. The electrical field induced by TMS is parallel to the surface, and horizontally oriented excitable elements such as the axon collaterals of pyramidal neurons and various interneurons are excited preferentially.
In experimental animals, a single electrical stimulus applied at threshold intensity to the motor cortex produces descending volleys in the pyramidal tract with the same velocity at intervals of about 1.5 ms. The first volley is termed the D-wave (D for direct wave), which is thought to originate from the direct activation of the pyramidal tract. The subsequent volleys are termed I-waves (I for indirect wave), presumed to be elicited by transsynaptic activation of the pyramidal tract via intrinsic corticocortical circuitry. TMS also produces both D- and I-waves in descending pyramidal neurons. In contrast to electrical stimulation that preferentially evokes D-wave first, TMS at threshold intensity often produces a corticospinal volley with I-waves but no early D-wave (Ziemann and Rothwell, 2000). This finding suggests that TMS activates pyramidal neurons indirectly through synaptic inputs but does not activate them directly, presumably because of the direction of its current flow. Standards for the use of TMS and review of side effects have been published (Rossi et al., 2009).
Stimulation Parameters
Central Motor Conduction Measurements
With TMS, it is possible to measure conduction in central motor pathways (central conduction time; CCT). CCT can be estimated by subtracting the conduction time in the peripheral nerves and neuromuscular junction from the total latency of MEPs measured at the onset of the initial deflection. Peripheral motor conduction time is currently measured through two methods: (1) F-wave recordings for the measurement of spine-to-muscle conduction time and (2) direct stimulation of the efferent roots and nerves over the spine. Magnetic stimulation on the posterior neck or the dorsal spine activates spinal roots at the level of the intervertebral foramen. Since the cervical roots are excited about 3 cm away from the anterior horn cell, magnetic stimulation of the roots is not an accurate measurement of CCT and may miss a proximal partial or complete block of impulse propagation. F-waves are usually elicited in the relaxed state by delivering supramaximal stimulation to the peripheral motor nerve at a site near the muscle under examination. The stimulus evokes an orthodromic volley in the motor nerves that produces a short latency response in the muscle (M wave). In addition, an antidromic volley travels back to the spinal cord, exciting the spinal motoneurons, and an efferent volley travels down to the motor nerve, causing a late excitation of the muscle known as the F-wave. Total peripheral motor conduction time can be estimated as: (F + M − 1)/2 (1 is the time due to the central delay at the level of α-motoneuron). Consequently, the CCT can be obtained as follows: MEP latency − (F + M − 1)/2. Using this method, the average CCT is about 6.4 ms for the thenar muscles and 13.2 ms for the tibialis anterior.
Motor Excitability Measurements
Motor Thresholds
Motor threshold (MT) represents the minimal stimulation intensity producing MEPs in the target muscle. This can be measured in resting (resting motor threshold, RMT) or contracting (active motor threshold, AMT) muscles. RMT is determined to the nearest 1% of the maximum stimulator output and is commonly defined as the minimal stimulus intensity required to produce MEPs of greater than 50 µV in at least 5 out of 10 consecutive trials. Here the MEP amplitudes are usually measured peak to peak. AMT is determined in the moderately active muscle (usually between 5% and 10% of the maximal voluntary contraction) and is defined as the minimum intensity that produces either MEPs of greater than 100 µV or silent period or MEPs of greater than 200 µV in at least 5 out of 10 consecutive trials. MT in resting muscle reflects the excitability of a central core of neurons, depending on the excitability of individual neurons and their local density. Since MT can be influenced by drugs that affect voltage-gated sodium and calcium channels, it may represent membrane excitability.
MEP Recruitment Curve
The recruitment curve, also known as the stimulus response curve or the input-output curve, is the growth of MEP size as a function of stimulus intensity. This underlying physiology is poorly understood but appears to involve neurons in addition to the core region activated at threshold. The slope of the recruitment curve is related to the number of corticospinal neurons that can be activated at a given stimulus intensity, mainly indirectly through corticocortical connections. The neurons that can be activated at a lower threshold are highly excitable neurons located in core regions of corresponding motor cortex, while neurons recruited at a higher intensity may have a higher threshold for activation, either because they are intrinsically less excitable or because they are spatially further from the center of activation by the magnetic stimulus. These neurons would be part of the “subliminal fringe.” The changes in recruitment curve are usually more prominent with higher-intensity stimulations. This finding suggests that the recruitment curve may represent the excitability of less excitable or peripherally located neurons rather than highly excitable core neurons or the connections between them. The slope of the recruitment curve is increased by drugs that enhance adrenergic transmission (e.g., dextroamphetamine) and is decreased by sodium and calcium channel blockers and by γ-aminobutyric acid (GABA) agonists.
Silent Period and Long-Interval Intracortical Inhibition
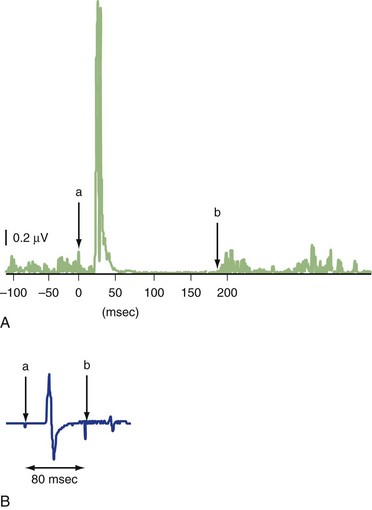
The silent period (SP) is a pause in ongoing voluntary electromyography (EMG) activity produced by TMS (Fig. 32C.1, A). The SP is usually measured with a suprathreshold stimulus in moderately active (usually 5%−10% of maximal voluntary contraction) muscle. SP duration is usually defined as the interval between the magnetic stimulus and the first recurrence of rectified voluntary EMG activity (Chen et al., 1999; Curra et al., 2002). While the first part of the SP is due in part to spinal cord refractoriness, the latter part is entirely due to cortical inhibition (cortical silent period, CSP). If a second suprathreshold test stimulation (TS) is given during the SP following suprathreshold conditioning stimulus (CS) (usually 50−200 ms after the first stimulus), its MEP is significantly suppressed (long intracortical inhibition; LICI) (see Fig. 32C.1, B) (Chen et al., 1999; Curra et al., 2002). SP and LICI appear to assess GABAB function, although other drugs affecting membrane excitability or dopaminergic transmission also influence SP. Although LICI and SP share similar mechanisms, they may not be identical, because they are affected differently in various diseases (Berardelli et al., 1996).

Fig. 32C.1 A, Rectified electromyography (EMG) recording of the first dorsal interosseus after single transcranial magnetic stimulation (TMS) under isometric contraction at 10% of maximal voluntary contraction. The silent period (SP) can be measured from TMS trigger (a) to reoccurrence of EMG activity (b). B, Paired-pulse TMS with suprathreshold conditioning stimulation. Test stimulation (b) with same stimulation intensity is applied at 80 ms after conditioning stimulation (a). MEP of test stimulation is significantly suppressed compared to conditioning stimulation. LICI, Long intracortical inhibition.
Short-Interval Intracortical Inhibition and Intracortical Facilitation
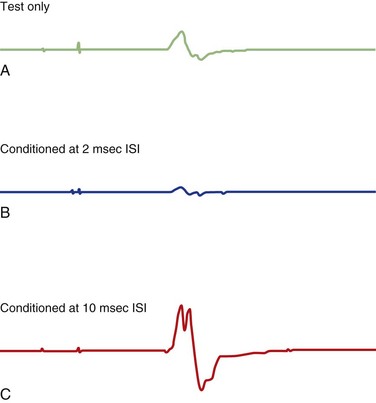
Various inhibitory and excitatory connections in the motor cortex can be evaluated by TMS using a paired-pulse technique. A subthreshold CS preferentially excites interneurons, by which MEPs from a following TS are suppressed at interstimulus intervals (ISIs) of 1 to 5 ms (short intracortical inhibition; SICI for such inhibition at short intervals) or facilitated at ISIs of 8-20 ms (intracortical facilitation; ICF) (Fig. 32C.2) (Ziemann, 1999; Ilic et al., 2002). SICI and ICF reflect interneuronal activity in the cortex. SICI is likely largely a GABAergic effect, especially related to GABAA receptors, whereas ICF is largely a glutamatergic effect. SICI can be divided into two phases, with maximum inhibition at ISI of 1 ms and 2.5 ms. SICI at 1 ms ISI is presumably caused either by neuronal refractoriness resulting in desynchronization of the corticospinal volley or by different inhibitory circuits; SICI at ISI of 2 ms or longer is most likely a synaptic inhibition.

Fig. 32C.2 Paired-pulse transcranial magnetic stimulation with subthreshold conditioning stimulation. At 2 ms interstimulation interval (ISI) (B), motor evoked potential (MEP) amplitude is significantly suppressed compared to test stimulation alone (A) (i.e., short intracortical inhibition, SICI). At 10 ms ISI, MEP amplitude is significantly increased (C) (i.e., intracortical facilitation, ICF).

Stay updated, free articles. Join our Telegram channel

Full access? Get Clinical Tree

