General Aspects
Diffusely infiltrating gliomas comprise the most important intrinsic brain tumors. This category of tumors includes the fibrillary astrocytomas, glioblastomas, and the oligodendroglioma family of tumors. When afflicting younger patients, they lead to years of increasing morbidity. In the older population, they strike hard and fast. These tumors lack any true margin; the surgeon cannot completely remove and cure them. Compounding the difficulties in the clinical management of these tumors are the continuing controversies about how to best classify them. Should the diagnosis be based solely on histology? Molecular genetics? Neuroimaging characteristics? Although intraoperative smears cannot resolve these complexities, they do contribute biologic data to our understanding of these tumors, thus adding fuel to the evolving fire.
What are glial cells? The easy answer is astrocytes and oligodendrocytes. The former cells make glial fibrillary acidic protein (GFAP), whereas the latter make myelin. However, these distinctions blur under close inspection. Glial cells, like many cells in the brain, begin life around the ventricle in the subventricular zone or germinal matrix. They tend to birth after neurons, although this is not rigid. Anatomically distant glial and neural cells can be clonally related to each other. After their final mitosis, these subventricular cells migrate along varying paths to their final destination. Migration remains a primitive trait of glia and is a feature that renders their corresponding tumors incompletely resectable. The astrocyte has many functions within the cell. Its processes act as an outer boundary for the brain, forming the glia limitans at the pial surface (Figure 6-1). They also envelop small vessels in the parenchyma and contribute to the blood brain barrier formation (Figure 6-1). Increasingly, astrocytes are thought to help regulate neurons, their synapses, and their axonal conduction (Figure 6-1). In neoplasia, gliomas selectively migrate along the pial surface, around blood vessels, and along axonal tracts. Some gliomas, notably oligodendrogliomas, show strong neuronal satellitosis. These features are common to normal and neoplastic glia.
Although controversial, gliomas most likely arise from precursor cells that have retained or re-express some primitive traits, including the ability to reproduce and migrate. No intrinsic glioma cell has the fully differentiated features of either an astrocyte or a myelin-producing oligodendrocyte. Recently described stem cells in the brain have at least some astrocytic phenotype, including expression of GFAP. In some models, this astroglial phenotype represents a ground state for cells in the brain. Analogously, most gliomas exhibit some expression of GFAP. More poorly differentiated or malignant gliomas express other primitive markers, such as the intermediate filament vimentin. What distinguishes a glioma cell from a stem cell is its loss of normal, regulated replication and its decreasing ability to correct damage to DNA. Neoplastic glial cells replicate and can slowly accumulate mutations. Most low-grade infiltrating gliomas eventually transform into more aggressive tumors. Primitive features, once silent, reawaken and allow neoplastic glia to express matrix metalloproteases, motility proteins, and surface receptors that enable the cells to widely infiltrate brain.
The morphology of neoplastic cells derives from their failure to normally regulate protein expression and DNA replication. Abnormal DNA duplication leads to aneuploid cells having extra nucleic acid. Centers of highly transcribed genes manifest as darker regions within the darkened nucleus. These features combine to produce the coarse chromatin pattern characteristic of high-grade neoplasms. Neoplastic transformation also diminishes the refined feedback loops that normally balance protein
expression, which necessarily alters a cell’s intricate cytoskeletal network. Neoplastic astrocytes, with their originally fine, fibrillary processes, can no longer sustain these thin, lengthy extensions. In a smear preparation, neoplastic astrocytes typically have shorter, thicker, stumpy processes (Figure 6-2). They often fail to adequately transport their intermediate filaments (e.g., GFAP) to the distal processes; instead these proteins accumulate in heaps around the nucleus and form gemistocytes, which are a common feature in some higher-grade gliomas. A cell’s largest organelle, the nucleus, normally maintains an oval shape and smooth border using an elaborate cytoskeletal and nuclear network of proteins. Their deregulation in neoplasia produces the dented, irregular, or convoluted nuclei common to high-grade gliomas (Figure 6-2).
expression, which necessarily alters a cell’s intricate cytoskeletal network. Neoplastic astrocytes, with their originally fine, fibrillary processes, can no longer sustain these thin, lengthy extensions. In a smear preparation, neoplastic astrocytes typically have shorter, thicker, stumpy processes (Figure 6-2). They often fail to adequately transport their intermediate filaments (e.g., GFAP) to the distal processes; instead these proteins accumulate in heaps around the nucleus and form gemistocytes, which are a common feature in some higher-grade gliomas. A cell’s largest organelle, the nucleus, normally maintains an oval shape and smooth border using an elaborate cytoskeletal and nuclear network of proteins. Their deregulation in neoplasia produces the dented, irregular, or convoluted nuclei common to high-grade gliomas (Figure 6-2).
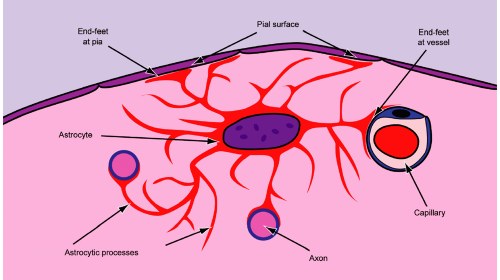 FIGURE 6-1. Normal astrocyte. Normal astrocytes insinuate their processes throughout the brain parenchymal, acting like structural glue that holds the brain together. Astrocytic processes anchor the brain surface as the glial limitans, they bind to small vessels and contribute to the blood-brain-barrier induction, and they support the nodes of Ranvier in axons. Astrocytes also support synapses and the metabolism of neurons. |
Intraoperative Evaluation of Intrinsic Brain Tumors
Smears reach their zenith during the intraoperative evaluation of intrinsic brain tumors. To be of maximum utility and accuracy, the examination of the intraoperative smear requires clinical data and neuroimaging. The tumor grade assessed in a cytological preparation should correlate with the apparent tumor grade on imaging and by history. Younger patients tend to have lower-grade gliomas, including oligodendrogliomas. A cutoff age range of 35 to 45 years roughly divides patients with lower- and higher-grade gliomas, although the tails of their distributions are quite wide. Patients with a long history of neurologic symptoms also tend to have lower-grade tumors. Always take another, closer look at an apparently high-grade smear in a 30-year-old with a long history of epilepsy. Are those anaplastic cells really dysplastic neurons of a heterotopia? On the flip side, always question an apparently low-grade smear in an elderly patient (someone older than yourself) with a new onset of seizures. Perhaps you are looking at the reactive edge of a metastasis or the infiltrating border of a glioma.
Evaluation of neuroimaging is critical in assessing an intraoperative smear. The two most useful scans for the pathologist are the fluid-attenuated inversion recovery (FLAIR) magnetic resonance imaging MRI (or T2-weighted scans if the FLAIR is unavailable) and an enhanced scan.
In bread-and-butter gliomas, enhancement is bad and ring enhancement is worse. A high-grade smear should come from an enhancing tumor and an enhancing tumor should give a high-grade smear. If these two do not match, something is wrong. The biopsy could be near but not in the diagnostic or highest-grade region. Alternatively, the tumor might not be a bread-and-butter variety, such as a pilocytic astrocytoma. The scans and the smears should always correlate.
In bread-and-butter gliomas, enhancement is bad and ring enhancement is worse. A high-grade smear should come from an enhancing tumor and an enhancing tumor should give a high-grade smear. If these two do not match, something is wrong. The biopsy could be near but not in the diagnostic or highest-grade region. Alternatively, the tumor might not be a bread-and-butter variety, such as a pilocytic astrocytoma. The scans and the smears should always correlate.
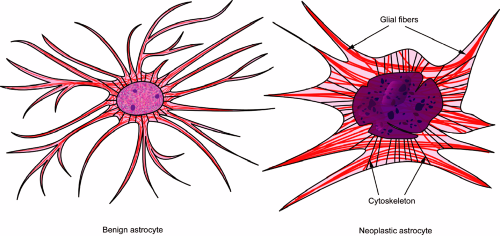 FIGURE 6-2. Benign versus neoplastic astrocyte. In the neoplastic cell, regulation of protein synthesis, including normal homeostatic mechanisms, becomes dysfunctional. Cytoskeletal and nuclear structural proteins that determine the cell shape become disarranged, leading to abnormal nuclear conformations and bizarre cell shapes. Although neoplastic astrocytes retain some ability to “react,” the development is incomplete, which leads to shortened, thickened radiations, thickened glial strands, and distorted shapes. These cells lack the fine fibrillary fibers and delicate, radiating processes of a normal astrocyte. |
FLAIR images reveal the extent of the tumor. An enhancing tumor in the right frontal lobe that has T2 signal extending across the corpus callosum is most likely an infiltrating or “butterfly” glioma. If the signal travels down the internal capsule and into the midbrain peduncles, the tumor must be a glioma.
In imaging, be alert for cystic tumors. Many of the “good,” low-grade, uncommon, or childhood brain tumors often have a cystic component and enhance. These include pilocytic astrocytoma, pleomorphic xanthoastrocytoma, and ganglion cell tumors. At least consider these entities when you examine a smear from a younger patient with a cystic tumor (see Chapters 7 and 8).
Imaging not only gives the signal characteristics of the tumor but also reveals its location (Figure 6-3). Like real estate, the mantra of neuropathology is: “Location, location, location.” Does the location correlate with the clinical history or examination? A right-sided partial seizure would be associated with a left cortical tumor near the motor strip but not a cerebellar tumor. Site is important because different regions of the brain have their own tumors (see Appendix). Is the tumor in the frontal or parietal white matter? Think astrocytoma or glioblastoma. The temporal lobes in younger patients can develop unusual tumors (e.g., gangliogliomas). Does the tumor extensively involve cerebral cortex? Suspect an oligodendroglioma. Cerebellar tumor? Think metastases or hemangioblastoma in older patients and pilocytic astrocytoma or medulloblastomas in younger patients. Deep-seated or brainstem tumors are often astrocytomas or metastases. Ependymomas logically arise in the spinal cord or near the ventricles.
Although smears from gliomas display a wide range of appearances, they should all have two connected features: glial strands attached to neoplastic nuclei. Most injuries to the brain will produce copious astroglial processes. Obviously, tumors will have neoplastic nuclei. These two features must be connected for a diagnosis of glioma.
The history of neuropathology has its share of fables; the classification of brain tumors is no different. Not too many years ago, oligodendrogliomas were rare tumors having round nuclei and perinuclear halos. Necrosis implied
glioblastoma. Today, we know those halos are a fixation artifact. Oligodendrogliomas are much more frequently diagnosed than in the past. Finally, the World Health Organization (WHO) recognizes necrosis in tumors other than glioblastoma. As newer genetic data become available, anticipate additional changes in tumor classification. However, recognize that gliomas are dynamic tumors. Their appearance can change dramatically, even in the same tumor. Tumors growing freely in the subarachnoid space are different from infiltration and growth in gray matter, which also differs from proliferation in white matter, which differs yet again from unhindered growth in the ventricular system. Gliomas proliferating in these different regions must have different gene and protein expression patterns, even by the same clonal expansion of cells. Most neuropathologists, looking at a glioma under the microscope, know what a tumor is, even if they are uncertain exactly how to classify it.
glioblastoma. Today, we know those halos are a fixation artifact. Oligodendrogliomas are much more frequently diagnosed than in the past. Finally, the World Health Organization (WHO) recognizes necrosis in tumors other than glioblastoma. As newer genetic data become available, anticipate additional changes in tumor classification. However, recognize that gliomas are dynamic tumors. Their appearance can change dramatically, even in the same tumor. Tumors growing freely in the subarachnoid space are different from infiltration and growth in gray matter, which also differs from proliferation in white matter, which differs yet again from unhindered growth in the ventricular system. Gliomas proliferating in these different regions must have different gene and protein expression patterns, even by the same clonal expansion of cells. Most neuropathologists, looking at a glioma under the microscope, know what a tumor is, even if they are uncertain exactly how to classify it.
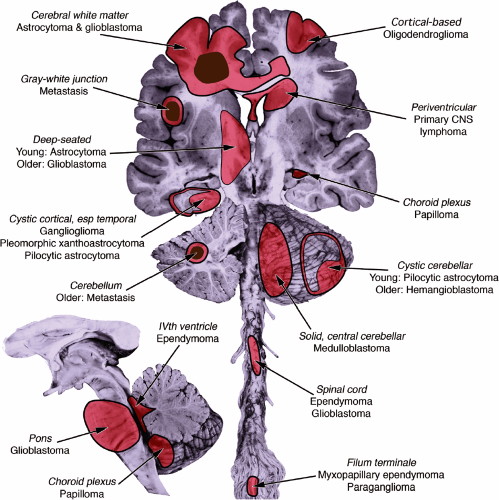 FIGURE 6-3. Location of important brain tumors. The figure shows a stylized dissection of the central nervous system. Major intrinsic tumors are red, central necrotic areas are brown, and central cystic areas are clear. |
What follows is a description of smears from mostly classic gliomas but also some more complex tumors.
Astrocytoma
Despite representing an entire class of tumors, grade II astrocytomas (as designated by the WHO) are uncommon gliomas. In an adult hospital, they remain much less frequent than their higher-grade relatives, the anaplastic
astrocytomas and glioblastomas. These tumors typically occur in a younger population, have a longer period of symptoms prior to diagnosis, and grow more slowly than high-grade equivalents. Patients can have a long history of seizures or “spells.” In adults, they overwhelmingly occur in the cerebral hemispheric white matter, whereas in children they frequently may develop more caudally in the thalamus, brainstem, or spinal cord.
astrocytomas and glioblastomas. These tumors typically occur in a younger population, have a longer period of symptoms prior to diagnosis, and grow more slowly than high-grade equivalents. Patients can have a long history of seizures or “spells.” In adults, they overwhelmingly occur in the cerebral hemispheric white matter, whereas in children they frequently may develop more caudally in the thalamus, brainstem, or spinal cord.
Because they proliferate only slowly, astrocytomas have ample time to spread out and infiltrate surrounding brain. In some cases, infiltration is so extensive that it obscures the origin, giving the impression that the entire cerebrum is afflicted—a condition termed gliomatosis cerebri. Aside from expanding the tissue, these tumors do not greatly alter their local neighborhoods. Blood vessels retain their normal structure, so the tumors do not enhance during neuroimaging. They do increase the water content of the involved tissue, which produces elevated T2 signal or FLAIR intensity on MRI (Figure 6-4).
As might be surmised by knowing that low-grade astrocytomas grow slowly and infiltrate widely, interpreting an intraoperative smear, frozen section, or sometimes even paraffin-embedded sections can be unnerving; it is art more than science. The difficulty lies in distinguishing neoplasia from reactive gliosis. A biopsy from a brain that has seen x-rays—say from prior radiation therapy for a face, skull, or scalp tumor—can be impossible to reliably distinguish from grade II astrocytoma.
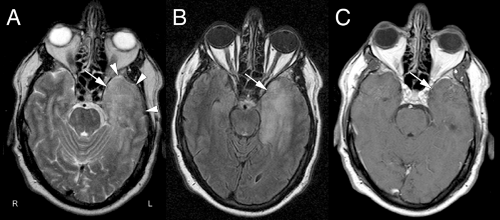 FIGURE 6-4. MRI scans of diffusely infiltrating astrocytoma. A. The T2-weighted image shows increased signal in the left temporal lobe. Compared to the right side, the left lacks crisp gyri and sulci and generally appears full. B. Tumor infiltrates though nearly have the brain length in the FLAIR image. C. This same region fails to enhance after gadolinium administration. |
For low-grade gliomas, like most analyses in pathology, contrasting pathologic tissue with controls yields the greatest information. To the eye, a brain biopsy (even a stereotactic biopsy) can have several distinct tissue types. Sampling all of these regions in a smear allows them to be directly compared in the same preparation. Zones more dense with tumor will contrast with infiltrative regions containing few neoplastic cells (Figure 6-5).
Grade II astrocytomas rarely form solid masses of cells; instead they variably infiltrate surrounding brain. At an intermediate magnification, a smear of more involved tissue will show a greater cellularity and larger nuclei than in less infiltrated parenchyma. Perhaps just as informative is the greater cellular uniformity in more densely infiltrated regions, compared to the normal cellular heterogeneity in regular brain. As mentioned above, neoplastic cells lose some ability to undergo reactive changes. Thus, the less involved tissue will display finer processes than the denser tumor zones (compare panels A and B in Figure 6-6).
Biopsies taken from primarily infiltrative tumors contain both neoplastic and normal cells. At high power, more “normal” tissue will have scattered neoplastic astroglial cells (Figure 6-7A, arrows) and more solid tumor will retain some small, benign nuclei (Figure 6-7B). In a less involved section, pointing to any single nucleus and declaring, “A-ha, a tumor cell!” is an exercise in uncertainty. Only by analyzing the population of cells—including their density, size, basophilia, and matrix—can
you conclude you have tumor-infiltrated tissue. In regions of denser tumor, the nuclei are larger, darker, and more monomorphic. Processes are less abundant, stumpy, and clumps of eosinophilic protein (GFAP) gather around the nucleus (Figure 6-7B). You can only guess that a single cell is neoplastic; you can be certain with a population.
you conclude you have tumor-infiltrated tissue. In regions of denser tumor, the nuclei are larger, darker, and more monomorphic. Processes are less abundant, stumpy, and clumps of eosinophilic protein (GFAP) gather around the nucleus (Figure 6-7B). You can only guess that a single cell is neoplastic; you can be certain with a population.
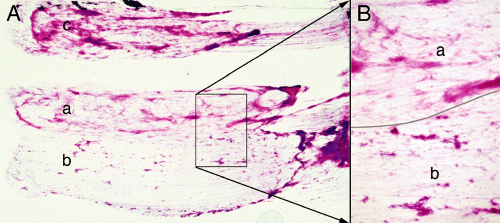 FIGURE 6-5. Astrocytoma smears at low power. The biopsy was from the tumor illustrated in Figure 6-4. A. On gross examination, the tissue had three slightly different color shades. A tiny sample of each (a, b, c) was used to prepare this smear. B. Compared to sample a, sample b contained more solid tumor (tissue separated by line). |
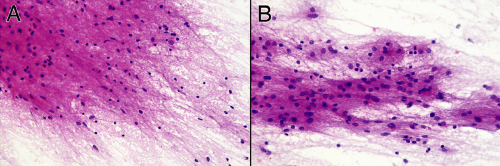 FIGURE 6-6. Lower-magnification comparison of the reactive (A) and neoplastic (B) components from the smear in Figure 6-5. These photomicrographs were taken at the same magnification. The cellularity and uniformity is greater in B than in A. Evident when viewed side-by-side is the increased nuclear size of the neoplastic astrocytes in B compared with the mostly reactive astrocytes and oligodendroglia in A. |
Tumors are mosaics of cloned cells derived from a single, bad precursor. Although they might be pleomorphic, anaplastic, or downright bizarre, they all tend to have a common set of traits. Our eye picks up these traits and allows us to see the tumor cells as somehow uniform, like children from the same parents. They all look relatively the same when compared with endothelial cells, neurons, normal oligodendroglia, or lymphocytes, for example. In essence, wildly anaplastic tumors are uniformly pleomorphic. This uniformity of a cellular population helps to distinguish a tumor from the more heterogeneous cells in normal tissue or a reactive process.
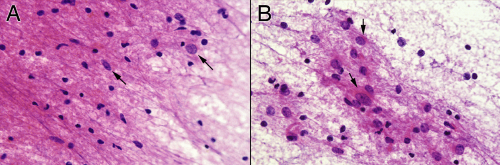 FIGURE 6-7. Higher-magnification comparison of the reactive (A) versus neoplastic (B) components from the smear in Figure 6-5. Notice the increased glial background in A compared to B, as well as the smaller nuclear size in most of the cells. Based on their nuclear features and size, occasional, probably neoplastic astrocytes have infiltrated this reactive edge of the tumor (A, arrows). Some of the neoplastic nuclei have perinuclear or elongated glial processes (B, arrows). These tend to be less plentiful, thicker, and more irregular than those of reactive astrocytes. |
The cytological changes of astrocytomas recapitulate the processes that transformed the precursor cell (Figure 6-8). These cells belong to clones or subclones of the original and hence display the uniformity mentioned previously. Transformation requires a degree of deregulated gene expression. A cell’s prior balanced and regulated metabolism, protein synthesis, and structure all shift as the tissue selects “advantageous” tumor mutations. Greater transcription produces a larger nucleus with increased histones and hyperchromasia. Multiple sites of increased transcription give nuclei a coarser chromatin pattern. Cellular and nuclear skeletal elements fall into disrepair, which leads to a loss in the normally smooth nuclear border (Figure 6-8B, arrow). Nuclear folds, cleaves, and dents become more common with increasing grade. The astroglial precursor, which previously expressed GFAP and a few other cytoskeletal intermediate filaments, can continue to express them but fail to adequately regulate them. Rather than transporting these structural proteins to the furthest reaches of the cells processes, they remain close to the nucleus. Thickened glial strands and clumps of GFAP are common in astrocytomas (Figure 6-8A,
arrow). In these infiltrating tumors, even apparently solid areas of tumor can have scattered nonneoplastic host cells (Figure 6-8B, arrowheads).
arrow). In these infiltrating tumors, even apparently solid areas of tumor can have scattered nonneoplastic host cells (Figure 6-8B, arrowheads).
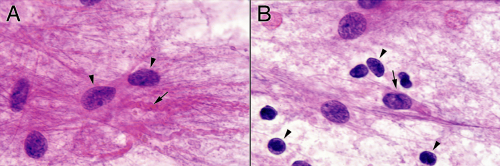 FIGURE 6-8. Oil-immersion view of neoplastic astrocytes. A. Neoplastic astrocytes (arrowheads) have slightly elongated nuclei with open chromatin. Some glial processes are thick and stubby (arrow). B. Less dense area shows some benign cells (arrowheads) intermixed with the larger neoplastic astrocytes. Neoplastic astrocytes begin to lose their ability to maintain their shape, including their smooth nuclear border. As the grade increases the borders tend to become more folded or convoluted (arrow). |
A permanent section gives a different set of data about an astrocytoma. By the very nature of a smear preparation, the tissue thickness will vary across the slide. Determining a biopsy’s cellularity in a smear is inherently more difficult and subjective than in a section. Assessing the cellularity of a glioma in a smear entails judging the frequency of nuclei compared to the density of the background matrix. A thick matrix with few nuclei indicates hypocellular tissue, and vice versa. No such subjectivity besets a permanent section. This single feature explains why pathologists continue to ruin good tissue preparing intraoperative frozen sections. A reasonably standard slice of paraffin-embedded tissue allows for easy comparison between a tumor’s cellularity and that of its surrounding tissue. In a simplistic view, a low-grade astrocytoma can be distinguished from normal brain because the former has too many cells (Figure 6-9). Other features, such as nuclear size and hyperchromasia, will also be apparent in permanent sections (Figure 6-9). The main advantage of permanent sections is not shared completely with frozen sections. The thickness in these small, squished, ice-artifact ridden fragments of tissue can vary widely. The nature of the cells in the tissue—whether gliomas, reactive astrocytes, or inflammatory cells—can also be lost in artifacts of a frozen section. Finally, previously frozen tissue gives poor permanent sections. Optimal evaluation of a glioma should include determining its cellularity on a permanent section and examining its cytological features in an intraoperative smear.
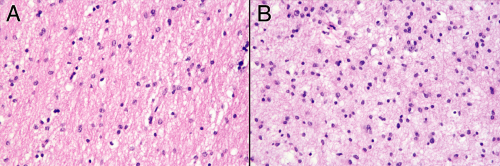 FIGURE 6-9. Permanent sections of a grade II astrocytoma. A. Relatively normal tissue. B. Neoplastic component. Because permanent sections are bereft of the cytological finesse of a smear, identifying any single cell as neoplastic remains challenging. The population as a whole is what defines a sample as an astrocytoma. Cells in B are a bit darker and larger than in A. Most importantly, the overall cellularity and uniformity of B are the principle criteria that define it as a glioma. |
The preceding discussion has utilized the comparison of an astrocytoma with its surrounding tissue. Small biopsies from predominantly infiltrative tumors or gliomatosis cerebri will lack contrasting tissues. Neoplastic cells in such tumors creep widely along white matter tracts (Figure 6-10). Like planets dancing across the starry sky, the infiltrating tumor cells can represent only a fraction of the total cellularity on the slide. The bad cells will be in a milieu of normal oligodendrocytes and some reactive but benign astrocytes. Even with smear and permanent sections, evaluating these tumors and distinguishing them from either normal brain or a reactive process remains challenging.
The intraoperative smears from gliomatosis-type tumors shows an increased cellularity relative to the matrix elements. Assess its cellularity by looking near the edge of the smeared tissue at its thinnest region (Figure 6-11A). Although a biopsy from a purely reactive brain will be more cellular than normal, its glial component usually has less cells that that of gliomatosis (although its nonglial cellularity, including macrophages and lymphocytes, can be quite high). Gliomatosis cerebri cells infiltrate widely. As they creep along white matter tracks or within the subpial spaces, their bodies stretch out and elongate their nuclei. Unlike the round nuclei nearly devoid of glial processes that characterize an oligodendroglioma, the nuclei of a highly infiltrative astrocytoma will reflect their biology and will generally be fusiform (Figure 6-11B). The monotony of cells in more solid tumors is lost in gliomatosis; many normal or reactive cellular elements will contaminate the available tissue.
On permanent sections, these tumors have the “too-many-cells” feature of all infiltrating gliomas (Figure 6-12A).
Distinguishing neoplastic from surrounding cells remains difficult, because processing the tissue makes their cytological features indistinguishable from normal artifacts. However, some of the nuclei can be more elongated than the typical oval shape of normal astrocytes, giving a hint that they are the neoplastic forms (Figure 6-12B). Beware, however, of microglia: they too have fusiform nuclei. Look at the context of the cells for help.
Distinguishing neoplastic from surrounding cells remains difficult, because processing the tissue makes their cytological features indistinguishable from normal artifacts. However, some of the nuclei can be more elongated than the typical oval shape of normal astrocytes, giving a hint that they are the neoplastic forms (Figure 6-12B). Beware, however, of microglia: they too have fusiform nuclei. Look at the context of the cells for help.
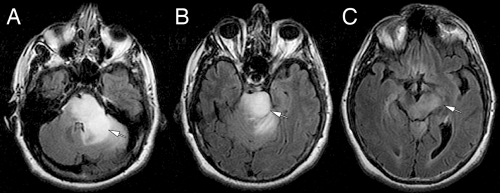 FIGURE 6-10. FLAIR MRI from diffusely infiltrating astrocytoma. This older man has a nonenhancing mass involving his left cerebral peduncle (A, white arrow), left basis pontis (B, white arrow), and extending up the corticobulbar tracts in the left cerebral peduncle of the midbrain (C, white arrow). |
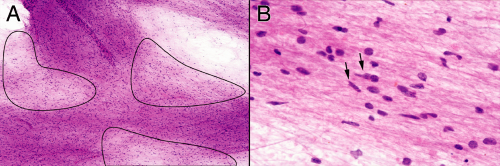 FIGURE 6-11. Infiltrating astrocytoma smear prepared from the patient shown in Figure 6-10. A. Lower-magnification view illustrating the variation in thickness of the smear. The circled regions are the thinnest and give some idea of the cellularity of the tissue, at least in comparison with the thickness of the matrix. B. Several different cell types, including those with round nuclei and those with more elongated nuclei. The latter population better characterizes a diffusely infiltrating glioma, although they would be difficult to distinguish from microglia. |
The differential diagnoses for an infiltrating astrocytoma include the spectrum from benign reactive processes to more malignant anaplastic astrocytomas. On simple histologic sections alone, especially on a small biopsy, the diffusely infiltrating tumors form almost a continuum with reactive processes. The most reliable core criterion to distinguish these two processes is the more atypical but uniform population of nuclei in a glioma, which reflects a diminution of discipline over the cell’s structural proteins. Smears excel at revealing the fine structure of nuclei under a microscope. Again, it is the population and not a single cell that must be evaluated. Many lesions in the
brain leave an occasional bizarre or otherwise frightening cell in a sea of bland companions. A single anaplastic cell does not make a glioma. On the other end of the spectrum from reactive processes are higher-grade gliomas. However, distinguishing a grade II from a grade III astrocytoma is not required of an intraoperative evaluation. Frozen sections with their many artifacts and smears with their shearing forces are insensitive methods to look for the mitotic figures necessary to diagnose an anaplastic astrocytoma.
brain leave an occasional bizarre or otherwise frightening cell in a sea of bland companions. A single anaplastic cell does not make a glioma. On the other end of the spectrum from reactive processes are higher-grade gliomas. However, distinguishing a grade II from a grade III astrocytoma is not required of an intraoperative evaluation. Frozen sections with their many artifacts and smears with their shearing forces are insensitive methods to look for the mitotic figures necessary to diagnose an anaplastic astrocytoma.
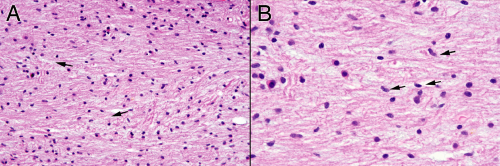 FIGURE 6-12. Infiltrating astrocytoma permanent sections. A. Section is too cellular for normal brain. Some matrix alterations include the eosinophilic glial strands that indicate axonal direction and the slight myxoid degenerative changes (arrows). B. At higher magnification, the hypercellularity is in part due to cells with more elongated or fusiform nuclei (arrows). It is these cells that stretch over vast regions of brain, especially along white matter tracts. |
Anaplastic Astrocytoma and Glioblastoma Multiforme (High-Grade Glioma)
The WHO distinguishes two high-grade fibrillary astrocytomas: anaplastic astrocytoma (grade III) and glioblastoma (grade IV). Nature does not suffer these categories. In paraffin sections and especially on smears, these tumors show an entire continuum of features from low to high grade, including greater nuclear pleomorphism, coarser chromatin, thickened glial processes, increased frequency of mitotic figures, and vascular changes leading to vascular hyperplasia (“vascular proliferation”) and its associated necrosis. However, tumor grading and therapies require slicing this continuum into small, workable groups using a somewhat arbitrary but reproducible set of criteria. In the following analysis, the anaplastic astrocytomas and glioblastomas are considered together because they share many features and the former invariably progresses to the latter.
The biology of high-grade astrocytomas includes all of the growth features of their low-grade analogs, including infiltration along white matter tracts and in subpial regions. Two main characteristics distinguish them from low-grade tumors: rapid proliferation and induction of abnormal vessel formation. As the growth rate of gliomas increase, their clones have relatively less time to disperse into the surrounding brain. They thus form more solid, expansile masses rather than purely infiltrative tumors. Such rapidly growing tumors arise from at least two scenarios: either de novo or from the progressive transformation of lower-grade progenitors. Because either the tumor secretes excessive or unbalanced vascular growth factors or, compared to normal brain, the tumor’s extracellular matrix is not conducive to new vessel formation, high-grade gliomas induce abnormal vessels. Early in the process, endothelial cells either lose or fail to make their normal tight junctions. Although not apparent histologically, the increased permeability of these modified endothelial cells to contrast agents provides the major radiological hallmark of high-grade gliomas: enhancement (Figure 6-13). Later, as vessels fail to form properly, they thicken, develop plump activated endothelial cells, and sheathe themselves in additional layers of ill-formed cells that resemble a cross among endothelial, smooth muscle, and perhaps myofibroblasts. In the final stages of abnormal vessel formation, they produce multiple small knots of channels resembling renal glomeruli (“glomeruloid” proliferation). Abnormal vessels easily undergo thrombosis and infarct surrounding tissue. The consequential hypoxia-induced signals in turn lead to further vascular proliferation, thus establishing a cycle of pathologic vessel formation.
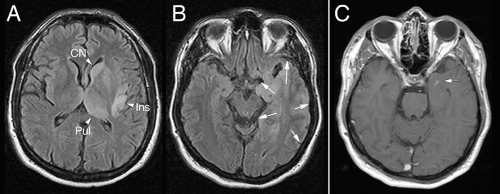 FIGURE 6-13. MRI imaging of an anaplastic astrocytoma. A. Subtle increase in T2-signal (FLAIR sequence) is present in the left caudate nucleus (CN), pulvinar (Pul), and insula (Ins). B. More caudally, the entire left temporal lobe is slightly expanded with signal (arrows). C. Although most of these features would be compatible with a grade II astrocytoma, the tumor enhanced in a small region (arrow) and on biopsy was a high-grade astrocytoma. |
MRI scans illuminate three core features of high-grade gliomas: location, growth pattern, and enhancement. In older adults, glioblastomas occur primarily in the telencephalic white matter (Figures 6-3, 6-14, 6-16, and 6-17). In children and young adults, high-grade astrocytomas also arise in the pons and its middle cerebellar peduncles. In the spinal cord, these tumors are more common in a younger population. Similar tumors are distinctly uncommon in the cerebellar hemispheres. These sites are guidelines rather than rules because pontine gliomas can develop in older adults (Figure 6-15) and infants can die from hemispheric glioblastomas.
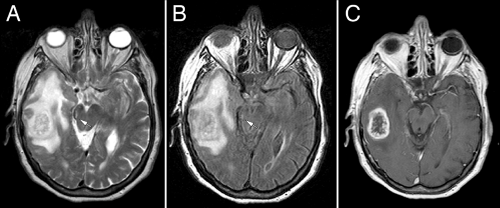 FIGURE 6-14. MRI scans of a glioblastoma. The T2-weighted (A) and FLAIR (B) images display similar features. Anatomic detail is greater in the T2 image but is partially confounded by free water. The enhancing portion of the tumor (C) represents only a fraction of the entire neoplasm. Although an increased T2-signal is not specific for a glioma, in this setting the extent of the signal most likely closely maps out the distribution of tumor infiltration. Note the increased T2 signal in the right cerebral peduncle (white arrows), which reflects tumor infiltration caudally along the temporal-bulbar fiber tracts. |
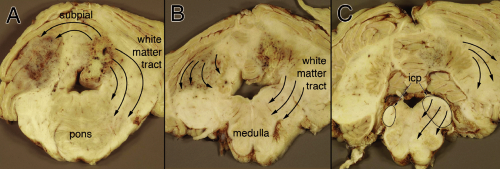 FIGURE 6-15. Infiltration of glioblastoma in sequential caudal cross-sections. The patient was an 84-year-old older woman who had the unusual presentation of a glioblastoma arising in a cerebellar peduncle. A. From the speckled area, the tumor cells spread out within subpial and subarachnoid conduits onto the contralateral surface of the cerebellum. As it crept along white matter tracts, it expanded the middle cerebellar peduncle and the base of the pons. B. Astroglial cells continued to migrate down through the inferior cerebellar peduncle into the medulla. C. Compared to the uninvolved side, the infiltrated inferior cerebellar peduncle (icp) and the involved side of the medulla and cerebellar white matter were greatly expanded. The speckled zone reflects abnormal vessel growth, which would have enhanced, whereas the infiltrated white matter would have been bright with T2-weighting. |
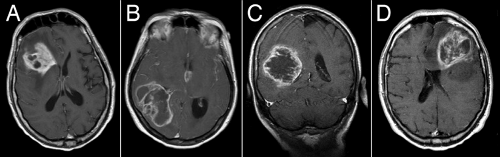 FIGURE 6-16. Spectrum of rim enhancement in glioblastoma. Probably all glioblastomas pass through a period in which they solidly enhance. As the tumors “outgrow” their vascular supply, or more appropriately fail to induce sufficient well-formed vessels, they undergo central necrosis and leave a rim of enhancement. A. Early on, the rim can be thick. B. Later, the border of enhancement can become thin and ragged. Note the additional enhancement in the midline, within infiltrated fornix. Enhancement in a glioblastoma typically displays an intricate pattern of interior enhancement (B and C), including fingers of contrast extending inward from the ring. C. Fuzziness or glow usually invests at least part of the edge. D. In an elderly patient who may have already suffered some cognitive decline, a glioblastoma within the frontal lobe may become huge and show complicated enhancement before the patient comes to medical attention. |
T2-weighted scans, including FLAIR sequences, yield the greatest information about the pattern of glioma growth and infiltration. Brain tissue infiltrated by tumor has increased water and is brighter when weighted for T2 signals. Although such weighting will not detect every isolated, distant cell, its signal is quite sensitive to significant infiltration. The T2-bright areas always expand further into brain than the enhancement (Figure 6-14). Its patterns reflect the tumor’s ease in traveling along white matter tracts and difficulty in penetrating gray matter


Related posts:

Stay updated, free articles. Join our Telegram channel
Full access? Get Clinical Tree
