Meta-analysis of OCT studies in MS patients who did suffer from MSON. The overall averaged RNFL data (mean ±SD) and number of MSON-eyes investigated are shown for patients and normal subjects. To the right are the data expressed as micron difference in RNFL thickness of eyes that had optic neuritis compared to normal eyes; the length of the horizontal bar is the 95% confidence interval for each study.
Importantly, as discussed by Andrew Henderson in Chapter 4 and Fiona Costello in Chapter 5, there are a number of other pathologies to be considered which can mimic MSON(see Table 5.2). Particularly severe RNFL loss, frequently combined with microcystic macular edema (MMO), is seen following neuromyelitis optica (NMO) and chronic relapsing inflammatory optic neuropathy (CRION) [6, 15, 33, 46]. Therefore, an important limitation of these studies is that information on previous episodes of optic neuritis was frequently sought retrospectively. In the absence of an international consensus on how to investigate patients with suspected optic neuritis, it is probable that the studies pooled for this meta-analysis were rather heterogeneous.
OCT in MS-eyes, never MSON
Sixteen studies investigated the RNFL thickness in patients with MS who did not suffer from MSON [1, 3, 11, 12, 17, 18, 21, 23, 37–40, 44, 48, 49]. Data were sufficiently detailed to permit inclusion into the meta-analysis from 15 of these studies [1, 3, 11, 12, 17, 21, 23, 38–40, 44, 48, 49]. In total 3,154 eyes were investigated.
Figure 9.2 illustrates that the estimated average RNFL loss in MS-eyes was only about a third (–7.08 μm, [–8.65, –5.52]) compared to what was seen for MSON (–20.38 μm [–22.86, –17.91]). In other words, the presumed healthy eyes of patients with MS had lost approximately a tenth of their retinal axons. This still substantial amount of unexpected axonal loss will require explanation.
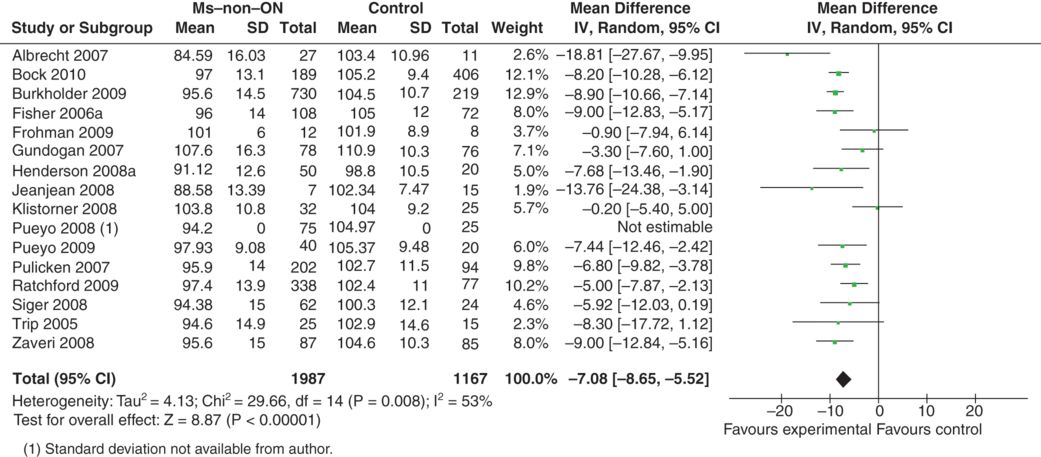
Meta-analysis of OCT studies in MS patients who did not suffer from ON, by history. The overall averaged RNFL (mean ±SD) and number of eyes investigated is shown, similarly to Figure 9.1 Note that the bar graph to the right, which summarizes the difference in RNFL in the asymptomatic eyes compared to normal eyes, shows there is loss of RNFL even in eyes supposedly not suffering from previous optic neuritis.
OCT in MS-eyes with contralateral MSON
The reader may ask at this point if the data presented in the meta-analysis adds up. Can the gap of about 13 μm RNFL thickness between MSON eyes, MS-eyes and control eyes be explained by data derived solely from MS patients? Or may an inclusion or selection bias have been introduced on a group level such that the above two meta-analyses were flawed? To address this question a third meta-analysis was conducted. This time only MS patients with unilateral MSON were included. The OCT data from the MSON-eyes were compared to the data from the presumed unaffected eye from 27 studies [1, 3, 5, 7–9, 11–13, 16, 23, 25–27, 30, 31, 38–44, 46, 47, 49]. In total, data from 4,199 eyes were included into the meta-analysis.
Figure 9.3 convincingly corroborates the hypothesis that a history of optic neuritis results in a greater magnitude of axonal loss when compared to MS eyes without such a history. Indeed, the estimated average RNFL loss between MSON-eyes and MS-eyes was close to 13 μm (–13.84 μm [–15.37, –11.72]; please note that, for mathematical reasons and internal consistency, the averaged amount of RNFL loss, “x”, is presented as “–x”).
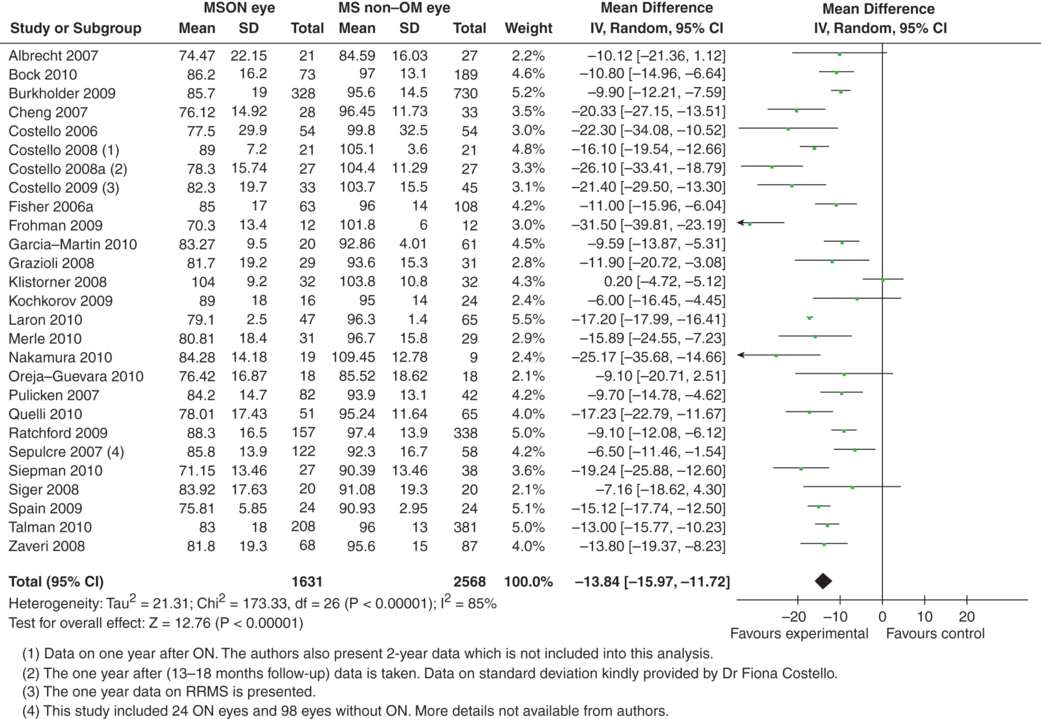
Meta-analysis of OCT studies comparing only MS patients: MSON-eyes and MS-eyes (never affected by MSON). The overall averaged RNFL (mean ±SD) and number of eyes investigated is shown. The difference between the MSON- and MS-eyes shown in this figure is less than the difference between MSON-eyes and normal control eyes Figure 9.1 (note that the scale of the x-axis differs between the two figures).
Taken together, our findings necessarily underscore an important lingering question for the field; why and how does a substantial amount of axonal loss occur in the presumed unaffected eye of a patient suffering from MS? A possible explanation will be presented at the end of the chapter, but first, the likely time course of development of axonal loss in the MS eye is reviewed.
Time course of RNFL loss in MS
As a rule of thumb, RNFL loss becomes readily detectable to OCT about three months after an episode of acute MSON. Earlier detection of the reduction in RNFL thickness from axonal atrophy is difficult to distinguish from a reduction resulting from resolution of axonal swelling, which is common in acute MSON, as discussed by Andrew Henderson and colleagues in Chapter 4 by Fiona Costello in Chapter 5 and Robert Bermel et al in Chapter 17 of this book. Their combined data demonstrates that about 99% of axonal loss will occur within four to six following MSON.
A correlation between disease duration and the averaged overall RNFL was found by some [11, 37, 44] but not by others [18, 23] included in the meta-analysis (Figure 9.2). The divergent results may in part be explained by the variation in average disease duration and a bias in the population of MS patients studied. A meta-analysis of the published cross-sectional data remains statistically questionable, but may help to shed light on the presumed association between RNFL loss and disease duration. Clearly, accurate information will need to come from carefully conducted longitudinal studies that are executed by multiple collaborative Center teams.
Time in MS-eyes with contralateral MSON
A graph of cross-sectional data analysis illustrates that the average RNFL thickness in the unaffected eye (MS-eye) approaches ≈80 μm (which is about what is seen within one year following MSON) after about 20 years (Figure 9.4). Taking away the effect of normal ageing (about 2 μm per decade [4]), leaves a considerable amount of axonal loss of an estimated 7–9 μm per decade of MS disease duration.
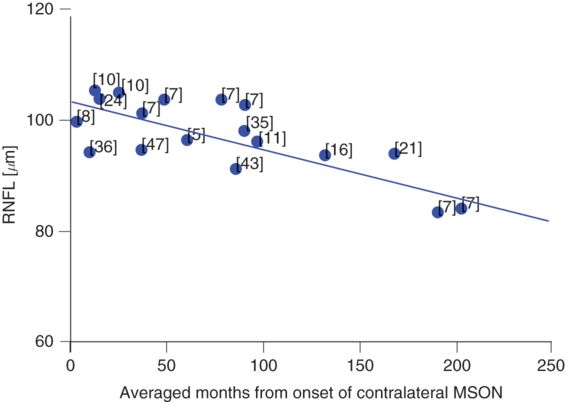
Cross-sectional, averaged longitudinal RNFL changes in the unaffected eye of MS patients who suffered from MSON (blue dots). The relatively preserved RNFL (thickness ≈ 105 μm) early in the disease may allow detection of subtle loss of retinal axons during the disease course of MS, at least on a group level. The numbers adjacent to the dots indicate the respective references.
Time in MS-eye, never MSON
With the advent of high-speed, high-definition, spectral-domain OCT, we are finally in a position to address one of the remaining and formidably challenging facets of retinal neurodegeneration in MS; to dichotomize MS eyes with a history of MS ON, and MS eyes with no history of MS ON (at least according to the patient and their family). The principal objective of our most recent work has been to delineate the longitudinal impact upon RNFL thickness in patients without a history of MSON. From the three studies we were able to identify [17, 18, 44], a similar picture emerged (Figure 9.5). Conspicuously, when the data is analyzed cross-sectionally, we found that, within about 12 years, thinning of the RNFL is approaching 80 μm. Of course, it is not surprising that there are outliers that collectively, upon analysis, exhibit considerable heterogeneity, with individual MS eyes distributed to either fast, slow, or average axonal degeneration. Pragmatically, the identification of novel protective and/or restorative neurotherapeutic properties would have potentially important treatment implications for the MS retina and optic nerve in particular, and for neurodegenerative disorders in general.
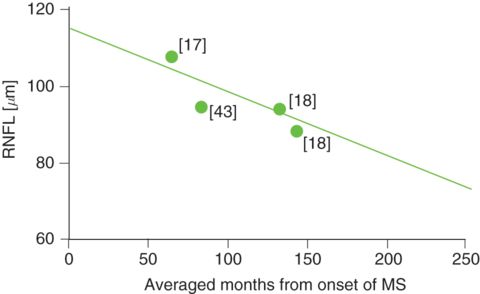
The averaged longitudinal RNFL changes in the eyes of MS patients who never suffered from MSON (green dots) suggests that subtle retinal axonal loss may be a feature of insidious axonal attrition in MS, as proposed by Hoyt et al. [19], at least on a group level. The numbers adjacent to the dots indicate the respective references.
Time in MSON-eyes
Using a similar cross-sectional meta–analysis it can be demonstrated that following the acute axonal loss associated with MSON [7, 8, 10], little progression seems to be detectable thereafter (Figure 9.6). In fact, the RNFL thickness appears to settle around ≈80 μm within the first year. This is consistent with the clinical experience that vision remains relatively stable even many years after MSON and that the disability outcome is relatively good in patients with optic neuritis. The relevant clinical point here is that progressive visual loss following presumed MSON is hardly ever observed and alternative diagnoses need to be considered [35].
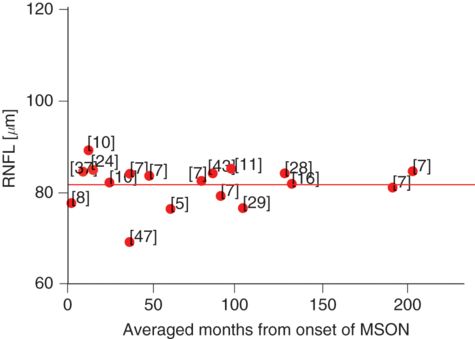
Averaged longitudinal RNFL changes in the eye affected by MSON (red dots). The degree of the damage caused to the RNFL by MSON appears cross-sectionally to be so large (RNFL thickness ≈ 80 μm) that any subtle damage that may be attributed to trans-synaptic axonal degeneration could be masked. The numbers adjacent to the dots indicate the respective references.
One needs to be very careful drawing conclusions on the time course of RNFL loss in an individual eye from cross-sectional meta-analyses of averaged data. Extrapolation from this data is risky because of a possible inclusion bias of patients with early visual problems having OCT and likely exclusion of patients with severe, late progressive MS not included in an observational research study. Nevertheless, the results suggest that, in MS without MSON, there is an estimated yearly thinning of the overall RNFL in the range of ≈ 1–2 μm. Reassuringly, the data from the meta–analysis is consistent with the longitudinal data by Talman and colleagues suggesting a yearly loss of around 1 μm [47].
In this context, it should be highlighted that the current duration of phase II trials in MS is frequently around 4–6 months, thus it is not likely that OCT will provide a reliable outcome over this time scale. From the preceding data, one would expect that MS patients without MSON will require follow-up for at least two years. Again, the reader is referred to the excellent chapters by Andrew Henderson and colleagues (Chapter 4) and Robert Bermel (Chapter 17).
Limitations and pitfalls
Taken together from Evidence for the use of OCT in MS (page 103) and Time course of RNFL loss in MS (page 106) in this Chapter the averaged RNFL loss is largest in MSON-eyes with –20.38 μm, followed by presumably normal MS–eyes of –7.08 μm. In addition, most damage following MSON happens rapidly within 4–12 months following the event. In contrast, in presumably normal MS-eyes, RNFL loss seems to manifest itself at a rate of around 1–2 μm per year. Taken together, these two data sets imply an accelerated rate of axonal degeneration, whereas we have another group that instead exhibits an insidiously slow and steady degeneration attributed to trans-synaptic axonal degeneration. These two presentations (rapid vs slow or retrograde axonal vs trans-synaptic retrograde axonal degeneration), on opposite ends of the injury spectrum (optic nerve vs posterior visual pathways), may be instructive with respect to the application of specific treatment modalities that may be aimed at one set of mechanisms, but not necessarily both.
Importantly, any form of optic neuritis will mask, subtle and slow axonal loss in the eye of patients with MS. Therefore, any study and analysis on a presumed relationship of RNFL loss with pathology or treatment need to carefully distinguish MS-eyes from MSON-eyes.
In the acute phase of MSON, optic disc edema and axonal swelling will mask RNFL thinning. This may considerably limit the prognostic value of OCT in the acute phase. Whether or not MMO, inner nuclear layer thickening and/or periphlebits might be of additional prognostic value remains to be seen and will be discussed in Chapter 4, 10 and 13.
The rate of RNFL loss in MS-eyes is slow. An annual decrease of around 1–2 μm is in the range of the physiological variation in humans seen with a few hours [2]. Larger changes of RNFL thickness measures can be introduced by artifacts related to the method itself. Therefore, rigorous OCT quality control criteria are required to safeguard accuracy and validity of the data. This will be discussed in chapter 18.
Related posts:
 Optical coherence tomography and low-contrast acuity
Introduction to optical coherence tomography in neurological diseases
Future technological advances in optical coherence tomography
Optical coherence tomography in acute optic neuritis
Optical coherence tomography and visual outcomes in acute optic neuritis
Optical coherence tomography in a multi-center setting: quality control issues
Optical coherence tomography and low-contrast acuity
Introduction to optical coherence tomography in neurological diseases
Future technological advances in optical coherence tomography
Optical coherence tomography in acute optic neuritis
Optical coherence tomography and visual outcomes in acute optic neuritis
Optical coherence tomography in a multi-center setting: quality control issues
Stay updated, free articles. Join our Telegram channel

Full access? Get Clinical Tree


