The top-left panel represents an axial MP-RAGE image in which gray–white differentiation is clear. The top-right panel represents an axial FLAIR scan in which MS lesions are obvious. The bottom-left panel represents segmentation of the brain MRI into cortical GM, cerebral WM, deep GM structures, and lesions (all of which are color-coded) by the LESION-TOADS segmentation algorithm. The bottom-right panel depicts the same axial FLAIR scan as located in the top-right panel, but with the lesions identified by the segmentation algorithm (colored red) [72].
Although cortical demyelinating lesions account for a large proportion of all brain lesions in MS (approximately 26–59%) [25, 26], the precise pathophysiologic basis underlying neuronal injury and neuronal loss in MS requires determination. While neuronal loss in MS may be caused by retrograde [13, 15] or anterograde degeneration [14], it remains unclear whether neuronal degeneration may also result from processes independent of demyelination or axonal injury in MS. Prior observations raise the possibility that in some instances the mechanism of GM tissue injury in MS may differ from that of WM tissue injury, and that GM injury may be the derivative of a primary neuronal pathobiology [27, 28]. This contemporary principle should emphasize the inherent potential advantages of assessing brain substructure volumes, such as cortical GM and cerebral WM volumes, rather than just whole-brain volumes in MS. For instance, measures of neurodegeneration derived from differing brain compartments could potentially reflect different pathobiological processes, which are operative in the disease process. Along this same line of reasoning, the emerging role of B-cells in the immunopathogenesis of MS has also lead to the reappraisal of MS as a primarily T-cell mediated disorder, and it is now recognized that antigen-experienced B-cell clones, which are found in lymphoid follicles in the meninges of MS patients, are also found in the brain parenchyma of MS patients [29]. Such findings serve to remind us not only of the complexity but also of the heterogeneity of MS.
Examples of nonconventional MRI techniques for dissecting mechanisms of neurodegeneration in MS include diffusion tensor imaging (DTI), magnetization transfer imaging (MTI), and magnetic resonance spectroscopy (MRS). DTI and MTI are sensitive to microstuctural tissue properties [30]. DTI utilizes information pertaining to the orientation and magnitude of water diffusion within tissue. This provides insight into the integrity of the examined tissue. DTI indices include fractional anisotropy (FA; the extent to which water diffuses along the principal eigen vector divided by the sum of diffusion in all the orthogonal plans), mean diffusivity (MD; an overall measure of water diffusion), perpendicular diffusivity (λ⊥; water diffusion perpendicular to intact axon fibers), and parallel diffusivity (λ∥; water diffusion along or parallel to intact axon fibers). MTI relies on measuring the transfer of longitudinal magnetization between rotationally restricted hydrogen protons within macromolecules (bound to lipids or proteins) and the free water pool. The magnetization transfer ratio (MTR) is, therefore, thought to be more sensitive to myelin than conventional MRI. MRS has emerged as a technique to assess neuronal and axonal damage by measuring the concentration of brain metabolites such as N-acetyl-aspartate (NAA), which is a neuronal marker [31]. Even though nonconventional MRI techniques, such as brain substructure volumetrics, provide measures that may correlate well with disability in MS, and may therefore be informative, performing these techniques can be time-consuming, and they are generally not available in routine clinical practice. Moreover, there are a multitude of factors which may influence these measures, such as inflammation, age, disease modifying therapies, and hydration status. Consequently, there has been a drive to develop alternative techniques, including additional nonconventional MRI techniques, as well as techniques unrelated to MRI for assessing neurodegeneration in vivo in MS.
Optical coherence tomography (OCT) is a high-resolution imaging technique that conventionally enables the quantitative estimation of peripapillary-retinal nerve fiber layer (p-RNFL) thickness, as well as total or average macular thickness (a nonspecific measure of the combined thickness of all of the layers of the retina). OCT is relatively inexpensive, reproducible, easily repeatable, noninvasive, and well tolerated. Recent refinements in OCT technology have led to the powerful and highly precise capability to also automate the segmentation of the distinctive layers comprising the retina in the macular region, for the purpose of investigating the integrity of its architecture in normal subjects, and in those afflicted with disorders that target the visual system such as MS. In particular, modern, high-speed, high-definition, spectral-domain OCT is capable of rendering high-resolution images, from which the individual retinal layers can be discriminated and objectively quantified (Figure 10.2). For instance, the macular-RNFL (m-RNFL), combined ganglion cell layer and inner plexiform layer (GCIP), combined inner nuclear layer and outer plexiform layer (INL), and the outer nuclear layer, including the photoreceptor segments (ONL), can now be segmented with great facility, accuracy, and reproducibility, with highly satisfactory test–retest variability [32–35].
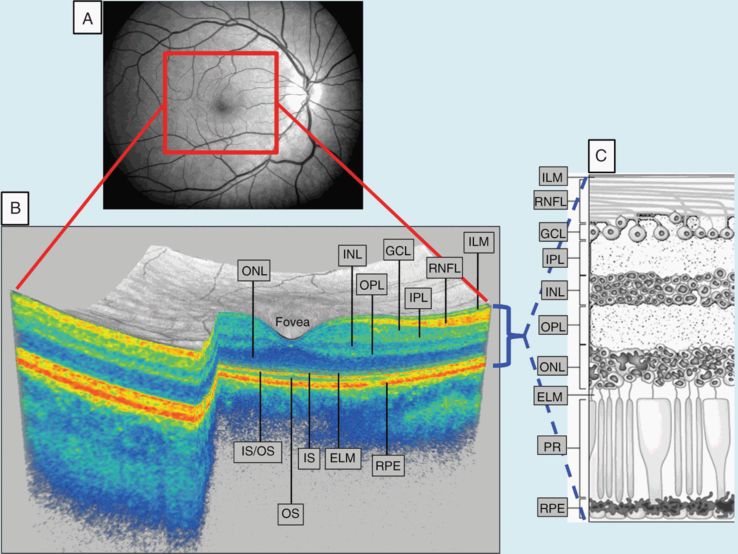
Panel A represents a fundus photograph from a healthy control. Panel B is a 3-D macular volume cube generated by Cirrus HD-OCT from the macular region denoted by the red box from the same healthy control. Note the individual layers of the retina are readily discernible, except for the ganglion cell layer (GCL) and inner plexiform layer (IPL), which are difficult to distinguish. During segmentation of the OCT image, segmentation software identifies the outer boundaries of the macular retinal nerve fiber layer (RNFL), inner plexiform layer (IPL), and outer plexiform layer (OPL), as well as the inner boundary of the retinal pigment epithelium (RPE), which is identified by the conventional Cirrus HD-OCT algorithm. The identification of these boundaries facilitates OCT segmentation, enabling the determination of the thicknesses of the macular-RNFL, GCL+IPL (GCIP), the inner nuclear layer (INL)+OPL, and the outer nuclear layer (ONL), including the inner and outer photoreceptor segments. Panel C illustrates the cellular composition of the retinal layers depicted in panel B.
Abbreviations: IS: inner photoreceptor segments; OS: outer photoreceptor segments; IS/OS: IS/OS junction; PR: photoreceptors; ILM: inner limiting membrane; ELM: external limiting membrane
The innermost layer of the retina is called the RNFL and is principally composed of unmyelinated axons. In fact, under normal circumstances the retina constitutes an unmyelinated CNS structure, making it an ideal structure for investigating neurodegeneration in MS, since axonal and neuronal measures derived from the retina are not confounded by the concomitant presence of myelin. This in itself represents a major advantage of examining the process of neurodegeneration, as well as the impact of factors that may alter neurodegeneration (such as potentially neuroprotective and neurorestorative therapies), in the retina as opposed to the brain, where myelin is abundant, even in the cortical GM. The axons of the RNFL (about 1.2 million per eye) are derived from the ganglion cell neurons, which are located in the ganglion cell layer (GCL) below the RNFL (Figure 10.2). These axons coalesce at the optic discs to form the optic nerves and then exit posteriorly through the lamina cribrosa, an important zone of demarcation beyond which oligodendrocyte-derived myelin is applied to these axons retro-orbitally, thereby signifying a transition from membrane (slow) to saltatory (fast) conduction properties [36, 37].
There is a clear predilection for affliction of the optic nerves in MS, not just clinically such as from acute optic neuritis (AON), which occurs during the course of the disease in 30–70% of patients, but also subclinically, reflecting subclinical or occult optic neuropathy. Optic nerve pathology could be regarded as virtually ubiquitous in the MS disease process, since 94–99% of MS patients are found to exhibit demyelinating optic nerve lesions upon postmortem examination [38, 39]. Optic nerve demyelination (whether a derivative of acute or occult optic neuropathy) has long been recognized to result in axonal dysfunction, transection, and ultimately retrograde degeneration toward the retina (along with Wallerian degeneration distally), eventually producing atrophy of the RNFL and GCL compartments within the retina [15, 40, 41]. In keeping with evidence-based characterizations of postmortem visual system analysis in MS [40, 41], OCT has provided replete in vivo evidence of p-RNFL and GCL thinning in MS eyes, irrespective of a history of AON or not [33, 34, 42 43].
Since the RNFL represents the axonal tracts of the ganglion cell neurons, GCL reduction is believed to be the result of retrograde axonal degeneration of the retinal nerve fibers, i.e., reduction in both RNFL and GCL are thought to be derivative of the same pathologic processes, namely optic neuropathy (and associated tissue injury mechanisms). Despite the biologic similarity of the both the RNFL and GCL, OCT derived measures of GCIP thickness seem to have superior structure–function relationships than those of RNFL thickness [33]. This appears to be the case not only with visual measures acquired at high contrast (100%) and low contrast (2.5% and 1.25%), but also with expanded disability status scale (EDSS) estimates of global MS disability. Given the biologic similarity of both the RNFL and GCIP, and that these two retinal compartments may be regarded as mere extensions of one another, a number of potential explanations have been proposed to explain the potentially superior structure–function relationships of GCIP over p-RNFL thickness measurements. GCIP thickness measurements appear to have superior reproducibility than RNFL thickness measurements [32]. In addition, it has been proposed that the GCL may not be prone to edema, unlike the RNFL, during optic nerve inflammation [34]. Microinflammatory processes, if operative in the optic nerve(s), may therefore not confound GCIP measurements similar to RNFL measurements [32, 33].
Notwithstanding the importance of the recent and abundant evidence corroborating that both RNFL and GCL pathology are common and germane to visual system pathophysiology in MS, there is coincident evidence that deeper retinal (inner nuclear layer and outer nuclear layer) pathology also occurs in MS. Consistent with electroretinographic and postmortem findings [40, 44–47], OCT-segmentation demonstrates quantitative inner nuclear layer (INL) and outer nuclear layer (ONL) abnormalities in MS [32, 33, 35]. Although the definitive etiological rudiments of INL and ONL pathology in MS remains to be determined, recent observations support the possibility that a primary retinal neuronal mechanism of pathology may be operative in anterior visual system pathophysiology in a limited but not insignificant proportion of MS patients. OCT identification of INL and ONL thinning in MS eyes without a prior history of optic neuritis, in which there is relative preservation of the RNFL and GCIP, has been referred to as the macular thinning predominant (MTP) phenotype of MS [32] (Figure 10.3). The MTP phenotype may be associated with more rapid accumulation of sustained disability in MS [32], and the mechanisms of INL and ONL changes may be pathobiologically distinct from those that mediate tissue injury within the RNFL and GCL, although this remains unclear and requires further research.
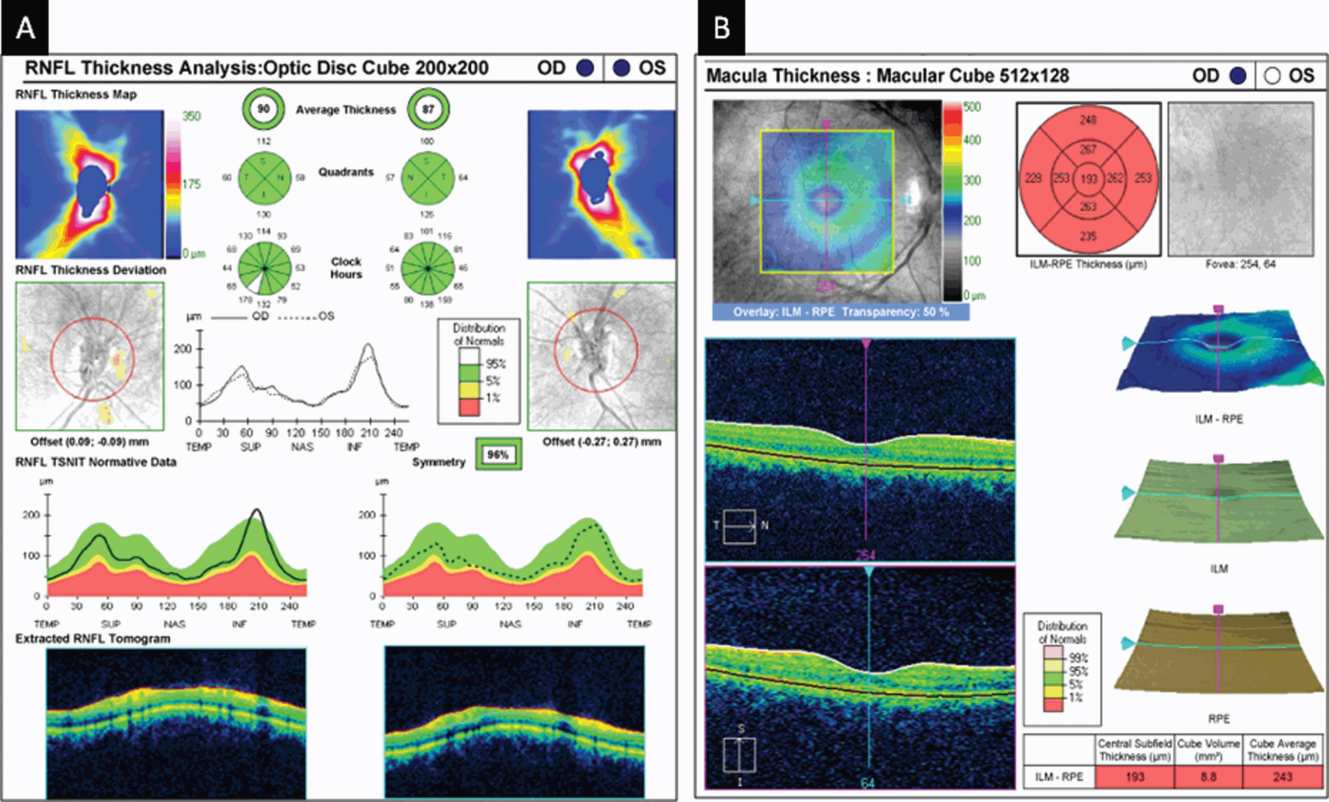
An optical coherence tomography (OCT) peripapillary retinal nerve fiber layer (p-RNFL; Panel A) and macular (Panel B) report generated by Cirrus HD-OCT (Carl Zeiss Meditec, Dublin, California) in a patient with multiple sclerosis without history of optic neuritis. The upper-middle section of Panel A displays the average p-RNFL thickness for the right eye (OD) and the left eye (OS), as well as the quadrant and clockhour measures of p-RNFL thickness for each eye. Note that the average p-RNFL thickness, as well as the quadrant and clockhour measures, is represented in colors that correspond to the normal distribution of p-RNFL thickness values. The average p-RNFL thickness (as well as quadrants and sectors) in each eye is represented in green (indicating values within normal range).
The top-right section of panel B displays quadrant measurements of retinal thickness. Again, these are represented in colors that correspond to the normal distribution of macular thickness values. The central macula represents the foveola, with the four quadrants immediately surrounding this (inner macula) representing the parafoveola. Note that the average macular thickness (cube average thickness) indicated in the bottom-right chart (as well as all of the macular quadrant thicknesses) are represented in red, indicating values less than 1% of what would be expected compared to an age-matched reference population. The macular scan of the left eye in the same patient (not shown) is similar to that of the right eye in panel B. The combination of OCT findings described in this figure fulfills our criteria for a macular-thinning-predominant (MTP) patient. Please note that this represents a patient with an average macular thickness < 1st percentile. Those with a normal average p-RNFL thickness and average macular thickness between the 1st and 5th percentile also fulfill our criteria for an MTP patient.
Although oculohistopathological examination reveals dropout of INL neurons in up to 40% of MS eyes [40], qualitative assessment of OCT scans derived from MS patients in vivo reveal microcysts in a small proportion, which are predominantly localized to the INL [48, 49] (Figure 10.4). Again, the etiology and significance of these microcysts in MS eyes has been the source of lively scientific debate. Some proponents have raised the possibility these microcysts may represent sites of primary retinal inflammation, on the basis that 25% of patients with macular edema demonstrating fluorescein leakage examined in an ophthalmological study exhibited similar appearing microcysts [50], microcysts in MS eyes may be dynamic in nature over time, and they may be a harbinger of more aggressive MS. Given that microcysts may be dynamic in nature, some authors have suggested that increased INL thickness in the absence of visible microcysts may enable capturing of the same process. As such, increased INL thickness at baseline has been shown to predict clinical and radiologic disease activity during follow-up [49]. On the other hand, some investigators have proposed that microcysts in MS eyes are of little significance, since they may be seen in other neuroinflammatory disorders (including neuromyelitis optica and chronic relapsing inflammatory optic neuropathy) as well as non-inflammatory disorders such as neurofibromatosis, Leber’s hereditary optic neuropathy and glaucoma [51–54]. Given the array of conditions in which macular microcysts have been described, some consider them a final common pathway of retrograde degeneration, especially since there are histopathological descriptions of cavitation occurring within the INL following optic nerve transaction dating back to the 1960s [55]. Moreover, microcysts may simply represent mechanical changes resulting from vitreomacular traction, although this is not universally agreed upon [53].
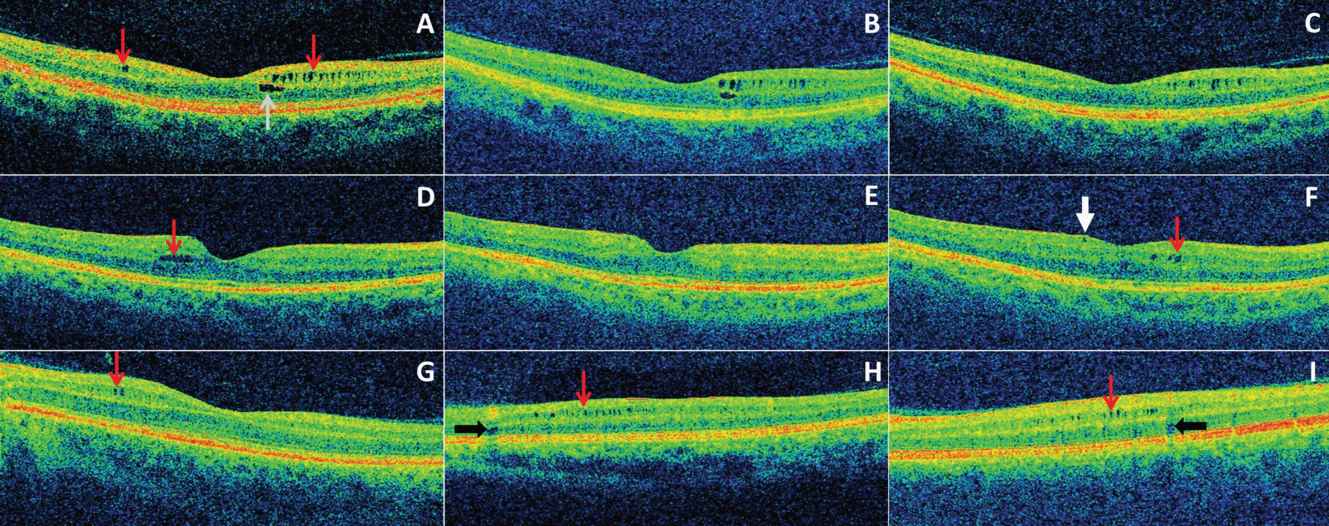
A–C: All images are from the same patient in chronological order over a three-year period. (A) Microcystic macular edema (MME) of the inner nuclear layer (INL) (red arrows) was present at baseline as well as a foveal cyst of the outer nuclear layer (ONL). (B-C) The foveal ONL cyst progressively resolved during the follow-up period.
(D-F) All images are from the same patient in chronological order over a two-year period. (D) A single INL cyst (red arrow) was present at baseline. (E) The cyst spontaneously resolved after one year. (F) Following fingolimod treatment (initiated after scan E), the patient developed new cystic changes of the INL (red arrow). An epiretinal membrane is noted (white arrow) that had been present on previous scans as well.
(G-I) Three different patients with MME of the INL (red arrows). Vessel artifacts (black arrows) are demonstrated for comparison.
Although the etiology, relevance, and significance of INL and ONL changes in MS remain to be established, there is an abundance of information highlighting the possibility of primary retinal inflammation in MS that is difficult to ignore. Despite being an unmyelinated structure, retinal periphlebitis occurs in up to 20% of MS patients [41], highlighting that myelin does not need to be present for instigating or propagating inflammation in MS. The antigenic target of this inflammation remains unknown. Interestingly, previous studies have shown that, during periods of active retinal periphlebitis, there may be concomitant breakdown of the blood-brain barrier in MS [56]. Moreover, retinal periphlebitis in MS has been shown to be a risk factor for the development of relapses, contrast enhancing lesions, as well as an increase in T1 lesion volume during follow-up [57, 58]. In addition to retinal periphlebitis, up to 16% of MS patients experience uveitis, particularly intermediate uveitis of the pars planitis subtype [59]. Activated microglia have also been demonstrated in MS retinas at postmortem examination [40]. Despite ongoing debate, all combined, these observations may be diametrically in opposition to the long-recognized pathological polarity involving retrobulbar inflammation and its sequelae [32–35].
Time-domain OCT and the brain MRI in MS
There have been a number of studies investigating the relationships between time-domain OCT derived measures and brain MRI in MS (Table 10.1). Although several studies have consistently found that p-RNFL thickness correlates with brain parenchymal fraction (BPF) in MS [60–63], suggesting p-RNFL thickness, at least in part, reflects global CNS pathology, associations between average macular thickness (or total macular volume), a nonspecific measure of the composite thickness or volume of all of the intervening layers of the retina in the macular region, and BPF have been less consistent [60, 63]. Some studies have shown relationships between total macular volume and BPF [63], while others have not [60]. Given the lack of specificity of total macular volume or average macular thickness, however, the potential utility of this measure in MS is questionable, and thus some investigators did not examine the relationships between total macular volume and brain MRI, restricting their analyses to measures of p-RNFL thickness only [57]. More important is the lack of consistency observed in these studies between p-RNFL thickness measurements and brain-substructure volumes [57, 60–62]. Some investigators found relationships between p-RNFL thickness and BPF, but not GM or WM volumes [60], while in some studies p-RNFL thickness and both GM and WM volumes were related [57], while in others p-RNFL thickness was associated with either GM volume only [62] or WM volume only [61]. Relationships between p-RNFL thickness and T1 lesion volume, as well as T2 lesion volume, were similarly inconsistent. For example, in one study p-RNFL thickness correlated with neither T1 lesion volume nor T2 lesion volume [57], while in another it correlated with both T1 lesion volume and T2 lesion volume [62]. More specifically, on the basis of these studies, it is unclear whether p-RNFL thickness, at least as estimated with time-domain OCT technology, correlates with measures of the normal-appearing cerebral white matter (NAWM), white matter (WM) lesional morphometry, or cortical gray matter (GM) volumes. There may be several potential explanations underlying the inconsistency of the results observed in these various studies, especially with respect to the relationships of p-RNFL thickness measures with brain substructure volumes, which makes the comparability of the results derived from these different studies limited.
| Study | n | OCT measure | MRI segmentation | Correlations | |
|---|---|---|---|---|---|
| Yes | No | ||||
| Time-domain OCT studies | |||||
| Sepulcre et al. [57] | 61 | Minimum p-RNFL | VBM method | WM, GM | T2 LV, T1 LV |
| Gordon-Lipkin et al [60] | 40 | Minimum p-RNFL | SIENAX | BPF, CSF | GM, WM |
| Grazioli et al. [61] | 18/30 | Average p-RNFL of both eyes | SIENAX | NBV, WM, T2 LV | GM, T1 LV |
| Siger et al.a [62] | 51 | p-RNFL in ON vs. non-ON eyes | SPM99 | BPF, GM, T2 LV, T1 LV | WM |
| Dorr et al. [63] | 104 | p-RNFL of each eyeb | SIENAX | BPF | |
| Pfueller et al. [65] | 83 | p-RNFL of each eyeb | SIENAX | BPF | |
| Spectral-domain OCT studies | |||||
| Young et al. [68] | 44 | p-RNFL of each eyeb & minimum RNFL | JIM, FAST, FSL | BPF, WM | GM, BHFr, T2 LV |
| Zimmermanna et al. [69] | 63 | p-RNFL of ON vs. non-ON eyesb | SIENAX | NBV, WM, GM | |
| Saidha et al. [70] | 84 | p-RNFL of each eye & p-RNFL of ON vs. non-ON eyesb | LESION-TOADS | GM, caudate | NAWM, thalamus, brainstem, T2 LV |
Abbreviations: OCT: optical coherence tomography; p-RNFL: peripapillary retinal nerve fiber layer; MRI: magnetic resonance imaging; VBM: voxel based morphometry; WM: white matter; GM: gray matter; LV: lesion volume; BPF: brain parenchymal fraction; CSF: cerebrospinal fluid; NBV: normalized brain volume; BHFr: black hole fraction; NAWM: normal appearing white matter
a Presented relationships are those from eyes without a prior history of ON.
b Statistical models were used to account for within-subject, inter-eye correlations in analyses from these studies.
The patient populations included in these studies varied quite a bit with respect to sample size, MS subtype, as well as the degrees of disability and disease duration of the patients included. Treatment effects were also minimally accounted for across these various studies. There are several major methodological differences between the studies. Some studies utilized minimum p-RNFL thickness (lowest p-RNFL thickness of either eye) in analyses [57, 60], some studies utilized average p-RNFL thickness of both eyes in analyses [61], some studies utilized the p-RNFL thickness of both eyes but accounted for within-subject inter-eye correlations [63], while in some other studies comparisons were of p-RNFL thickness in eyes with and without a history of AON [62]. Interestingly, in the latter study, p-RNFL thickness in MS eyes without a history of AON correlated with BPF and GM fraction, while in MS eyes with a history of AON p-RNFL thickness correlated with neither BPF nor brain substructure volumes. In addition to these differences in the utilization of p-RNFL thickness, there were also differences in the statistical approaches and models adopted in each study. Finally, there were differences in the brain segmentation techniques employed between the studies to determine brain substructure volumes. Some studies utilized SIENAX, while others used different techniques. Moreover, not all studies investigated lesion morphometry volumes, or indeed even brain substructure volumes. For instance, in some studies only relationships between OCT measures and BPF were assessed.
The lack of consistency for relationships of p-RNFL thickness and brain substructure volumes observed in the above studies does not mitigate the consistent and encouraging observation that p-RNFL thickness and BPF appear to be related in MS, suggesting p-RNFL thickness, at least to some degree may reflect global brain atrophy and global CNS processes in MS. Investigations of relationships between time-domain OCT derived measures, principally reflecting the anterior visual pathway, and measures of the posterior visual pathways derived from nonconventional MRI techniques have also yielded interesting results in MS. In one such study, DTI indices along the optic radiation were correlated with p-RNFL thickness measures in MS, controlling for age, sex, and corresponding MRI indices along a portion of the corticospinal tract (to attempt to at least partially account for global CNS changes driving relationships) [64]. Moderate correlations of average RNFL thickness with FA and λ⊥ in the OR were observed, suggesting an association between p-RNFL thickness and OR damage that may not be primarily driven by abnormalities outside of the visual system. Interestingly, p-RNFL thickness in the nasal retinal quadrant was specifically correlated with FA and λ⊥ in the synaptically connected contralateral OR. Since this was a cross-sectional study, the results cannot be over-interpreted as substantiated evidence of transynaptic degeneration. Even though these results point toward a relationship between changes in the anterior visual pathway and posterior visual pathway in MS, the study does not address or help determine how the changes may be connected, that is, retrograde vs. anterograde degeneration, or coincidental concomitant pathology simultaneously afflicting both the anterior and posterior visual pathways. Another very interesting cross-sectional study utilizing time-domain OCT studied the relationships between p-RNFL thickness, global brain atrophy (as estimated by BPF), and MRS-derived NAA concentrations in the visual cortex, as well as the NAWM in MS [65]. In this study the investigators found that p-RNFL thickness measures correlated with NAA concentrations in the visual cortex, but not the NAWM, and were consistent with prior observations that RNFL thickness correlated with BPF in MS. The multivariate statistical model employed revealed that the correlation between RNFL thickness and visual cortex NAA concentration was unlikely to simply represent the consequence of global brain atrophy, as one might assume on the basis of the relationship between p-RNFL thickness and BPF, since BPF and visual cortex NAA concentrations seemed to be both independently associated with p-RNFL thickness. In fact, visual cortex NAA concentrations and BPF did not seem to be correlated with one another in this study. The investigators’ findings thus highlight a potential interconnection between changes in the anterior and posterior visual pathways, beyond that which may be expected due to simple global neurodegeneration. Consistent with this observation, the study also revealed lower NAA visual cortex concentrations in subjects with a prior history of AON. Again, however, this was a cross-sectional study and, therefore, the results should not be over-interpreted to substantiate evidence of transynaptic degeneration.
Spectral-domain OCT, segmentation, and brain MRI in MS
The first analyses attempting to correlate changes in retinal architecture and global CNS pathology in MS, as described previously, utilized time-domain OCT, which has lower reproducibility and resolution than the high-speed, high-definition spectral-domain devices, which enable the rapid and near-automated acquisition of high-resolution images, in conjunction with a very low test–retest variability. [66, 67] Notwithstanding these impressive technical advancements, there has been a paucity of studies involving the utilization of spectral-domain OCT, for the purpose of studying the relationship between retinal and brain metrics in MS. While these latest studies show a similar relationship between spectral-domain derived p-RNFL thickness measurements and time-domain derived p-RNFL thickness measurements, with BPF, results of relationships with brain substructure volumes are also unfortunately conflicting (Table 10.1). In a recent study including participants with clinically isolated syndrome (CIS) or early relapsing remitting MS (RRMS), not on active treatment, in which brain volumetrics were assessed with a 1.5 T MRI, p-RNFL thickness and total macular volume independently predicted WM fraction, but not GM fraction or black hole fraction, correcting for age and history of AON [68]. However, in another recent study of just RRMS patients, in which brain volumetrics were also assessed with a 1.5 T MRI, p-RNFL thickness and TMV (albeit less so) were both significantly associated with normalized WM volume and normalized GM volume [69]. However, in this study, the authors found that the significant association of OCT measures with normalized GM volume was abolished in eyes with a history of AON (while the relationship with normalized WM volume was essentially unaffected). On the basis of this finding, which was similar to that observed by Siger et al. [62] in their study of time-domain OCT–brain MRI relationships, the authors proposed the possibility that excessive tissue damage resulting from AON may mask the underlying relationship between OCT measures and GM volume driven by global neurodegeneration in MS, as observed in eyes without a history of AON. In this study, the authors also included limited OCT segmentation data. Specifically, they assessed macular GCL thickness measures, as estimated by the composite thickness of the GCL and inner plexiform layer (GCIP). As might be expected, given the biological similarity of the GCL and RNFL (they could be regarded as extensions of one another), GCIP thickness measures exhibited relationships with brain volumetrics similar to those observed with p-RNFL thickness measures. On the basis of previous work in which GCIP thickness measures appeared to have superior structure–function relationships to p-RNFL thickness measures (33), possibly related to superior reproducibility among other potential reasons, one might have expected that GCIP thickness measures would reflect global CNS processes more strongly than p-RNFL thickness measures. However, this was not observed in this study.
A more detailed assessment of the relationships between spectral domain OCT segmentation derived retinal measures and 3 T MRI-derived brain substructure volumes has also been performed in MS [70]. Since brain substructure volumes correlate with intracranial volume (a surrogate of head size), these measures are conventionally normalized or adjusted for intracranial volume in order to account for these normal relationships. In undertaking this study, the authors also investigated whether OCT (including OCT segmentation) derived retinal measures might also correlate with head size (using intracranial volume as a surrogate) in order to potentially optimize the accuracy of their results. Indeed, the investigators of this study found that OCT measures in healthy controls and MS patients appear to correlate with intracranial volume (or head size) and, therefore, not only adjusted brain substructure volumes, but also OCT measures for intracranial volume, as part of their regression models when assessing retinal-brain relationships. In this study, p-RNFL and GCIP thickness measures exhibited relationships similar to one another with brain substructure volumes, with perhaps the relationships being interestingly slightly stronger with p-RNFL than GCIP measures. Both p-RNFL and GCIP thickness measures were associated with cortical GM volume (as well as caudate volume), but only in the eyes of MS patients without a history of AON, again raising the possibility that excessive local tissue injury following AON may mask underlying relationships that would otherwise be seen. Neither p-RNFL nor GCIP thickness measures were associated with either NAWM volume or T2 lesion volume. However, an interesting finding to emerge from this study was the unexpected and apparently strong relationship between INL thickness and T2 lesion volume, with a corresponding inverse relationship with NAWM volume in RRMS. In other words, higher INL thickness in this MS cohort appeared to be associated with higher T2 lesion volume and lower NAWM volume (Figure 10.5). The basis for this finding could not be determined as part of this cross-sectional study, although the possibility that increased INL thickness may represent part of the spectrum of macular microcysts (when the microcysts are not visible to the naked eye, for example) or even potentially retinal periphlebitis have been raised. Another interesting finding to emerge from this study was that INL and ONL changes in MS may not reflect similar global CNS processes, unlike the RNFL and GCL. For instance, ONL thickness in MS eyes only with a history of AON was associated with cerebellar WM volume and tended to towards being associated with cortical GM, caudate, thalamus, and T2 lesion volume, raising the possibility that it may be more a marker of global neurodegeneration in MS. However, the basis for these findings was not explored in this study. Overall, this represents a preliminary study, since detailed investigations of the relationships between OCT segmentation derived measures and brain MRI measures are lacking. The findings of this study need to be validated and the basis for the observed relationships need to be explored and determined.
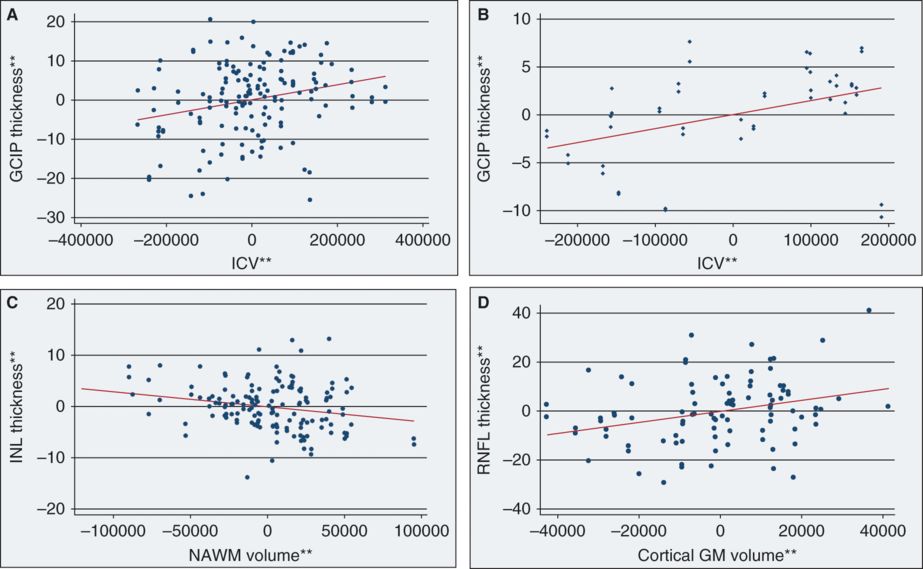
**Residual values from multivariate regression models
Panel A represents an adjusted variables plot of ganglion cell layer + inner plexiform layer (GCIP) thickness and intracranial volume (ICV) in multiple sclerosis (MS), adjusted for age, sex, and disease duration. The solid red line illustrates the independent relationship between GCIP thickness and ICV in MS. Note that, as ICV increases, GCIP thickness similarly increases, consistent with the detection of significant associations between GCIP thickness and ICV in MS (p = 0.008). Panel B represents an adjusted variables plot of ganglion cell layer + inner plexiform layer (GCIP) thickness and intracranial volume (ICV) in healthy controls (HCs), adjusted for age and sex. The solid red line graphically illustrates the independent relationship between GCIP thickness and ICV in HCs. As ICV increases, GCIP thickness similarly increases. Panel C represents an adjusted variables plot of inner nuclear layer (INL) thickness and normal-appearing white matter (NAWM) volume in MS, adjusted for age, sex, disease duration, and ICV. The solid red line shows the independent relationship between INL thickness and NAWM volume in MS. Note that, as INL thickness increases, NAWM volume decreases. Panel D depicts an adjusted variables plot of peripapillary retinal nerve fiber layer (p-RNFL) thickness and cortical gray matter (GM) volume in RRMS, adjusted for age, sex, disease duration, and ICV. The solid red line graphically illustrates the independent relationship between p-RNFL thickness and cortical-GM volume in RRMS.
Related posts:
 Optical coherence tomography and low-contrast acuity
Introduction to optical coherence tomography in neurological diseases
Future technological advances in optical coherence tomography
Optical coherence tomography in acute optic neuritis
Optical coherence tomography and visual outcomes in acute optic neuritis
Optical coherence tomography in a multi-center setting: quality control issues
Optical coherence tomography and low-contrast acuity
Introduction to optical coherence tomography in neurological diseases
Future technological advances in optical coherence tomography
Optical coherence tomography in acute optic neuritis
Optical coherence tomography and visual outcomes in acute optic neuritis
Optical coherence tomography in a multi-center setting: quality control issues
Stay updated, free articles. Join our Telegram channel

Full access? Get Clinical Tree


