Multifocal stimulus employed in mfVEP recording. Each sector (area 4 × 4 checks) reverses polarity according to a pseudo-random sequence. Temporal sector (T) corresponds to central visual field, superior sector (S)-to inferior visual field, and inferior sector (I)-to superior visual field.
Similarly to full-field VEP recordings, mfVEP responses are dependent on the integrity of the entire visual pathway.
Applications in optic neuritis and multiple sclerosis
The advent of VEPs in the 1970s first allowed clinicians to assess neural conduction in the optic nerve. Halliday demonstrated that diagnostic confirmation of optic neuritis can be made using latency delays of full-field VEP [3, 16]. Due to advances in neuroimaging techniques, such as magnetic resonance imaging (MRI), the VEP was neglected for many years. However, recently the focus in multiple sclerosis (MS) research is shifting back to structural and functional correlation based on OCT and electrophysiology of the optic nerve and retina.
| Test | Stimulus | Signal generation | Visual region |
|---|---|---|---|
| Full-field ERG | Diffuse flash using Ganzfeld dome | Photoreceptors (rods,cones), bipolar cells | Pan-retinal |
| Pattern ERG | Reversing black/white checkerboard; 15 o and 30 o field size | Macular photoreceptors, retinal ganglion cells | Macula |
| Pattern VEP | Reversing black/white checkerboard; ≥15 o | Cortical neurons within primary visual cortex | Large field, macular dominated |
| Multifocal ERG | Flickering black/white hexagons; 40o-50o diameter | Cone photoreceptors and bipolar cells | Topographical responses within macula |
| Multifocal VEP | Reversing black/white dartboard; 60o diameter | Cortical neurons within primary visual cortex | Topographical responses within visual field |
Studies of optic neuritis evolution
Optic neuritis (ON) is an inflammatory optic neuropathy which is strongly associated with MS. Up to 75% of ON patients have been reported to eventually develop MS, with the presence of typical MRI lesions in the brain at the time of ON onset being a strong risk factor [17]. The natural history of acute ON mirrors that of acute MS relapses elsewhere in the central nervous system [18]. However, in contrast to most brain lesions, the effects of disease on the optic nerve are readily clinically apparent and potentially measurable [19]. By obtaining mfVEPs as a measure of inflammation and conduction speed, in parallel with detailed clinical measures of visual function and OCT measurements of retinal layers as a more direct assessment of axonal damage, it is possible to develop a picture of pathophysiological events produced by individual lesions as they progress. [20] Therefore, ON represents an ideal in vivo model for studying the relationship between inflammation, axonal loss, and de/remyelination following single inflammatory attack [21].
It is understood that transection of optic nerve axons during acute inflammatory demyelination leads to retrograde degeneration, which ultimately reaches the RNFL and can be accurately measured by OCT providing a structural measure of axonal loss. The amplitude of the mfVEP, on the other hand, provides a functional estimation of preserved optic nerve fibers. Therefore, application of both techniques allows comprehensive assessment of the effect of inflammatory demyelination on visual pathway [5].
Early work exploring the links between optic nerve structure and function after acute ON in MS (MSON) produced inconclusive results.
The first study comparing OCT and conventional VEP was performed by Parisi et al. in 2001 [22], who reported significantly delayed P100 latencies and reduced N75 to P100 amplitudes in the eyes of MS patients with documented ON (MSON) when compared with control and fellow eyes. There was also a significant reduction of total and temporal RNFL thickness in MSON eyes compared with the values observed in control eyes. The authors, however, did not find a significant correlation between VEP (both amplitude and latency) and RNFL thickness. The study only included 14 patients and an early model of OCT with lower resolution was used.
A study published by Trip et al. [23] in 2005 using higher-resolution OCT demonstrated a significant correlation of RNFL thickness with amplitude of the full-field VEP. Time since onset of optic neuritis in this group was three years, and patients with a previous optic neuritis episode with or without MS were included.
Pueyo et al. [24] in 2008 confirmed a correlation between RNFL thickness (temporal sector in particular) and full-field VEP amplitude in a group of 50 MS patients. This study also demonstrated a significant correlation of RNFL with VEP latency, which was explained by the fact that, contrary to Trip et al., all study patients had clinically definite multiple sclerosis (CDMS), which is more often associated with demyelinating processes. Data from the same group published two years later (2010) and based on a smaller number of patients [25] also demonstrated significant latency increase and significant amplitude decrease of VEP P100 in MS patients. However, while good correlation was reported between P100 latency and OCT mean RNFL thickness, no correlation was shown between RNFL and VEP amplitude.
This discrepancy of structure–function relationships may be attributed to several factors: first, sensitivity of time-domain OCT devices used in earlier studies was low; second, there was significant difference in the cohorts of patients studied, some studies including CIS, while others only included CDMS. Additionally, and maybe most importantly, full-field VEP recording has intrinsic problems described in the section above.
Therefore, to clarify the structure-function relationship in the visual system of MS patients with and without ON, we have undertaken several studies comparing structural changes in the optic nerve using OCT RNFL thickness compared with latency and amplitude of mfVEP [26, 27, 30]. An initial cross-sectional investigation of patients with post-acute optic neuritis demonstrated a strong correlation between RNFL thickness and mfVEP amplitude [26, 27]. To minimize the effect of inter-subject variability, between-eye asymmetry of RNFL thickness and amplitude of the mfVEPs were analyzed. There was also good topographical association between two measures (Figure 7.2) [28].
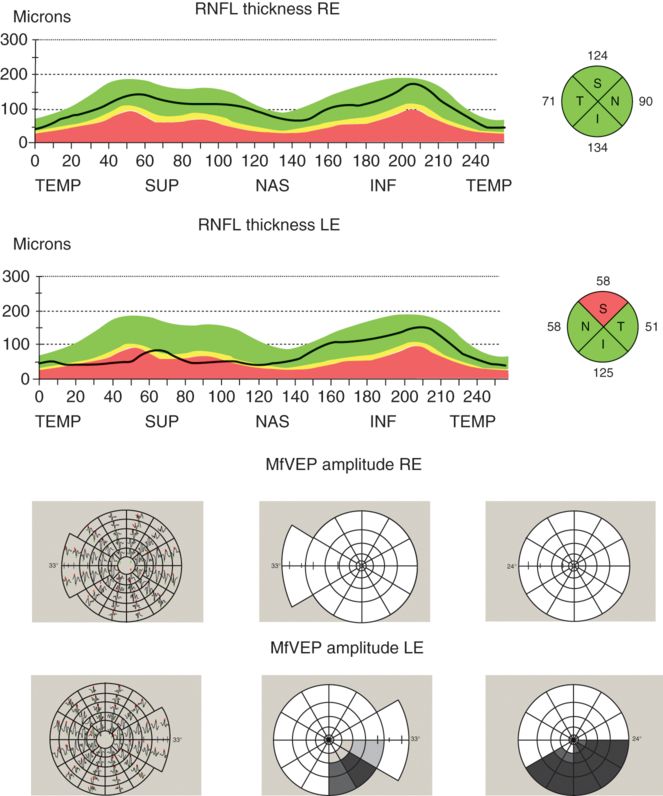
Example of topographic correspondence between RNFL thickness and mfVEP amplitude. Significant thinning of RNFL in upper sector and reduction of mfVEP amplitude in the lower area of the visual field is detected in left eye. For mfVEP, the first column represents VEP trace arrays; the second column, the Amplitude Deviation plot; and the third column, the Amplitude Asymmetry Deviation plot.
Reduction of mfVEP amplitude, however, was considerably greater compared to RNFL thinning, indicating that the functional deficit may be greater than structural loss. Some possible explanations were suggested, including:
a. larger functional loss from channel failure on the denuded, but structurally preserved axons [28];
b. ongoing inflammation in the visual pathway, possibly as part of a more diffuse, slow inflammation in the white matter [29], which may reduce mfVEP amplitude due to axonal dysfunction or conduction block in some fibers.
A longitudinal study performed within the first year of acute ON, however, demonstrated a more complex relationship between functional and structural measures of optic nerve integrity. This study showed that while during the acute stage of optic neuritis both RNFL thickness and mfVEP amplitude are influenced by the severity of inflammation, its effect on structural and functional measures is quite different. Acute loss of myelin and associated inflammation cause conduction block, which reduces or completely abolishes mfVEP amplitude. At the same time, inflammatory edema often results in thicker swollen RNFL [30–34]. This leads to a complete structure–function dissociation (Figure 7.3a).
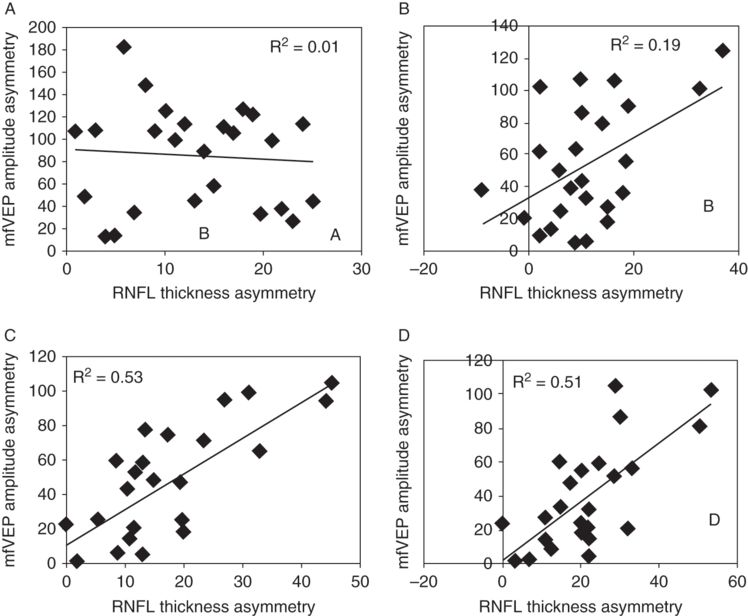
Correlation between inter-eye asymmetry of RNFL thickness and mfVEP amplitude at (A) 1 month, (B) 3 months, (C) 6 months, and (D)12 months.
The Association for Research in Vision and Ophthalmology is the copyright holder.
Conduction block normally recovers within a few weeks, during which inflammation subsides, ion channels are reconstructed and conduction partially resumes, although often in a slower, continuous mode [28]. This usually leads to recovery of amplitude up to the level supported by surviving fibers. Therefore, after conduction block is over, the magnitude of the mfVEP signal becomes mainly dependent on the degree of axonal transection.
After resolution of edema, axonal degeneration becomes the predominant pathological feature affecting RNFL thickness. However, it takes time for axons transected during acute inflammation to degenerate back to the retina. Therefore, a mild degree of correlation seen at three months is mainly due to time lag between axonal transection and retrograde degeneration reaching the retina (Figure 7.3b). By six months, however, this process is completed and the direct relationship between thinner RNFL and lower mfVEP amplitudes becomes apparent (Figure 7.3c).
Studies of the fellow eye in MS patients
An increasing number of studies have demonstrated significant axonal and neuronal loss of retinal ganglion cells (RGC) in MS patients with no previous ON (MS-NON). A recently published meta-analysis showed an average RNFL thinning of 7 μm (about 7%) in those eyes [35]. Talman et al. [36] presented evidence that this loss may even be progressive. However, the pathological basis of the RGC axonal and neuronal loss in the MS-NON eyes is not clear. Therefore, a combination of functional assessment of the visual pathway with structural OCT measurement may help to better understand the nature of this loss. Latency of mfVEP can be used as a marker of subclinical inflammatory demyelination along the visual pathway.
Using this approach, we assessed the relationship between loss of RNFL and mfVEP in NON-eyes of MS patients in early disease. Figure 7.4, which is based on a compilation of results from several studies, shows the percentage of patients with abnormally thin RNFL and delayed mfVEP latency compared to age- and gender-matched normal controls.
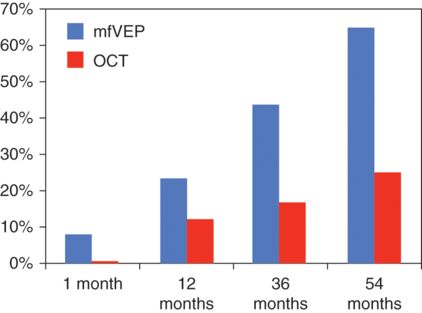
Percentage of non-optic neuritis eyes with delayed mfVEP latency (blue) and reduced RNFL thickness (red).
Only CIS patients (acute unilateral ON) were examined at one month after the onset of symptoms. All patients, however, had brain or spinal cord demyelinating lesions detected by magnetic resonance imaging (MRI) and were classified as high risk for development of MS [37]. A mixed group of CIS and CDMS patients were investigated at 12 and 36 months after the first demyelinating episode [26, 38], while only CDMS patients were included in the last group (54 months) [39].
Taken together, these results demonstrate early change of conduction along the visual pathway (which is already obvious in CIS patients) possibly caused by subclinical inflammation with loss of RGC axons to follow.
The last study is of particular interest since it demonstrated not only significant latency delay of mfVEP, but also significant reduction of total and temporal RNFL thickness in NON eyes (including fellow eyes of ON patients). Even more interestingly, both total and temporal RNFL thickness was associated with latency of the mfVEP (Figure 7.5a, b). When grouped according to latency delay, NON eyes with normal latency showed no reduction of RNFL thickness compared to controls, while eyes with delayed latency demonstrated significantly thinner RNFL. MS-NON eyes with delayed latency also had significantly thinner RNFL compared to those with normal latencies. In patients with no previous ON in either eye, delayed latency and reduced RNFL were bilateral whenever present. The binocular nature of latency delay suggests a retro-chiasmal location of demyelinating lesions. However, whether or not axonal loss is the result of retrograde degeneration triggered by optic tract lesions or caused by trans-neuronal spread of neurodegeneration from LGN neurons to RGC axons following optic radiation or cortical lesions, remains to be seen.
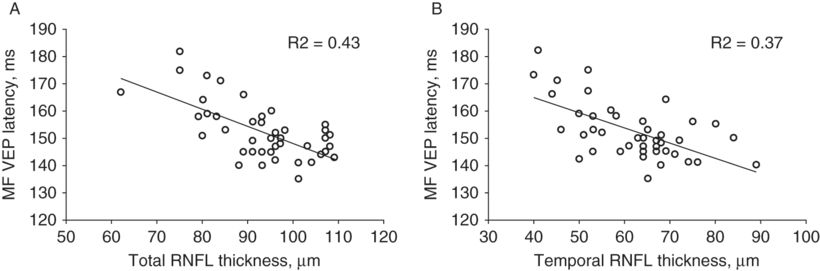
Correlation between mfVEP latency and (A) total RNFL thickness and (B) temporal RNFL thickness.
Chronic demyelination and neurodegeneration
While demyelination is still considered the most characteristic histopathological feature of MS, a significant association has been found between permanent functional deficit in MS and loss of axons, and it is now believed that axonal degeneration constitutes the basis for neurological disability.
It was suggested that permanent demyelination in the absence of active inflammation may contribute to axonal degeneration [40] by making axons more vulnerable to physiological stress. One of the potential mechanisms of axonal damage due to chronic demyelination may be related to ischemic insult of white matter and involves an imbalance between axonal energy demand and limited energy supply. Lack of trophic support from myelin or myelin-forming cells and disruption of normal axon–myelin interaction may also contribute to degeneration of chronically demyelinated axons [33]
While remyelination is now accepted as an early and frequent phenomenon in MS [41, 42], it is often incomplete [43] and probably limited in its duration [44]. It has previously been demonstrated that speed of VEP latency recovery significantly slows down within the first year after ON and practically does not change after that [8, 45]. Therefore, latency remains considerably prolonged in a significant proportion of patients even a few years after the demyelinating episode, indicating existence of extensive chronic demyelination.
Using mfVEP to characterize the level of optic nerve demyelination [46, 47] and optical coherence tomography to quantify RNFL thickness, it is possible to investigate the association between the degree of permanent demyelination and progressive axonal loss in a visual system of MS patients. We followed a group of 25 patients with clinically isolated acute unilateral ON for three years after onset of ON using both techniques. All patients had demyelinating MRI lesions of the brain or spine on initial MRI scans and were classified at enrollment as “possible MS.” During the follow-up period, nine patients converted to CDMS.
This study demonstrated significant latency delay of mfVEP at 12 months in ON eyes as compared to normal controls. Latency delay ranged from 4 to 39 ms, indicating a high degree of demyelination for some patients. There was a small, but statistically significant, latency recovery over the follow-up period, but it remained extensively delayed even at 36 months. Fellow eyes also demonstrated significant latency prolongation at 12 months, although on a much lesser scale. Latency of the fellow eye then remained stable during entire follow-up period. RNFL thickness was significantly reduced in ON eyes at study entry point (12 months) indicating substantial axonal loss caused by axonal transection during acute inflammatory demyelination and subsequent retrograde degeneration. RNFL thickness of the fellow eye, however, was not affected.
There was a small, but significant, reduction of RNFL thickness between 12 and 36 months for both ON and fellow eyes. During the follow-up period RNFL thickness decreased on average by 1.2 µ in ON and 1.3 µ in the fellow. However, this change in RNFL thickness was not related to the degree of latency delay at 12 months for both ON and fellow eyes, indicating no association between the degree of permanent optic nerve demyelination and progressive axonal loss and raising a question about any potential role of chronic demyelination in axonal neurodegeneration, at least in the early stages of the disease. The fact that fellow eyes demonstrated a similar degree of RNFL thinning, while only showing marginal demyelination, supports this conclusion [48].
Pattern ERG studies in MS
Parisi et al. [22] reported significant reduction of PERG P50 and N95 amplitudes, as well as a delay of the P50 latency, in MSON eyes when using 15-min arc checks stimulation. In addition, the OCT temporal RNFL thickness was significantly correlated with the PERG P50 latency and N95 amplitude. The study was small (14 patients) and employed an early model of OCT. Correlation of N95 amplitude with RNFL and macular thickness, but not with P50 latency was also reported by Almarcegui et al [25].
In contrast, the study of patients with optic neuritis by Trip et al. [23] produced quite different results. The authors demonstrated no association of RNFL thickness with any of the PERG measures.
Cortical plasticity in MS
Following optic neuritis, RGC axons show retrograde degeneration back to the retina, which results in RNFL thinning. This process is believed to be completed by six months [49]. It was, however, demonstrated that in MS patients the RNFL continues to deteriorate after that (and even regardless of a history of ON). A progressive loss of optic nerve fibers even one year after the attack was also detected in longitudinal MRI studies of the optic nerve mean area [18, 50].
The mechanism of RNFL loss is uncertain, but may be related to ongoing primary axonal degeneration, subclinical inflammation or retro-chiasmal inflammatory demyelination with retrograde changes.
After recovery of acute conduction block, which typically takes 4–8 weeks, axonal degeneration becomes the predominant pathological process determining amplitude of the VEP, since loss of optic nerve fibers limits the transmission of the afferent stimulus to the visual cortex [51]. It is expected, therefore, that in the post-acute period changes in amplitude of mfVEP should fall in parallel with changes in the optic nerve structural integrity measure (RNFL thickness). In other words, that progressive axonal degeneration should lead to progressive decline of the mfVEP amplitude.
A recent study, however, presented a different picture – contrary to expectation and despite the loss of RNFL fibers, significant improvement of the mfVEP amplitude was observed between six and 12 months after an episode of acute ON. It was suggested that the findings of increased post-synaptic activity in the striate cortex (as measured by improvement of the mfVEP amplitude) coupled with simultaneous reduction of cortical input (RNFL thinning) supports the concept of continuous cortical reorganization in post-acute optic neuritis [52].
Neural reorganization has been described after acute optic neuritis and is considered to be one of the mechanisms responsible for recovery of function from the acute attack. Various mechanisms including increased expression of sodium channels, neuronal or synaptic changes, increased recruitment of parallel pathways, and cortical reorganization, including functional expansion of surviving neurons are thought to be involved in this process. While the exact site of neuroplasticity in the hierarchy of the visual system still remains a matter of controversy [51, 53, 54], continuous recovery of mfVEP amplitude suggests that it may (at least partially) occur below or at the level of primary visual cortex.
Applications in generalized neurological disease
Increasingly, ophthalmic examination is allowing for greater understanding of the disease processes in neurological conditions that were not classically associated with direct ocular pathology.
Parkinson’s disease
Parkinson’s disease (PD) is generally considered a “movement disorder”; it is now understood that alterations in dopaminergic cells affects the entire visual system from the retina to areas of the central nervous system that subserve vision. In the retina dopamine is found within amacrine and interplexiform cells [55]. The PERG specifically records a response consequent on the pre-ganglionic retinal circuitry that is controlled by these amacrine and interplexiform cells. Both PERG and VEP abnormalities can be detected in PD patients with specific foveal stimulus parameters. Interestingly, patients treated with L-dopa show higher PERG amplitudes compared to untreated patients, but never reach the amplitudes seen in normal controls [56]. The loss of macular PERG correlates with studies showing that on OCT there is loss of the temporal retinal nerve fiber layer thickness at the optic disc [57] and a thinning of the inner plexiform layer at the fovea [58].Other studies have shown alterations in EOG [59] and mfERG in correlation with loss of the inferior and temporal RNFL thickness [60].
Alzheimer’s disease
Alzheimer’s disease (AD) is a progressive neurodegenerative condition resulting in dementia. As in PD, there is increasing evidence that the retina is also affected in the pathophysiological process. Studies have documented that the mean RNFL thickness at the optic disc is reduced in AD compared to controls, with particular loss of the fibers from the superior quadrant [61, 62]. In addition, these OCT changes were shown to correlate with reduced P1 amplitudes of mfERG in both the foveal and peri-foveal regions [62].
Monitoring medication side effects
The retina and central nervous system are particularly sensitive to the effects of toxic insults. Many medications in common use have known effects on the electrophysiology and structural OCT changes. Some examples are presented below.
Hydroxychloroquine (Plaquenil)
In the retinal pigment epithelium, chloroquine phosphate remains at higher concentration than in the liver [63]. Hydroxychloroquine retinopathy typically results in reduced b-wave amplitudes on ERG with prolonged latency in advanced cases and a bull’s eye pattern of reduced function on mfERG, with localized reduction in response amplitudes in ring 2, best detected by analyzing ring ratios [64]. In late cases, a corresponding bull’s eye retinal appearance is seen clinically [65]. The OCT shows a loss of RPE cells, initially as a ring around the macula, and autofluorescence patterns are disrupted relatively early.
Vigabatrin (Sabril)
Vigabatrin is used as an anti-epileptic medication, particularly for the management of infantile spasms. It works by increasing the concentration of gamma-amino butyric acid (GABA) in the brain. However, it also increases GABA in the retina and is associated with visual field constriction.
A study of Vigabatrin patients with visual field constriction [66] shows reduced b-wave amplitude for the rod responses and the combined rod-cone response. Lesser, but significant reduction of a-wave was also detected. Significant positive correlations were found between the total averaged RNFL thickness, superior and inferior RNFL thickness, and reduced standard ERG parameters. The authors concluded that Vigabatrin is retino-toxic on several levels, from photoreceptors to ganglion cells.
Using OCT and mfVEP to characterize the nature of nonconventional MRI techniques
While MRI has proven to be a very sensitive tool in confirming diagnosis of MS and monitoring of treatment trials, it is pathologically nonspecific. It has been suggested that nonconventional MRI techniques such as the magnetization transfer ratio (MTR) may provide more specific characterization of underlying pathological processes [67–69].
MTR imaging is a measure of the exchange of protons between free water and macromolecules in membranes. It is believed MTR is affected by either dilution of protons caused by edema or loss of tissue structure, in particular the structure of myelin. While animal research has demonstrated a strong relationship between the level of myelination and MTR [70, 71], human studies are inconclusive.
Our group performed analysis of optic nerve MTR, RNFL thickness and latency of mfVEP in 23 patients with a single unilateral episode of ON and ten healthy controls [72]. We found a significant reduction of MTR value in ON eyes. A strong correlation of MTR was demonstrated with RNFL thickness and mfVEP amplitude, but not with the level of latency delay, suggesting that MTR reduction is related to axonal loss, rather than demyelination.
Related posts:
 Optical coherence tomography and low-contrast acuity
Introduction to optical coherence tomography in neurological diseases
Future technological advances in optical coherence tomography
Optical coherence tomography in acute optic neuritis
Optical coherence tomography and visual outcomes in acute optic neuritis
Optical coherence tomography in a multi-center setting: quality control issues
Optical coherence tomography and low-contrast acuity
Introduction to optical coherence tomography in neurological diseases
Future technological advances in optical coherence tomography
Optical coherence tomography in acute optic neuritis
Optical coherence tomography and visual outcomes in acute optic neuritis
Optical coherence tomography in a multi-center setting: quality control issues
Stay updated, free articles. Join our Telegram channel

Full access? Get Clinical Tree


