Axial optic nerve slice representing T2-weighted and diffusion-weighted sequences. (A) Optic nerve FLAIR MRI demonstrates increased T2 signal and swelling within the left nerve. (B) B0 image used for generating region of interest (yellow) consisting of 22 voxels within the nerve center. (C) Fractional anisotropy map demonstrating high directionality of the optic nerve on the left (right optic nerve cut by plane of slice).
Optic nerve MRI has high sensitivity and specificity for diagnosing optic neuritis and evaluating for other etiologies in clinical practice. The addition of optic nerve MRI to select clinical trials utilizing OCT and other visual outcomes can help support a treatment effect, if all measures are beneficially affected in a positive manner [2, 3]. Specialized MR sequences may have potential to evaluate acute axon injury, susceptibility to axonal loss, the composition of inflammatory infiltrates, and the potential for remyelination and efficacy of neural repair (Figure 6).
Challenges of optic nerve MRI
Optic nerve measures 3–4 mm in diameter in a healthy subject, less in someone with long-standing MS due to atrophy. High spatial resolution is a requisite for deriving reliable imaging measures of the optic nerve. The optic nerve is surrounded by different imaging interfaces, such as cerebral spinal fluid, orbital fat, air within sinuses, and bone. These different tissue interfaces create potential for imaging artifacts to negatively impact scan quality. Additionally, optic nerve imaging is impacted by eye or head movement, both of which can degrade image quality. Even arterial pulsations may negatively impact high-resolution quantitative techniques. The fast acquisition times and immediate processing of OCT does have an advantage for patient optimization and high-quality scans.
Optic nerve imaging in clinical practice is utilized frequently and with a high degree of success. However, investigational techniques require high-resolution and high signal-to-noise ratio (SNR), two qualities that require time and increase the chances for excessive movement. As the resolution increases, so must the scanning time and propensity to movement and other potential artifacts.
Optic nerve MRI in clinical practice
Standard optic nerve imaging includes high-resolution sequences in axial, sagittal, and coronal views. T2-weighted short tau inversion recovery (STIR) sequence is utilized to assess the presence of abnormal T2 hyperintense signal within the nerve, can provide information about whether the nerve is swollen or atrophic, and can assess for other impinging or infiltrating structures on the optic nerve [4]. A fat-suppressed T1-weighted sequence after administration of Gadolinium contrast can assess for the presence of blood–brain barrier breakdown, frequently seen in the acute setting of optic neuritis [5, 6].
T1-weighted sequences after administration of gadolinium reveals optic nerve enhancement with a sensitivity of 66–94%, typically lasting 1–2 months [7]. While optic nerves with more extensive enhancement had worse vision acutely, the association of final clinical outcome to enhancement length and presence of enhancement in the intracanicular portion of the optic nerve has conflicted among investigations [7–10]. Owing to the high sensitivity for contrast enhancement in the setting of acute optic neuritis, the absence of enhancement should at least make one consider an alternate diagnosis, such as ischemic optic neuropathy [11].
T2-weighted signal abnormalities can be observed in both the acute and chronic setting of optic neuritis. The length of chronic optic nerve hyperintensity has been demonstrated to correlate with thinning of the retinal nerve fiber layer (RNFL) by OCT [12]. However, MRI hyperintense lesion length did not appear to correlate with clinical outcomes. The decision to treat optic neuritis with anti-inflammatory glucocorticoids should be made on clinical and individual patient circumstances, as intravenous methylprednisolone did appear to shrink the resultant length of MRI hyperintense T2-signal within the optic nerve [13].
Optic nerve volumes
Volumetric measures of the CNS can serve as a surrogate of axonal loss and perhaps demyelination. Unfortunately, tissue volume measures also involve a number of confounding pathologic processes such as edema, cellular infiltration, and gliosis [14–16]. The time course of optic nerve volume changes has relevance for interpreting studies of OCT with regard to timing. Due to the inflammation and edema, the optic nerve can have prominent swelling during the acute period, with a mean 20% expansion over control nerve, and remain swollen for up to 60 days [17]. One year after optic neuritis, the nerve becomes atrophic by 14% compared to control.
While the more severely swollen optic nerves had worse baseline visual function, neither the amount of swelling nor the amount of atrophy predicted clinical visual outcomes at one year. Similar to what was observed with intravenous methylprednisolone and chronic T2-weighted lesion length, glucocorticoids did not appear to impact the degree of optic nerve atrophy when administered in the acute setting [18]. This implies that anti-inflammatory agents have little effect on axonal injury, even when administered within days of optic neuritis clinical onset [19]. This also illustrates how the visual pathway can provide important information about MS pathogenesis and treatment effect (or lack thereof).
Optic nerve diffusion tensor imaging
Diffusion tensor imaging (DTI) is a quantitative technique that can assess tissue directionality and integrity. Because the visual system is a tightly packed, structured tract of axons and myelin, DTI can be utilized to define the location and trajectory of the visual pathways. Diffusion imaging is based upon the Brownian motion of protons, which will diffuse along the trajectory of the axon. Mean diffusion will increase when there is loss of tissue.
DTI is acquired in six or more directions, and the largest direction of diffusion within a voxel is called the principal eigenvector. The principal eigenvector is referred to as lambda-1. By convention, eigenvectors perpendicular to lambda –1 include lambda-2 and lambda-3. From these eigenvectors, one can derive several interrelated DTI parameters to summarize and describe the diffusion within a specified voxel. Lambda-1, or the principal eigenvector, is sometimes referred to as axial diffusivity and has been proposed to be a surrogate for axonal injury during acute inflammation [20–23]. Radial diffusivity is the mean of the two perpendicular diffusivities (lambda-2 plus lambda-3 divided by 2) and has been proposed as a marker of both demyelination and tissue integrity [24–27]. DTI summary parameters include mean diffusivity (lambda1 + lambda2 + lambda 3/3) and fractional anisotropy, a scalar value of a directional ellipsoid between zero to one. Axial diffusivity and fractional anisotropy both imply a principal direction in their measure.
In remote optic neuritis, radial diffusivity and fractional anisotropy of the optic nerve have established strong correlations with RNFL by OCT, high- and low-contrast vision, and visual-evoked potentials (Figure 16.2) [26, 28–31]. Similarly, FA and radial diffusivity of the optic radiations have been demonstrated to correlate with RNFL, multifocal VEPs, and visual acuity [31–33]. These studies help to cross-validate OCT and DTI because they hold high concordance among all outcome measures despite assessing two different areas of the optic nerve, with vastly different techniques and methodologies.
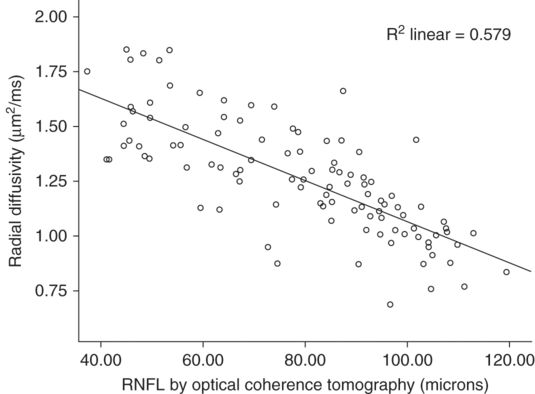
Correlation of optic nerve radial diffusivity with retinal nerve fiber layer thickness. Retinal nerve fiber layer thickness has a striking correlation with radial diffusivity within the optic nerve. The correlation cross-validates the techniques for assessing tissue integrity within the anterior visual pathway when also considering the robust relationship to clinical outcomes for each methodology. Radial diffusivity measures included 1–2 mm of the optic nerve, a location contiguous but separated in space from the RNFL.
(Reproduced with permission from Naismith et al, Neurology, 2009)
In contrast to remote optic neuritis studies previously discussed, acute optic neuritis must be interpreted through a different set of DTI parameters, underscoring the importance of clinical correlation and a temporal evaluation. After acute optic neuritis, axial diffusivity has been found to be depressed for one to three months, followed by a period of apparent “normalization” around six months, and finally elevation of axial diffusivity after one year [34, 35, http://journals.plos.org/plosone/article?id=10.1371/journal.pone.0083825]. The precise etiology for this decrease is not clear, but an explanation can include axonal swelling and beading as a result from mitochondrial dysfunction, cytotoxic edema, and aggregation of intracellular proteins with increased intracellular viscosity and impaired fast transport through microtubules. This initial depression in axial diffusivity has been found to correspond to long-term outcomes of RNFL by OCT, high- and low-contrast sensitivities, and visual evoked potentials at 6 and 12 months. The other DTI parameters, mean and radial diffusivities, and fractional anisotropy, do not appear to convey this acute alteration. Three months after optic neuritis onset, radial diffusivity begins to increase and reaches a plateau between 6 to 12 months. This increase in radial diffusivity has also been shown to correspond to RNFL and visual function parameters. The increases in axial and radial diffusivities between three and six months might be explained by axonal drop-out and loss of tissue integrity, both of which would result in an increased total diffusivity within the affected voxel. The MS lesions thus have a variety of pathologies which can change over time.
Optic nerve magnetization transfer imaging
Magnetization transfer imaging (MTI) is a quantitative technique proposed for the assessment of tissue macromolecules such as myelin. The technique uses an off-resonance radiofrequency pulse to saturate macromolecular protons rather that the standard pulse that saturates protons within the liquid pool. This hydrogen saturation is transient as the energy is transferred from the immobile macromolecular hydrogen pool to the free-water hydrogen pool, thus decreasing the free water signal in a predictable manner. By evaluating the ratio (MTR) of the saturated and the unsaturated sequences, one can obtain an indirect measure of macromolecular concentration and, thus, myelin [36]. MTR is beginning to be utilized to assess therapies designed to preserve myelin or enhance remyelination in MS.
On a cross-sectional basis in remote optic neuritis, optic nerve MTR has correlated with RNFL thickness and macular volumes by OCT, and visual evoked potential latency and amplitude [37, 38]. In longitudinal studies, MTR does not appear to be substantially impacted in acute optic neuritis [39, 40]. Rather, MTR appears to decrease between 3 and 6 months after optic neuritis clinical onset and, at that time, has been found to correlate with 12-month RNFL by OCT, high- and low-contrast visual acuity, and multifocal VEP. Subsequent to 6 months, MTR can appear to increase and improve for some patients, remain stable, or continue to drop through 12 months. The trend towards increasing MTR after 6 months has been hypothesized to represent remyelination post inflammation, and these post-6 month changes have been found to correspond to less volume loss in 12 month RNFL compared with those whose MTR continued to have a late decline [40].
Conclusions
Optic nerve MRI opens new opportunities to test novel imaging techniques and provide critical structural and metabolic information about the central nervous system in demyelinating diseases. One of the major goals of MR imaging is to develop a sequence with pathologic specificity to axon injury, myelin loss, and inflammation. Incorporation of OCT and VEPs with imaging helps to validate the degree to which the MRI technique discerns axonal and myelin pathologies. While the perfect technique for accomplishing this specificity has not been definitively established, optic nerve imaging has most certainly brought the MS field closer to this realization. Similarly, OCT in MS seeks to meet some of these needs to study inflammation and neurodegeneration.
References
Related posts:
 Optical coherence tomography and low-contrast acuity
Introduction to optical coherence tomography in neurological diseases
Optical coherence tomography in acute optic neuritis
Optical coherence tomography and electrophysiology of the visual pathway
Optical coherence tomography and visual outcomes in acute optic neuritis
Optical coherence tomography in a multi-center setting: quality control issues
Optical coherence tomography and low-contrast acuity
Introduction to optical coherence tomography in neurological diseases
Optical coherence tomography in acute optic neuritis
Optical coherence tomography and electrophysiology of the visual pathway
Optical coherence tomography and visual outcomes in acute optic neuritis
Optical coherence tomography in a multi-center setting: quality control issues
Stay updated, free articles. Join our Telegram channel

Full access? Get Clinical Tree


