Multimodal Monitoring of EEG and Evoked Potentials
Gert Pfurtscheller
GENERAL ASPECTS
The most comprehensive form of monitoring of cerebral functioning is obtained when electroencephalograph (EEG) and different modality-evoked potentials (EPs) are recorded and analyzed continuously and simultaneously. This means that EEG spectra, brainstem auditory-evoked potentials (BAEPs), and cervical and cortical somatosensory-evoked potentials (SEPs) are computed at intervals of seconds to minutes and displayed in a compressed form. In addition to EEG and EPs, other physiological signals, such as heart rate (HR), ventilation, temperature, oxygen saturation, and blood pressure, may be useful, depending on the particular condition. This monitoring can be performed in the operating room, in the intensive care unit (ICU), in the sleep laboratory, or in the outpatient clinic. For extensive literature on this subject, see Nuwer (1) and Chapters 39, 40, and 41 of this book.
TECHNICAL ASPECTS OF CONTINUOUS MONITORING OF EEG SPECTRA COMBINED WITH EPs
The techniques necessary for long-term monitoring of EEG and BAEPs were established in normal subjects by Maresch et al. (2). They used two EEG channels (Cz-A1 and Cz-A2) with broadband amplifiers (1.5 Hz to 1.5 kHz); after amplification the signals were divided into low-frequency (EEG; lower cut-off frequency 30 Hz) and high-frequency (BAEP; upper cut-off frequency 250 Hz) branches. In other studies these responses were complemented with recordings of SEPs (3,4). The main technical considerations in this type of analysis are that (a) different sampling frequencies must be used because of the rather different frequency contents of the signal, for example, EEG and BAEP; and (b) the number of samples should be minimized to save memory storage, since the analysis must be done over long periods of time. A way to solve these technical problems is introduced in Figure 58.1 by the sampling schema.
Measurements in the operating room or ICU may be easily affected by noise. To avoid main artifacts (50 or 60 Hz), the interstimulus interval between auditory and somatosensory stimulation should be variable. More specifically, intervals should be alternatively small or large (e.g., to cancel 50 Hz: auditory stimulation 110/90 msec; somatosensory stimulation 210/190 msec). In addition, the stimuli should be applied either on the positive or negative peak of the main frequency EEG component. With this technique, fairly good results are obtained in unshielded rooms and with electrical equipment nearby.
LONG-TERM MONITORING IN THE INTENSIVE CARE UNIT
A great number of patients in the ICU are comatose or recovering from coma, since coma can be caused by many disorders including severe head injury, vascular lesions, encephalitis, posthypoxic or postischemic events, and drug intoxication, among others. The monitoring of ICU patients is important to detect critical situations as fast as possible, to facilitate therapeutic decisions, to monitor the level of impaired consciousness, and to predict the clinical outcome. Another important feature in the ICU is the determination and documentation of brain death, which is a prerequisite for most organ transplantations. The following case report of a patient with unfavorable outcome underlines the importance of monitoring of comatose patients:
A 57-year-old woman with hypernephroma suffered from hypertension for several years. She was admitted with a left hemisphere hemorrhage and was soporous. She had a right hemiplegia and responded appropriately to painful stimuli on the left side. The dominant EEG frequency was 5 to 6/sec, and there was a delta-wave focus over the left hemisphere. On the first day, a ventricular drainage of cerebrospinal fluid was performed. In the following 6 days, the patient’s condition deteriorated. After 2 days, she developed anisocoria. One day later, respiration was insufficient. The patient showed extensor responses to painful stimuli. After 5 days, pupillary light reaction and ciliospinal, cornea, and oculocephalic reflexes were negative, and there was no longer any reaction to painful stimulation. The cranial computed tomography (CT) scan showed an enlargement of the hemorrhage and signs of an increased intracerebral pressure (ICP).
Figure 58.2 shows the various parameters registered from the time of admission, throughout the critical rise of ICP, and until brain death was clinically determined. Five days after admission, at 6:20 AM, the intracranial pressure rose to a critical level of 56 mm Hg, in spite of the ventricular drainage. Amplitudes of the cortical SEPs decreased and finally disappeared 30 minutes later. The peak of the EEG spectra shifted to lower frequencies. Pathological HR and heart rate variability (HRV) were observed. Seven hours later, BAEP components IV/V vanished; another 30 minutes later, wave III disappeared, and 60 minutes later, all BAEP components were abolished.
This example provides evidence that monitoring of only one signal gives incomplete information. From the SEPs alone, it can be seen that the cortical component disappeared at 6:50 AM, whereas the cervical component remained unchanged for about 8 additional hours. The cortical component N20 is very sensitive to
ischemia (6), and its disappearance signals that cortical damage occurred early in the morning. BAEPs show gradual deterioration of the waves V, IV, III, and II in the time between the disappearance of the cortical and cervical SEP components. This can be interpreted to mean that the brainstem function deteriorated during that time (starting from the midbrain level). In summary, it is clear that the most comprehensive picture of the cerebral state in comatose patients can be obtained only by monitoring different neuronal systems and signals with use of EEG, SEPs, and BAEPs.
ischemia (6), and its disappearance signals that cortical damage occurred early in the morning. BAEPs show gradual deterioration of the waves V, IV, III, and II in the time between the disappearance of the cortical and cervical SEP components. This can be interpreted to mean that the brainstem function deteriorated during that time (starting from the midbrain level). In summary, it is clear that the most comprehensive picture of the cerebral state in comatose patients can be obtained only by monitoring different neuronal systems and signals with use of EEG, SEPs, and BAEPs.
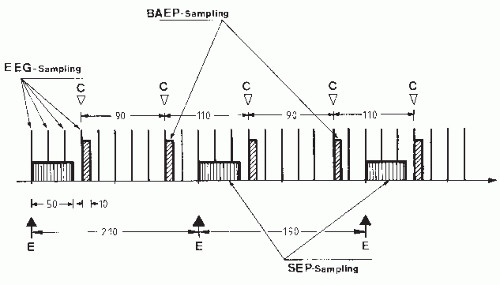 Figure 58.1 Sampling scheme of EEG, somatosensory-evoked potential (SEP), and brainstem auditory-evoked potential (BAEP) during computer-controlled click (C) and electrical (E) median nerve stimulation as used for the data displayed in Figures 60.2 and 60.3B; sampling and electrical and auditory stimulation are indicated. BAEP sampling lasts for 10 msec, SEP sampling for 50 msec, the SEP sampling window is variable in a range of 90 msec. Computer-controlled SEP stimulation in intervals of 210/190 msec and BAEP stimulation in intervals of 111/89 msec. |
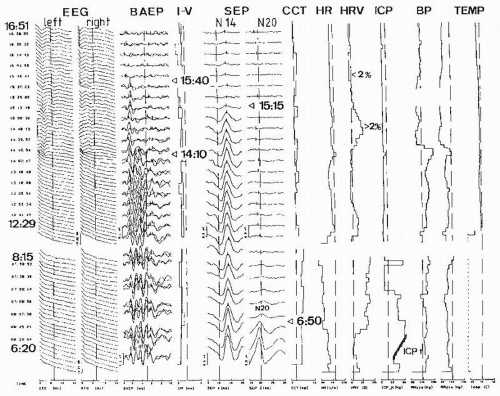 Figure 58.2 Protocol from a 57-year-old patient with a left hemispheric hemorrhage during deterioration of the comatose state and ending with brain death. From left to right: compressed EEG spectra from left and right hemispheres; brainstem auditory-evoked potential (BAEP) to ipsi- and contralateral ear stimulation; BAEP interpeak latency (I-V); cervical (N14) and cortical (N20) SEPs; central conduction time (CCT); heart rate (HR); heart rate variability (HRV); intracranial pressure (ICP); systolic (Bpsys) and diastolic (Bpdia) blood pressure; and rectal body temperature (TEMP). Important events are indicated by arrows. For further explanation, see text. Modified from Hilz MJ, Litscher G, Weis M, et al. Continuous multivariable monitoring in neurological intensive care patients—preliminary reports on four cases. Intensive Care Med. 1991;17:857-893.
Related posts:Stay updated, free articles. Join our Telegram channel
Full access? Get Clinical Tree
 Get Clinical Tree app for offline access

|
