How tall is the child?
What is the child’s sitting height?
How long is the subischial leg length?
How much has the child grown in a single year?
What is the child’s chronologic age?
What is the bone age?
How much growth does the child have left in the trunk and in the lower limbs?
Exactly what point has the child reached on his or her developmental peak?
Where is the child in relation to puberty and the pubertal peak?
What about the Tanner signs?
Are the child’s proportions within normal limits?
How much does the child weigh?
4.2 Biometric Measurements
There is not much useful data that can be obtained from a single measurement. A single measurement can be an error, and two measurements constitute an indication, while three measurements define a tendency.
Measurements of growth should be taken at regular intervals. Checking the child every 6 months, one of the two checkups being preferably around his or her birthday, allows an easy assessment of the growth velocity of the child and the different body segments [20, 24, 26]. These measurements provide a real-time image of growth, and when carefully recorded in a continually updated “growth notebook,” they provide charts that make decisions easier. Growth velocity is an excellent example, because it provides the best indicator of the beginning of puberty, on which so many decisions rest. The first sign of puberty is the increase in growth rate of the standing height to more than 0.5 cm/month or more than 6 cm/year.
The spine surgeon should be familiar with the measurements of these parameters. Regarding standards of growth, several good references are available [3, 20, 24, 26, 35, 37, 50].
4.2.1 Standing Height
Standing height is necessary but is not sufficient to assess growth.
Measuring the height is to the orthopedic specialist as listening to the heart is to the cardiologist. In children younger than 5 years, standing height is measured with the child lying down because in this age group, this position is both easier and more reliable [20, 24, 26].
Between birth and maturity, the body will grow by approximately 1.20 m, or even 1.30 m. Growth is brisk up to 5 years of age. After that, it slows considerably until the onset of puberty, which occurs at approximately 11 years in girls and 13 years in boys. At 2 years of age, the standing height is approximately 50 % of the adult height; at 5 years of age, it is approximately 60 %; by the age of 9 years, approximately 80 %; and at puberty, approximately 86 %. In this latter period, standing height increases more rapidly.
Standing height is a global marker and is composed of two specific measurements known as subischial height (i.e., the growth of the lower limbs) and sitting height (i.e., the growth of the trunk). These two different regions often grow at different rates at different times, which is valuable information for decisions in orthopedics. Values for the standing heights of girls and boys at various ages were given in previous publications [59–61].
4.2.2 Sitting Height
Sitting height is the most reliable parameter to monitor trunk growth.
In children 2 years of age or younger, the sitting height is measured with the child lying down for the same reasons that the standing height is also measured supine in this age group. After 2 years of age, the child to be measured should be placed on a stool or table at a convenient height. The most important consideration is that the child should always be measured under the same conditions using the same measuring instruments. The sitting height averages 34 cm at birth and averages 88 cm for girls for a standing height of 165 cm at skeletal maturity and 92 cm (sitting height) for boys at the end of growth for a standing height of 175 cm [20, 22, 24, 26, 52] (Figs. 4.1, 4.2 and 4.3).
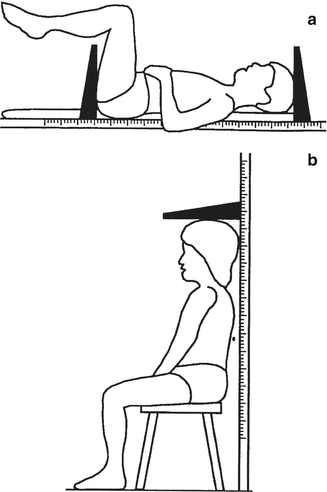
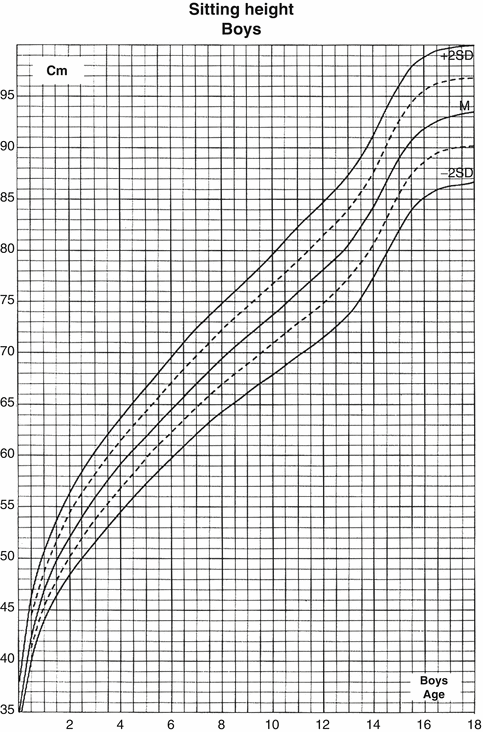
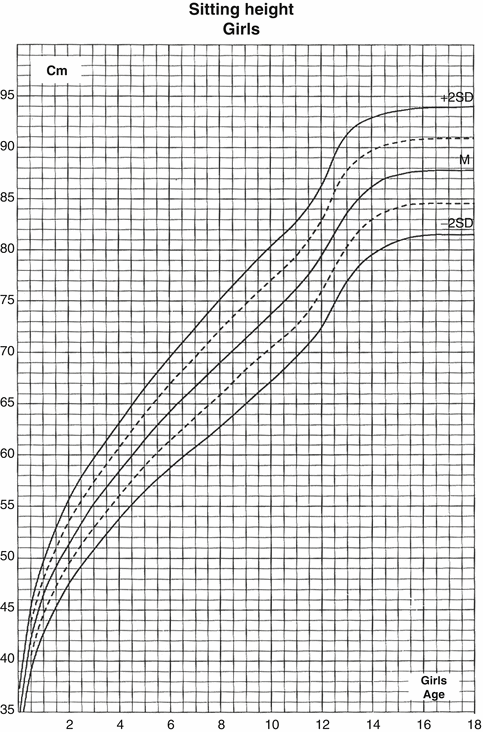

Fig. 4.1
Sitting height measurement: in children younger than 2 years (a) and in children older than 2 years (b)

Fig. 4.2
Sitting height-for-age (birth to 18 years: boys)

Fig. 4.3
Sitting height-for-age (birth to 18 years: girls)
In patients with scoliosis, it can be instructive to follow the changes in the sitting height rather than in the standing height. If a 6-year-old girl with juvenile scoliosis is being treated, her sitting height will be approximately 64 cm and will increase to about 88 cm. Therefore, the spine surgeon will have to control the spinal curve while her trunk grows 24 cm. The measurement of sitting height can also be useful in anticipating the onset of puberty. In an average population, puberty starts at approximately 75 cm sitting height in girls and 78 cm in boys. When the sitting height is approximately 84 cm, 80 % of girls have menarche (Figs. 4.4, 4.5 and 4.6).

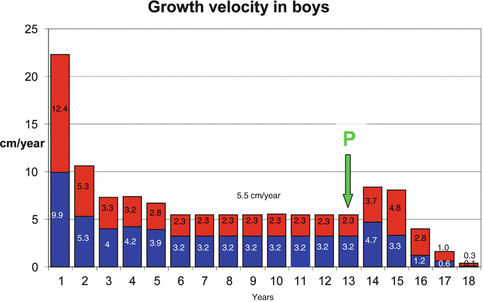
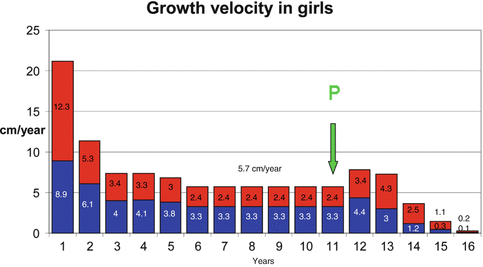

Fig. 4.4
Sitting height and lower limb length proportion. Sitting height is 65 % of standing height at birth and 52 %, at 12 years

Fig. 4.5
Growth velocity of sitting height (red) and lower limb (blue) in boys (1–18 years). Green arrow indicates beginning of growth spurt (P)

Fig. 4.6
Growth velocity of sitting height (red) and lower limb (blue) in girls (1–16 years). Green arrow indicates beginning of growth spurt (P)
4.2.3 Subischial Limb Length
Where does growth come from? Is it from the trunk or from the legs?
The segment of the body consisting of the lower extremities is measured to determine the subischial limb length. As implied by the name, subischial limb length is measured by subtracting the sitting height from the standing height.
At birth, the subischial limb length averages 18 cm. At the completion of growth, it will average 81 cm in boys and 74.5 cm in girls. These 63 cm of growth in boys and 56.5 cm of growth in girls contribute to a far greater percentage of growth in height than does trunk growth. This accounts for the changing proportions of the body during growth (see Figs. 4.4, 4.5, and 4.6).
4.2.4 Arm Span
Measuring arm span is useful in non-ambulatory children.
The measurement of arm span provides an indirect control parameter for the measurement of standing height. Combining these two measurements avoids virtually all errors. To measure arm span, the patient simply raises the arms to a horizontal position, and the distance between the tips of the middle fingers is measured with a tape measure. There is an excellent correlation between arm span and standing height, as standing height is about 97 % of arm span. If the trunk is normal (i.e., without deformity), its length will be equal to approximately 52 % of arm span, and the lower limbs will be equal to approximately 48 % or will be the same as their proportions in the standing height.
The relation of arm span to normal height is useful in determining the normal height of a child who is wheelchair bound; this allows the calculation of the child’s height [39]. It is a routine used for any child who has a spine deformity (e.g., scoliosis) for calculating the normal values for pulmonary function. With spinal deformity, arm is a good estimate of what the standing height would be if there were no scoliosis.
4.2.5 Weight
Weight is often an underestimated parameter.
Weight should always be brought into the equation when making a surgical decision, whether the orthopedic is dealing with a case of idiopathic scoliosis or paralytic scoliosis. Children should always be weighed at consultations. There may be striking morphologic changes from 1 year to the next. If weight evaluation becomes an integral part of each consultation, changes will become obvious and can be incorporated into the orthopedic specialist’s deliberations. A simple trend in the increase in a boy’s weight is 18–20 kg at 5 years of age, 30 kg at 10 years of age, and 60 kg at 17 years of age [26]. Note that weight doubles between 10 and 17 years of age. At 5 years of age, the child’s weight reaches 32 % of the final normal weight, yet only 48 % of the final normal weight is achieved at 10 years of age. In a patient whose weight is 10 % or more above normal, a scoliosis brace may no longer correct the spinal curve as it did before. A low weight, on the other hand, can explain the delay in the onset of menarche because girls generally need to attain a weight of 40 kg for menarche to occur. Hypotrophy is frequent in severe infantile scoliosis. A generally accepted estimate of body fat is expressed in the Quetelet body mass index: weight (kg)/height (m2). Using this index, 20–25 kg/m2 is normal, 25–30 kg/m2 is moderate obesity, 30–40 kg/m2 is major obesity, and more than 40 kg/m2 is morbid obesity. Obesity is a major problem in Willi–Prader syndrome with scoliosis [20, 24, 26].
4.2.6 The Multiplying Coefficient
Lefort [42] outlined the concept of “multiplying coefficient,” which can be applied to growth measurements in children at any age. This has also been extensively described by Paley et al. [49]. It is easy to calculate this coefficient, which is obtained by considering the percentage of growth that has been attained. For example, once a child has reached 40 % of his or her expected adult standing height, the multiplying coefficient can be calculated as 100/40 = 2.5. The multiplying coefficient can be applied to all biometric data – standing height, sitting height, subischial limb length, and length of the femur, tibia, humerus, radius, and ulna.
At birth, the sitting height of boys reaches 37 % of its final value. The multiplying factor is 2.85. At 10 years, sitting height of boys reaches 77 % of its final value; the multiplying factor is 1.28.
4.3 Chronology
4.3.1 Intrauterine Development
The most significant growth occurs during intra-uterine life.
Growth starts before birth. During the first trimester of gestation, the systems are busy organizing themselves and develop at a brisk pace [34, 46]. During this period, the fetus makes daily progress, so that when the infant is born, it reaches a weight 6 million times that of the original egg. By the second month of life, the sitting height increases at a rate of 1 mm daily, which subsequently increases to 1.5 mm/day. Were this rate of growth to continue until the age of 10 years, the child would ultimately stand 6 m tall [6, 20, 24, 26, 34, 62].
From the third month onward, the embryo becomes a fetus and turns into a miniature adult. At the end of the second trimester of gestation, the fetus reaches 70 % of its expected length at birth (it measures 30 cm at this stage) but achieves no more than 20 % of the expected birth weight (it weighs approximately 800 g). During the third trimester, the fetus gains weight at the highest rate (700 g/month). This means that various stages of growth do not occur simultaneously during intrauterine life. Length increases steadily and rapidly during the first 6 months in utero, whereas weight gain is most rapid during the final 3 months of gestation.
With high-resolution ultrasonography, it is possible to follow the growth of the fetus and to detect even the slightest abnormality. It can be anticipated that many orthopedic spine conditions characterized by abnormal growth will be diagnosed prenatally.
4.3.2 From Birth to 5 Years
About 50 % of trunk growth occurs during the first 5 years of life. It is a critical period for early-onset spinal deformities.
Birth marks a very obvious transition in the growth of the child. After birth, not only does the overall rate of growth vary at different ages, but also the rates at which various segments of the body grow differ. For example, during the first 5 years of life, sitting height and subischial leg length increase at about the same rate; from 5 years of age to puberty, the sitting height accounts for one-third of the gain and the subischial limb length accounts for two-thirds; from puberty to maturity, the ratio is reversed, with the sitting height accounting for two-thirds of the gain in height and the subischial limb length accounting for one-third. The extent of increase in sitting height and subischial leg length for boys and girls of various ages are shown [20, 22–24, 26].
At birth, the standing height of the neonate (50–54 cm) is 30 % of the final height. By 5 years of age, the standing height increases to 108 cm, which is double the birth height and 62 % of the final height. The first year of life sees particularly vigorous growth rates, with the infant’s height increasing by 22 cm. This means that the height gain during a single year is as great as it is during the entire surge of puberty. After the age of 1 year, the growth rate starts to slow down but remains strong, with the infant growing another 11 cm between 1 and 2 years of age and 7 cm between 3 and 4 years of age.
At birth, the sitting height of the neonate is approximately 34 cm, which is roughly two-thirds of the standing height and 37 % of the final sitting height. The sitting height gains about 12 cm from birth to age 1 year; 5.3 cm from 1 to 2 years; 3.3 cm from 2 to 3 years; 3.2 cm from 3 to 4 years; and 2.8 cm from 4 to 5 (average) years. In 5 years, the trunk gains about 28 cm for girls and 29 cm for boys, much more than during the puberty spurt (11.5 cm for girls, 13 cm for boys). During the first 5 years of growth after birth, the proportions change. The cephalic end of the body becomes relatively smaller, whereas the subischial leg length increases. During this period, growth is not only a vertical phenomenon but also a volumetric one.
At birth, weight is between 3000 and 3500 g, which is 5 % of the final figure. At 5 years of age, the weight averages 18–20 kg, which is 32 % of the final adult weight. In 5 years, the weight gain is 15–17 kg. Birth weight triples in a single year and quadruples by the age of 3 years. The circumference of the chest is 32 cm at birth but increases by 25 cm to reach 57 cm by the age of 5 years [2, 3, 8, 45]. Chest morphology has undergone dramatic changes (see Figs. 4.5 and 4.6).
4.3.3 From 5 Years to Beginning of Puberty: A Steady Period
Before puberty, trunk growth slows down.
Between 5 years of age and the onset of puberty, 11 years of bone age in girls and 13 years of bone age in boys, there is a marked deceleration in growth, with standing height increasing at approximately 5.5 cm/year. About two-thirds of this growth (3.2 cm) occurs in the lower limb, and about one-third (2.3 cm) occurs in the sitting height. The trunk is now growing at a slower rate, whereas the lower limbs are growing faster than the trunk, thereby altering the proportions of the body. During this period, in boys, standing height will increase by 27 % (approximately 44 cm); sitting height, by 20 % (approximately 18 cm); and subischial limb length, by 32 % (approximately 26 cm); in girls, standing height will increase by 22 % (approximately 34 cm); sitting height, by 17 % (approximately 14 cm); and subischial limb length, by 28 % (approximately 20 cm) [20, 22–24, 26]. By 5 years of age, the sitting height increases to 60 cm, approximately 66 % of the final sitting height, with only another 26–30 cm to grow. This information is useful in anticipating the effects of deformity and the consequences of arthrodesis in spinal deformity in young patients.
From 5 years of age to the beginning of puberty, the average weight gain is about 2.5 kg/year [26]. At 10 years of age, the weight represents about 50 % of the final weight. In contrast, the standing height at this age is 78 % of the final standing height in the case of boys and 83 % in the case of girls [26].
4.3.4 Puberty: A Turning Point
Puberty is a very challenging period for children with early-onset scoliosis.
At the beginning of puberty, approximately 22.5 cm of growth remains to be attained in standing height (12.5 cm in sitting height and 10 cm in lower limb) in the case of boys and 20.5 cm (11.5 cm in sitting height and 9 cm in lower limb) in the case of girls (Figs. 4.7, 4.8, 4.9, and 4.10).
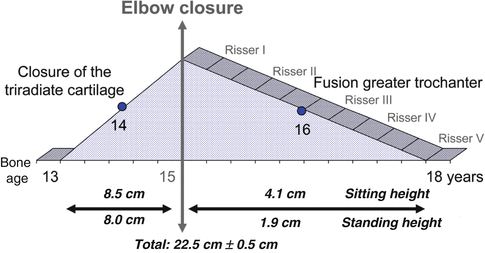
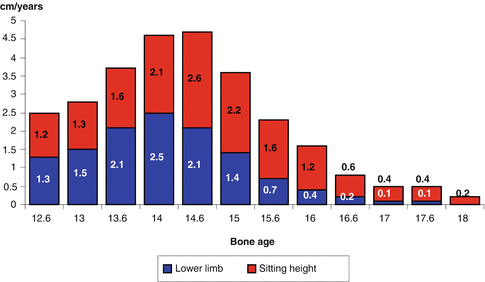
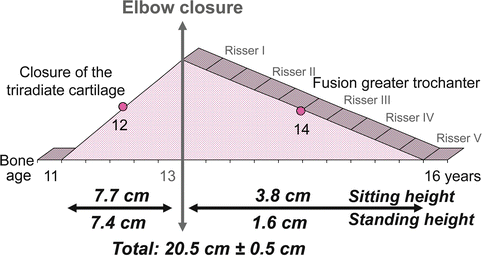
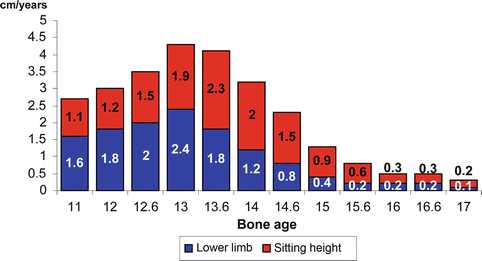

Fig. 4.7
Pubertal diagram in boys

Fig. 4.8
Growth velocity for bone age (boys). The peak velocity of growth during puberty occurs between 13 and 15 years of bone age in boys

Fig. 4.9
Pubertal diagram for girls

Fig. 4.10
Growth velocity for bone age (girls). Menarche usually occurs on the descending side, after elbow closure at 13 years 6 months bone age, around Risser I
Chronologic age is a poor indicator of puberty. We may start anticipating puberty at 10 years of age in girls and 12 years in boys. The acceleration in growth velocity best characterizes the beginning of puberty. From a clinical viewpoint, puberty will be recognized by a combination of factors other than growth: sexual development, chronologic age, and bone age. After 11 years of age, the growth patterns of boys and girls proceed differently. On an average, girls will experience the onset of puberty at 11 years (bone age) and boys, at 13 years (bone age). Puberty, and its accompanying rapid growth, is a period of great importance to the orthopedic surgeon. It is therefore crucial to recognize the period just before puberty.
There are four main characteristics that dominate the phase of growth called puberty:
1.
Dramatic increase in stature
2.
Change in the proportions of the upper and lower body segments
3.
Change in overall morphology: biachromial diameter, pelvic diameter, fat distribution, and so on [32]
4.
Development of secondary sexual characteristics
During puberty from 11 to 15 years of age in girls and from 13 to 17 years in boys, there is a dramatic increase in the growth rate. However, during this period, the growth is far more noticeable in the trunk than in the lower limbs: two-thirds of the growth goes toward increasing sitting height, and only one-third is toward increasing subischial limb length. It is during this period that boys overtake girls in height. On an average, boys are between 12 and 15 cm taller than girls. This is accounted for by two factors. First, boys have approximately 2 years of growth more than girls. Second, boys have a slightly greater increase in the rate of growth during puberty than do girls, accounting for approximately 2 cm of additional height [20, 24, 26].
During puberty, the standing height increases by approximately 1 cm/month. At the onset of puberty, boys have 14 % (±1 %) of their remaining standing height to grow; this is approximately 22.5 cm (±1 cm), made up of 12.5 cm in sitting height and 10 cm in subischial limb length. Girls have 13 % (±1 %) of their standing height to grow. This is approximately 20.5 cm (±1 cm), made up of 11.5 cm in sitting height and 9 cm in subischial length.
The peak velocity of growth during puberty occurs between 13 and 15 years of bone age in boys and between 11 and 13 years of bone age in girls. After bone age of 13 years in girls and 15 years in boys, there is a considerable decrease in the annual velocity of height gain. The lower limbs stop growing rapidly; the total remaining growth is 5.5 cm, about 4 cm in the sitting height and about 1.5 cm in the lower limb. This variation in growth velocity is an extremely important factor to consider in the treatment of many disorders, especially scoliosis and limb-length discrepancy.
These figures, ratios, and rates provide only a partial view of the growth phenomenon. Precise evaluation of the characteristics of puberty, using the bone age assessment, the Tanner classification, the onset of menstruation, the Risser sign, and the annual height velocity, is something that needs to be undertaken with a great deal of care and consideration. One of the major problems with using only the onset of menarche and the Risser sign is that they occur after the growth associated with puberty has begun to slow.
4.3.5 Secondary Sexual Characteristics
Observe the child and consider biological age.
Secondary sexual characteristics develop throughout the course of puberty; the first appearance of pubic hair, the budding of the nipples, and the swelling of the testes are the first physical signs to signal the onset of puberty. The first physical sign of puberty in boys, testicular growth in 77 %, occurs, on average, 1.7 years before the peak height velocity and 3.5 years before attaining adult height [53]. The bone age will be approximately 13 years at the onset of puberty; the Risser sign is 0, and the triradiate cartilage is open.
The first physical sign of puberty in girls, breast budding in 93 %, occurs about 1 year before peak height velocity [26]. This averages 11 years in bone age. The Risser sign is still 0, and the triradiate cartilage is still open at the onset of puberty. Menarche occurs about 2 years after breast budding, and final height is usually achieved 2.5–3 years after menarche. After menarche, girls will gain the final 5 % of their standing height, about 3–5 cm [26]. The appearance of axillary hair, although variable, occurs after the peak of the pubertal growth diagram.
The secondary sexual characteristics generally develop in harmony with bone age, but there are discrepancies in 10 % of cases. Puberty may be accelerated and growth can end more quickly than usual, catching the unwary physician off guard. In fact, it has been demonstrated that it is not uncommon to see an acceleration of the bone age during puberty.
4.3.6 Pubertal Diagram and Peak Height Velocity
Peak height velocity is not a single point on a chart.
Using all of these landmarks, it is possible to draw a diagram relating the events occurring during puberty. Even if one indicator is missing or does not match the other, it is still possible to have a good idea of where the child is, on his or her own path through puberty. By plotting the gains in standing height and sitting height every 6 months, a picture of the period of puberty is developed (Figs. 4.7, 4.8, 4.9 and 4.10). It is also easy to divide this into two parts. The first phase (i.e., the ascending phase of the growth velocity curve) is characterized by an increase in the velocity of growth and is the major portion of the pubertal growth spurt. The second phase (i.e., the descending phase of the growth velocity curve) is characterized by a slowing of the rate of growth [57].
The first phase of the pubertal growth spurt is the ascending phase, which corresponds to the acceleration in the velocity of growth. This phase lasts 2 years, from approximately 11 to 13 years of bone age in girls and from 13 to 15 years of bone age in boys. The gain in standing height in girls during this phase is about 15.1 cm, made up of 7.7 cm in sitting height and 7.4 cm in subischial limb length. The gain in standing height in boys during this phase is about 16.5 cm, made up of 8.5 cm in sitting height and 8 cm in subischial limb length. During this first phase of pubertal growth spurt, the increase in sitting height contributes 53 % and the increase in subischial length contributes 47 %. Therefore, more growth comes from the trunk than from the legs during this phase growth.
The peak height velocity occurs on the ascending side of the growth velocity curve. It does not occur at just one point on the curve but takes place during a period of 2 years [26, 54]. It can be roughly identified by accurate assessment of standing height and sitting height at 6-month interval.
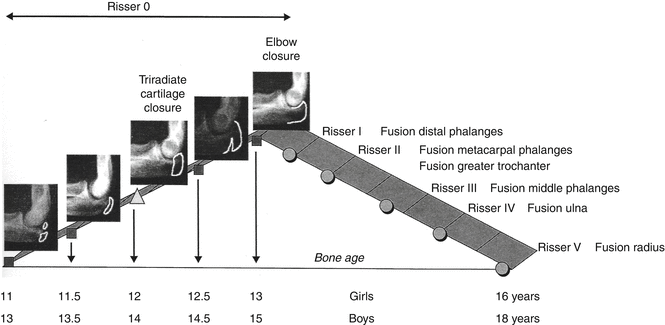
Triradiate cartilage closure occurs about halfway up the ascending phase of the pubertal growth velocity diagram. This closure corresponds to an approximate bone age of 12 years in girls and 14 years in boys. After closure of the triradiate cartilage, there is still a considerable amount of growth remaining: greater than 12 cm of standing height in girls and more than 14 cm in boys. Sanders et al. [54] have shown that the crankshaft phenomenon decreases substantially after closure of the tri-radiate cartilage.
The second phase of the pubertal growth spurt is the descending side, which corresponds to the deceleration of the velocity of growth. The closure of the elbow (discussed in subsequent text) divides the ascending and descending phases of puberty. The descending phase lasts 3 years from 13 to 16 years of bone age in girls and from 15 to 18 years of bone age in boys. During this phase, both boys and girls will gain about 6 cm in standing height, with 4.5 cm attained from an increase in sitting height and 1.5 cm attained from an increase in subischial limb length. During this phase, the increase in sitting height contributes 80 % of the gain in the standing height [20, 22, 24, 26].
Menarche usually occurs after closure of the olecranon apophysis, on the descending phase of the growth curve when the rate of growth is slowing. This decrease in rate of growth is usually between bone ages of 13 and 13 years 6 months and corresponds to Risser sign I on the iliac apophysis. After this stage, the average girl will gain an additional 4 cm of sitting height and 0.6 cm of subischial limb length. Menarche is not as precise as many other indicators during puberty. Forty-two percent of girls experience menarche before Risser I; 31 %, at Risser II; 8 %, at Risser III; and 5 %, at Risser IV [20, 22, 24, 26]; after 2 years of menarche, there is no more growth.
The descending phase of puberty is characterized by a significant growth of the thorax (Fig. 4.11).
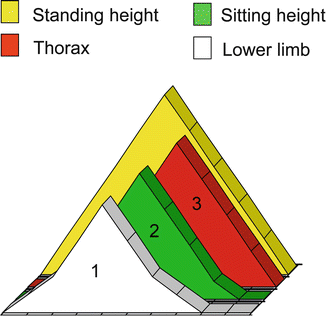

Fig. 4.11
During puberty, the peak growth is a combination of three micropeaks: 1 lower limb growth peak; 2 trunk growth peak; and 3 thorax growth peak
During puberty, the peak growth is a combination of three micropeaks: the first peak involves the lower limb at the very beginning of this period, and the second peak involves the trunk (these two peaks are on the ascending phase of the growth velocity curve), the third peak involves growth of the thorax and occurs during the descending phase of the curve. At skeletal maturity, the final standing height is about 175 cm (±6.6 cm) for boys and about 166 cm (±6 cm) for girls.
Puberty is characterized by a great increase in weight. At the beginning of puberty, the average weight is 40 kg for boys and 33 kg for girls. At skeletal maturity, the average weight of boys is 65 kg (a gain of 25 kg), and the average weight of girls is 56 kg (a gain of 23 kg). During the growth spurt of puberty, the average gain in weight each year is 5 kg [20, 24, 26].
4.4 Estimation of Skeletal Maturity
Bone age does not always match with chronological age. It is a controversial although necessary parameter.
In pediatric orthopedics, chronologic age is of no significance. Everything depends on bone age. Personal data indicate that about 50 % of children have a bone age that is significantly different from their chronologic age. Delayed bone age is characteristic of severe cerebral palsy (total body) involvement. All, reasoning, analyses, forecasting, and decision making, should be based on bone age [2, 14, 19, 20, 22, 24, 25, 55, 56, 58].
Accurate assessment of bone age is not easy. The younger the child, especially before puberty, the more difficult it is to determine future growth, and the more likely it is for errors to be made. In addition, children are often bone age mosaics. Bone age determinations carried out in the hands, elbows, pelvis, and knees will not always agree with one another.
Often, the bone age determination is made too quickly and with too little information. The standard deviations for determining bone age must be understood, as well as the nuances of what to look for in the interpretation of the radiograph. When using a particular method (e.g., the Greulich and Pyle Atlas [34]), it is important to read the entire book to understand what to look for and to know the standard error, rather than simply comparing radiographs. If there is a major decision to be made, it is better to have two interpretations of the child’s bone age and to enlist the support of pediatric radiologists with experience in bone age determination. Cundy et al. [19] demonstrated that four radiologists’ interpretations of skeletal age differed by more than 2 years in 10 % of patients. Carpenter and Lester [14] evaluated bone age in children younger than 10 years. They showed that taking separate readings of the distal radius and ulna, the carpal bones, the metacarpals, and the phalanges could magnify these errors and that the ages of the carpal bones and the distal radius and ulna often lag behind the ages of the metacarpals and phalanges. This means that excessive haste in reading the bone age can result in fatal strategic errors.
There are three basic approaches to the radiographic assessment of skeletal maturity: atlas, sum of scores, and statistical combination of scores. Knowledge of these methods and their limitations is important for the orthopedist, especially in difficult cases. The Greulich and Pyle Atlas [34] is the most familiar and commonly applied approach and involves qualitatively matching the subject’s hand and wrist radiographs against a series of gender-specific standards. This atlas is based on a collection of radiographs of children born between 1917 and 1942. In comparing this atlas with its French counterpart, Sempé and Pavia Atlas [56], we learned that there is no major difference between these two atlases. One of the shortcomings in using the Greulich and Pyle Atlas is that there are few changes in the hand during the critical time of puberty (ascending side of pubertal growth velocity diagram) [20, 26, 28].
For this reason, the author has found the method by Sauvegrain et al. [25, 55] to be of enormous value in assessing children during puberty. This method is the scoring system that evaluates anteroposterior and lateral views of the elbow and assigns a value to the epiphyses. This value is then plotted on a chart to give the bone age. Four ossification centers are taken into consideration: condyle and epicondyle, trochlea, olecranon, and radial epiphysis. This method is reliable and is based on the skeletal maturation of the elbow, which occurs during a 2-year period corresponding to the ascending phase of the growth velocity curve. Therefore, it is extremely helpful in boys aged 13–15 years and in girls aged 11–13 years, a period in which many of the clinical decisions involving future growth are made (spinal arthrodesis). In addition, it shows good correlation with the Greulich and Pyle Atlas but is much easier to use.
At the beginning of puberty, growth centers of the elbow are wide open, but 2 years later, when the peak velocity of the pubertal growth spurt is reached and growth begins to slowdown, they are all completely closed. This complete closure occurs 6 months before Risser I. In the method by Sauvegrain et al., the olecranon is the bone that shows the most characteristic and clear-cut sequences during the first 2 years of puberty [17, 25]. For this reason, the author has described the olecranon method, at the beginning of puberty (at bone age of 11 years in girls and 13 years in boys), two ossification centers appear (Fig. 4.12). Six months later (at bone age of 11.5 years in girls and 13.5 years in boys), they merge to form a half-moon shape. At bone age of 12 years in girls and 14 years in boys, the olecranon apophysis has a rectangular appearance. Six months later (at bone age of 12.5 years in girls and 14.5 years in boys), the olecranon apophysis begins to fuse with the ulna, a process that takes another 6 months, being completed by the bone age of 13 years in girls and 15 years in boys. In our clinical practice experience, the olecranon alone can give rapid and valuable information about bone age. The olecranon method is more accurate in itself because it allows differentiation of bone age in semesters, which is not true for the Greulich and Pyle Atlas for the considered time of puberty [33].
